Social Trust Formation in the Workplace:
Applying the Job Strain Model to
Explain Variations in Social Trust Levels
among Employed Individuals
Tamilina, Larysa and Tamilina, Natalya
Independent Research
1 January 2019
Online at
https://mpra.ub.uni-muenchen.de/93559/
Abstract
This study applies the job strain model (JDC-S) to social trust to analyze how workplace characteristics influence social trust formation patterns. By defining the “workplace” as consisting of (1) workload, (2) control, and (3) social support, the JDC-S model predicts job demands to inversely relate to social trust, whereas job control and social support to positively affect trust among the employed. We utilize the sample of 60250 respondents from the Programme for the International Assessment of Adult Competencies (PIAAC) public-use data to operationalize the three components and to link them to social trust scores. Our analysis provides strong empirical evidence that the three factors are not only associated with trust among employed individuals but that their impact is also contingent on the respondents’ sex and age.
Keywords: social trust; job strain model; job characteristics; workplace properties; multilevel analysis
Social Trust Formation in the Workplace: Applying the Job Strain Model to Explain
Variations in Social Trust Levels among Employed Individuals
Defined as the propensity of people in a society to cooperate (Coleman 1982 and 1990; Hardin 2006; Putnam 2000), social trust is recognized to be a function of numerous factors. An
individual’s employment status is often included among trust determinants (Hall 1999; Van
Oorschot and Arts 2005). Employment relates to more optimism, certainty, or resources, yielding more trust. Unemployment nurtures distrust by placing individuals at a disadvantage relative to others (Hall 1999) or by creating the feeling that social groups, and society as a whole, have deprived the unemployed of opportunities for self-development (Christoforou 2004).
While the positive impact of employment on trust is well documented by theoretical and empirical studies, the relationship between employment properties and trust levels has received only limited attention. Initial research has focused on juxtaposing social trust in large versus small organizations, with a firm’s size viewed as a function of a society’s trust. Large firms are expected to emerge when strangers cooperate, whereas cooperation can only arise when trust already exists among individuals (Fukuyama 1995; La Porta et al. 1997). Further research has expanded the scope of analysis from a firm’s size to various aspects of a firm’s performance demonstrating that intra-firm trust improves financial performance (Goergen et al. 2012), labor productivity, and product or service quality (Brown et al. 2014).
(Mayer and Davis 1999), or HR practices, such as having formalized policies and procedures (Blunsdon and Reed 2003). Companies may destroy trust when resorting to restricting paid overtime as a means of dealing with recession (Brown et al. 2014). The amount of training provided by a firm to employees promotes the emergence of trust in management, whereas a
respondent’s union membership, workplace tenure or perceived workload may lead to a
substantial decline in trust levels among the employed (Brown et al. 2014; Helliwell, Huang, and Putnam 2009).
This study contributes to the literature on the employment-trust nexus, by overcoming two key limitations in the current research. First, the analysis is often based on a narrow concept of trust, such as employee trust in management. This constitutes a considerable shortcoming given the recent findings that the workplace reflects the attributes of an individual’s environment and can provide exposure to general social norms influencing trust towards other individuals, as well. For instance, Grund and Harbring (2009) suggest that the level of control at one’s
workplace changes generalized trust. More control leads one to trust others less, since it prompts individuals not to rely solely on trust but to resort to institutional mechanisms instead.
Considering that an employed person spends about one third of the day (seen as 24 hours) at work, current research thereby overlooks an important field where social trust is formed and ignores numerous factors that can influence trust levels in society.
characteristics relate to social trust has never been analyzed in their integrity. This can be explained by the fact that there is no conceptual framework in the trust literature that clearly defines which workplace properties might influence trust emergence. We argue that the job strain model, widely used to analyze the impact of job characteristics on an individual’s mental and physical health, can be applied to explore how workplace properties affect social trust levels. By outlining the unobservable concept of the workplace, this model offers an analytical framework for identifying mechanisms that can explain social trust formation in the job.
BACKGROUND
The job strain model, often referred to as the JDC-S model, is used to study the impact of job characteristics on different aspects of an individual’s mental and physical health. In particular, it has been applied to predict the incidence and prevalence of all-cause mortality (Kivimäki et al. 2006; Shirom et al. 2009: Shirom et al. 2011; Steenland et al. 2000), describe determinants of an individual’s psychological well-being (De Lange et al. 2003; Häusser et al. 2010), and explain variations in an employee’s physical health (Uchino 2004). According to the JDC-S model, the workplace can be divided into three components: (1) job demands, (2) control, and (3) social support (Karasek and Theorell 1990). The job demands category refers to psychological job demands, primarily defined as one’s perceived workload and further narrowed to quantitative
measures of one’s overload in the job. Work overload creates stress, anger, aggressive behavior
or conflicts, which is expected to negatively influence an individual’s mental and physical health through increased activation of the hypothalamic-pituitary-adrenocortical system, sleep
aims at reducing uncertainty in the workplace through providing exact instructions on how job tasks must be done. Social support refers to “overall levels of helpful social interaction available
on the job from both coworkers and supervisors” (Karasek and Theorell 1990). Socialization at
the workplace is anticipated to lead to a more positive work experience and stimulate a healthy work culture, since people enjoy working with someone who is familiar. The literature
distinguishes between peer social support and supervisor social support. By reflecting how well a participant is socially integrated into their employment context, peer social support proves to better predict health outcomes than supervisor social support (Mookadam and Arthur 2004; Shirom et al. 2011).
The job strain model assumes job demands will negatively relate to the individual’s psychological and physical health variables, whereas job control and social support will positively affect them. The JDC-S model further assumes the effects of job demands on
psychological and physiological strains to be moderated by job control and by work-based social support (De Lange et al. 2003; Van Der Doef and Maes 1998 and 1999). Research also points out that the interaction hypothesis receives support only when focusing on those dimensions of control and social support which are qualitatively relevant to the job demands under study (De Jonge and Dormann 2006; Karasek and Theorell 1990).
based on male or mixed-sex samples (Van der Doef and Maes 1999). For instance,
Nieuwenhuijsen, Bruinvels, and Frings-Dresen (2010) suggest that low levels of control are a risk factor for stress related disorders among men but not among women, whereas Shirom et al. (2011) point out that control reduces the risk of mortality for men and increases it for women.
Also, the JDC-S factor effects are expected to vary across age. The model better predicts health outcomes for individuals in the 38-45 age brackets than in the older or younger brackets (Shirom et al. 2011). The JDC-S components appear to have an accumulating impact, with the healthy worker effect becoming noticeable as one ages (Uchino 2004). Kivimäki et al. (2008) argue, however, that including employees over 45 in a sample may delude the associations among the model’s key components and various health measures.
By replacing the measures of an individual’s physical and mental health with trust scores, we utilize the job strain model’s framework to analyze social trust. This strategy is in line with the current understanding of trust formation since social trust is often considered as a
psychological state (Barber 1983; Jones 1996; Lewis and Weigert 1985) that is governed by both cognitive and affective processes (Ryff, Singer, and Dienberg Love 2004), while being
embedded within complex neural and hormonal systems (Borum 2010). At the same time, multiple studies have evidenced a strong relationship between social trust and general health or disease-specific outcomes (e.g., cardiovascular disease, cancer) (Almedom and Glandon 2008; Gundelach and Kreiner 2004; Kim, Subramanian, and Kawachi 2008; Lynch et al. 2001)1, often viewing social trust as shaped by an individual’s mental health or physical condition. Sturgis, Patulny, and Allum (2009) suggest that individuals with physical or mental disabilities,
behavior in general and social trust in particular. Laurence (2015) demonstrates that increased mental distress leads to a decline in social trust levels, whereas developing a health problem (mental or physical) is often interpreted as a negative experience that reduces an individual’s trust (Kim et al. 2008; Uslaner 2002). Applying the job strain model to social trust analysis does not hence contradict the existing definition of trust, but can allow including job-related factors in explaining the variation of trust levels among employed individuals.
Based on the logic of the JDC-S model, we postulate the following hypotheses:
Hypothesis 1: Job demands are expected to negatively affect social trust whereas job
control and social support will positively affect trust levels.
Hypothesis 2: The negative effects of job demands on social trust are expected to be
moderated by job control and social support.
Hypothesis 3: The effects of job demands, control, and social support on social trust are
expected to vary across sex and age.
DATA AND METHODS
To test our hypotheses empirically, we utilize the public-use data from the Programme for the International Assessment of Adult Competencies (PIAAC) conducted by the OECD in 2012. The
survey evaluates adults’ proficiency in key information-processing skills and gathers information
on how respondents use their skills at home, at work and in the wider community (see
Our sample includes Belgium (Flanders), the Czech Republic, Denmark, Estonia, Finland, France, Germany, Ireland, Italy, Japan, Korea, the Netherlands, Norway, Poland, the Russian Federation, the Slovak Republic, Spain, Sweden, the United Kingdom (England and Northern Ireland), and the USA. The analysis excludes Australia, Austria, and Canada, since data for many employment-related variables are unavailable for these countries. The sample is
restricted to respondents aged between 16 and 65 years. We only select those respondents who were employed or had a paid job at the time the survey was conducted. The following set of variables is used to empirically test our hypotheses (see Table 1 for descriptive statistics).
[Table 1 about here]
Dependent Variable
The PIAAC contains two questions that approximate the respondents’ social trust. The first
measures an individual’s trustworthiness levels by asking about the extent to which respondents
agree with the statement that “there are only few people they can trust completely”. The second
captures one’s caution levels by asking about the degree to which respondents agree with the
statement that “if you are not too careful, people will take advantage of you”. We use the two measures in our analysis separately, since caution and trustworthiness are recognized to be independent facets of trust (Ben-Ner and Halldorsson 2010; Borum 2010; Miller and Mitamura
2003). Both questions have an initial response scale varying from 1 “strongly agree” to 5
“strongly disagree”. We make the two variables dichotomous by assigning the value of one when
the initial responses are “4”or “5” and the value of zero when otherwise.
The job demands factor measures an individual’s quantitative overload operationalised through three variables: work hours, task complexity, and job sector. Work hours represent a direct measure of workload and refer to the number of weekly work hours. Task complexity captures the variety and complexity of job tasks that the individual has as part of their workplace
responsibilities and is operationalized through the frequency with which the respondent does 18 work-related tasks relevant to reading, writing, or using mathematics. Each item has responses varying from 1"never" to 5 "every day". Since all of the tasks require cognitive action, we combine the responses into one variable. The final construct has values ranging from 18 "doing none of the tasks listed" to 90 "doing all of the tasks listed every day". The job sector variable
indirectly approximates one’s workload and is derived from recent findings that private sector
jobs involve more stress, more tasks and higher competition at the workplace as compared to public or non-profit sector jobs (Blaug, Kenyon, and Lekhi 2007; Demmke 2005; Munnell and Fraenkel 2013). It is operationalized through two dummies specifying whether the individual’s job belongs to the private or non-profit sector, with the public sector representing a reference category.
Control includes four items assessing the extent to which the respondent is able to choose
or change (1) the sequence of tasks, (2) how one does their work, (3) the speed or rate at which one works, and (4) working hours. The response scale for each question varies from 1 “not at all”
to 5 “to a very high extent.”
Social support is operationalized through three items approximating the individual’s
contacts with co-workers or supervisors for work-related reasons such as learning, cooperating or sharing work-related information. The first item describes the frequency with which the
the response scale ranging between 1 “never” and 5 “every day.” The second item specifies the share of time that the respondent usually spends on cooperating or collaborating with
co-workers, with the response values varying from 1 “none of the time” to 5 “all the time.” The third item represents the frequency with which the respondent interacts in the workplace for sharing work-related information, with responses ranging between 1 “never” and 5 “every day.” We admit that the selected measures only remotely capture the quality of social environments in the job by exclusively focusing on interactions for work-related reasons. The choice of
operationalizations is driven by the PIAAC’s limited availability of variables relevant to
socialization in the workplace.
The set of selected operationalizations for the independent variables are rescaled to change between zero and one.
Control Variables
We control for the conventional determinants of trust: one’s participation in volunteering, political efficacy, health condition, immigration status, and age. Participation in voluntary activities is measured by asking how often the respondent did voluntary work in the last twelve
months, with responses varying from 1 “never” to 5 “every day”. Political efficacy is
operationalised by asking respondents to specify whether they agree with the following statement
“People like me do not have any say about what the government does”. The response scale
ranges between 1 “strongly agree” to 5 “strongly disagree”. Health condition is measured by
In addition, we control for workplace characteristics such as company size, managerial
responsibilities, the level of challenge at work and one’s participation in learning. The company
size variable refers to the number of people working for the respondent’s current employer. The
responses vary from 1 “1 to 10 people”to 5 “more than 1000 people.” One’s involvement in
managerial responsibilities is captured by a dummy variable that takes the value of 1 if the respondent currently manages or supervises other employees. The level of challenge at the workplace is measured through a dummy that takes the value of 1 if the individual specifies that they can cope with more demanding duties than those that are currently required at their job. Participation in lifelong learning is measured by a set of questions where respondents choose whether they did any of the following learning activities within the last twelve months: (1) courses or private lessons, (2) seminars or workshops, (3) courses conducted through open or distance education, (4) any organised sessions for on-the-job training or training by supervisors or co-workers. Since each item has two values with 1 “yes” or 0 “no”, we sum up responses to the above questions so that the final construct has values ranging from 0 “no participation in
lifelong learning” to 4 “active participation in lifelong learning”.
Methods Used in the Analysis
We primarily use a multilevel analysis to account for the hierarchical structure of our data (Kreft and De Leeuw 1998) and to prevent the un-modelled country information from all being pooled into the single individual error term (Luke 2004). The main effect model takes the following form:
The interactions between the main factors are modelled as
Trustij= γ00+γ10Job_demandsij+γ20Controlij+γ30Social_supportij+ γ40(Job_demands*Control)ij+
γ50(Job_demands*Social_support)ij+γ60Xij+m0j+εij (2)
Here, Trust is the respondents’ trust scores. Job_demands, Control, Social_support are the JDC-S model’s key components operationalised as described above. Job_demands*Control and Job_demands*Social_support are the interaction terms between the job demands variables and the two other key model factors. X is the set of individual-level control variables; m is the country-level variance, whereas εis the individual-level variance. The STATA gllamm command
is utilised for calculating the model’s parameters. Since social trust is a dichotomous variable,
the logit link is specified together with the binomial family sub-option. Additionally, we include the adapt option, which causes adaptive quadrature to be used instead of ordinary quadrature.
EMPIRICAL RESULTS
The base model results (see Table 2) are consistent with the conventional understanding of trust formation processes (Christoforou 2004; Hall 1999; Van Oorschot and Arts 2005). Participation in voluntary activities promotes trust emergence. Trust is more likely to appear among
declines when respondents are not challenged by their job. Finally, participation in lifelong learning promotes trust formation among the employed.
[Table 2 about here]
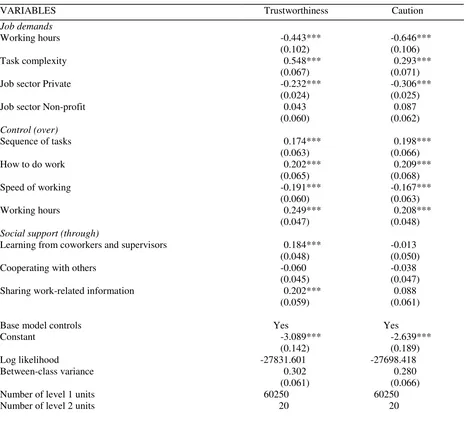
We further augment the base trust regression with the JDC-S model’s key predictors (see Table 3). As the theory suggests, the two measures of job demands (work hours and job sector type) relate negatively to social trust, with task complexity in contrast reinforcing trust among the employed. Opposite to the JDC-S model predictions, control levels represent a negative factor for social trust formation. Less flexibility regarding the choice of task sequence, how work is accomplished, and work hours prove to negatively relate to the two trust measures. The only exception here is control over the speed or rate at which one works, with more control of this kind yielding more trust.
As predicted by the job strain model, the social support variables positively impact social trust, especially with respect to trustworthiness. Employee interactions for the purpose of
learning or sharing work-related information are positively associated with trust levels,
suggesting that workplace socialization should be integrated in the experiential perspective on trust. Like any other form of socialization, interactions for work-related reasons can also
contribute to nurturing reciprocity, cooperation, empathy for others, and an understanding of the common interest and common good and thereby change trust levels.
of additional control variables. The JDC-S model’s constructs still remain strong predictors of social trust, without the direction of their impact to reverse.
[Table 3 about here]
Overall, we only received partial support for Hypothesis 1. The greatest deviation from
the model’s predictions have been found with regard to the impact that control levels conduct on
social trust. This finding can be explained by the fact that in the case of social trust, individuals appraise tangible results not by their objective worth but by the manner in which they are attained (De Charms 1968). Previous studies on trust have also demonstrated a negative
relationship between control levels in the workplace and social trust scores. Increased control at work may prompt individuals to trust less as they learn that others expect them not to be
trustworthy, which might be interpreted as a general social norm (Grund and Harbring 2009) and extrapolated to trusting others in environments unrelated to a job.
Including interactions into the trust equations does not provide evidence for the JDC-S model’s expectations regarding smoothing effects that control and social support conduct on job demands’ negative influence on social trust (see Table 4). We establish only few statistically significant interactions and hence no support for Hypothesis 2. Note that one should focus on the specific dimensions of control and social support that are qualitatively relevant to the job
[Table 4 about here]
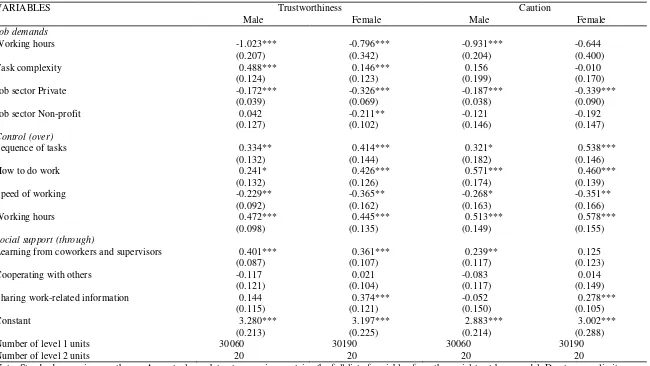
We now turn to the question of how an individual’s sex and age modify the relationship between the JDC-S model’s three constructs and social trust. In line with Hypothesis 3, our results suggest that men and women differ in how job demands, control, and social support influence the key dependent variables (see Table 5). Men are more negatively affected by the workload, as measured through the number of work hours, whereas women’s social trust is more sensitive to their job sector. Control is more of an issue for women than for men, which is
commensurate with other studies (Shirom et al. 2011; Waldenstrom and Harenstam 2008). Social support is more important for women than for men, especially with respect to trustworthiness. In the case of caution, the positive impact of learning from others was established among men, whereas women need more contacts that involve sharing work-related information in order to develop trust. Shirom et al. (2011) and Waldenstrom and Harenstam (2008) suggest that
differences in the type of jobs occupied by men and women can explain variations in the JDC-S key factors’ impact on the dependent variables, based on an individual’s sex.
[Table 5 about here]
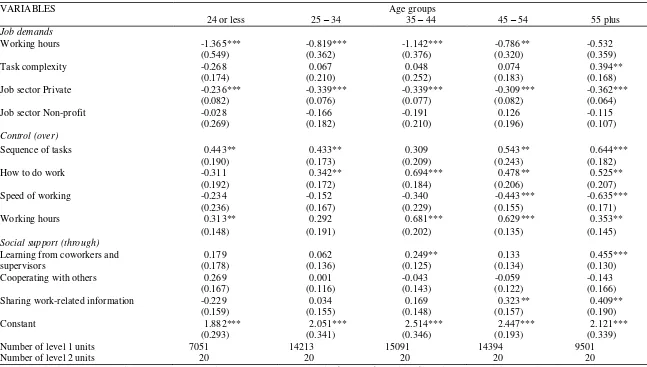
cumulative effect when analyzing variations in how the selected control items impact the trust measures. The strength of their influence is greater for older individuals and with the caution measure of trust. In line with Shirom et al. (2011), the positive impact of social support (through learning from others) on trust scores is greater for those in the 35-44 age bracket than in the older or younger cohorts. Similarly, social support through sharing information with others increases in its strength with age with both measures of social trust. These results support Uchino’s study (2004), demonstrating that job strain model factors may predict outcomes more powerfully as one becomes older, assuming the stability of workplace properties across time.
[Table 6 and Table 7 about here]
Overall, our results reflect the existence of strong associations between workplace
properties and social trust. Of course, these associations are probabilistic and not deterministic in nature, and having low workload and control or wide social networks in the job does not
automatically mean that one would have high levels of social trust. It means, however, that that individual is more likely to have social trust above average than average trust. Workplace can powerfully affect an individual’s trust by providing multiple experiences that change one’s core sense of self that is used to evaluate others in everyday life. By subtly shifting one’s self-concept, job environments may shape how that person judges others not only in job-relevant contexts but also in contexts outside of workplace (Goffman 1959).
This study argues that the analysis of social trust formation should go beyond the traditional sources relevant to family, networks, society, and government. Workplaces should be
incorporated into the research on trust determinants. By applying the JDC-S model, we link the workplace to social trust and demonstrate that trust is a function of the workload, control levels at work, and social support. We also look into interactions between the three workplace factors but do not establish any substantial modifying effects that control or social support may have on
job demands’ negative impact on trust levels. Finally, we test the extent to which the JDC-S
model’s main effects are contingent on sex and age. Social trust among men proves to be more
sensitive to workload and social support through learning, whereas trust levels among women relate more powerfully to control items and social support through sharing work-related
information. With respect to age, cumulative effects appear not only in the case of social support, as previous studies on the JDS-C model suggest (Shirom et al. 2011; Uchino 2004), but also in the case of control and job demand items.
Further research is needed, however, to further validate our findings. First, longitudinal data can be used to control for any potential endogeneity of some of the right-hand side
variables. Individuals may choose jobs and work environments that suit their trust levels. Similarly, employers may seek out and recruit people for certain job slots according to their perceptions of those workers’ attributes, including their propensity to trust. Second, better operationalizations should be found for job demands and social support items. The workload measure used in our analysis does not capture the multiple types of stress that characterize a
participant’s job, whereas social support limited to the frequency of workplace contacts does not
NOTES
REFERENCES
Almedom, Astier M. and Douglas Glandon. 2008. “Social Capital and Mental Health: An Updated Interdisciplinary Review of Primary Evidence.” Pp. 191–214 in Social Capital and Health, edited by I. Kawachi, S. V. Subramanian, and D. Kim. New York: Springer.
Barber, Bernard.1983. The Logic and Limits of Trust. New Brunswick, NJ: Rutgers University Press.
Ben-Ner, Avner and Freyr Halldorsson. 2010. “Trusting and Trustworthiness: What Are They, How to Measure Them and What Affects Them?” Journal of Economic Psychology 31(1):64–79.
Blaug, Ricardo, Amy Kenyon, and Rohit Lekhi. 2007. Stress at Work. London: The Work Foundation.
Blunsdon, Betsy and Ken Reed. 2003. “The Effects of Technical and Social Conditions on Workplace Trust.” International Journal of Human Resource Management 14(1):12–27. Borum, Randy. 2010. “The Science of Interpersonal Trust.” Mental Health Law and Policy
Faculty Publications. Paper No. 574, University of South Florida.
Brown, Sarah, Daniel Gray, Jolian McHardy, and Karl Taylor. 2014. “Employee Trust and Workplace Performance.” IZA Discussion Paper No. 8284, Institute for the Study of Labor (IZA), Bonn.
Christoforou, Asimina. 2004. “On the Determinants of Social Capital in Countries of the European Union.” Paper Prepared for the Espanet Conference “European Social Policy: Meeting the Needs of a New Europe,” September 9-11, Oxford, England.
Coleman, James S. 1990. Foundations of Social Theory. Cambridge, MA: Harvard University Press.
De Charms, Richard. 1968. Personal Causation: The Internal Affective Determinants of Behavior. New York: Academic Press.
De Jonge, Jan and Christian Dormann. 2006. “Stressors, Resources, and Strain at Work: A Longitudinal Test of the Triple-Match Principle.” Journal of Applied Psychology 91(6):1359–74.
De Lange, Annet H., Toon W. Taris, Michiel A. J. Kompier, Irene L. D. Houtman, and Paulien M. Bongers. 2003. ““The Very Best of the Millennium”: Longitudinal Research and the Demand-Control (-Support) Model.” Journal of Occupational Health Psychology 8(4):282–305.
Demmke, Christoph. 2005. Are Civil Servants Different Because They Are Civil Servants? Luxembourg: European Institute of Public Administration.
Fukuyama, Francis. 1995. Trust. New York: Free Press.
Goergen, Marc, Salim Chanine, Chris Brewster, and Geoffrey Wood. 2012. “Trust, Owner Rights, Employees and Firm Performance.” Working Paper No. 336/2012, European Corporate Governance Institute.
Goffman, Erving. 1959. The Presentation of Self in Everyday Life. New York: Anchor.
Grund, Christian and Christine Harbring. 2009. “Trust and Control at the Workplace: Evidence
from Representative Samples of Employees in Europe.” IZA Discussion Paper No. 4297,
Institute for the Study of Labor (IZA), Bonn.
Hall, Peter A. 1999. “Social Capital in Britain.” British Journal of Political Science 29(3):417– 61.
Hardin, Russell. 2006. Trust. Cambridge: Polity Press.
Häusser, Jan Alexander, Andreas Mojzisch, Miriam Niesel, and Stefan Schulz-Hardt. 2010. “Ten Years on: A Review of Recent Research on the Job Demand-Control (-Support) Model and Psychological Well-being.” Work and Stress 24(1):1–35.
Helliwell, John F., Haifang Huang, and Robert D. Putnam. 2009. “How’s the Job? Are Trust and Social Capital Neglected Workplace Investments?” Pp. 87–144 in Social Capital:
Reaching Out, Reaching In, edited by V.O. Bartkus and J.H. Davis. Cheltenham: Edward
Elgar.
Jones, Karen. 1996. “Trust as an Affective Attitude.” Ethics 107(1):4–25.
Karasek, Robert and Tores Theorell. 1990. Healthy Work: Stress, Productivity, and the Reconstruction of Working Life. New York: Basic Books.
Kawachi, Ichiro and Lisa F. Berkman. 2000. “Social Cohesion, Social Capital, and Health.” Pp. 174–90 in Social Epidemiology, edited by L.F. Berkman and I. Kawachi. New York: Oxford University Press.
Kawachi, Ichiro, Bruce P. Kennedy, Kimberly Lochner, and Deborah Prothrow-Stith. 1997.
“Social Capital, Income Inequality, and Mortality.” American Journal of Public
Health 87(9):1491–98.
Kim, Daniel, S. V. Subramanian, and Ichiro Kawachi. 2008. “Social Capital and Physical Health: A Systematic Review of the Literature.” Pp. 139–90 in Social Capital and Health, edited by I. Kawachi, S.V. Subramanian, and D. Kim. New York: Springer.
Kivimäki, Mika, Tores Theorell, Hugo Westerlund, Jussi Vahtera, and Lars Alfredsson. 2008.
“Job Strain and Ischaemic Disease: Does the Inclusion of Older Employees in the Cohort
Dilute the Association? The WOLF Stockholm Study.” Journal of Epidemiology and Community Health 62(4):372–74.
Kivimäki, Mika, Marianna Virtanen, Marko Elovainio, Anne Kouvonen, Ari Väänänen, and Jussi Vahtera. 2006. “Work Stress in the Etiology of Coronary Heart Disease – A Meta-Analysis.” Scandinavian Journal of Work Environment and Health 32(6):431–42. Kreft, Ita and Jan De Leeuw. 1998. Introducing Multilevel Modeling. Thousand Oaks, CA: Sage
Publications.
La Porta, Rafael, Florencio Lopez-de-Silanes, Andrei Shleifer, and Robert W. Vishny. 1997.
“Trust in Large Organizations.” American Economic Review (Papers and Proceedings)
87(2):333–38.
Laurence, James. 2015. “(Dis)Placing Trust: The Long-Term Effects of Job Displacement on Generalized Trust over the Adult Life Course.” Social Science Research 50(1):46–59. Lewis, David J. and Andrew Weigert. 1985. “Trust as a Social Reality.” Social Forces
63(4):967–85.
Luke, Douglas A. 2004. Multilevel Modeling. Thousand Oaks, CA: Sage Publications.
Mayer, Roger C. and James H. Davis. 1999. “The Effect of the Performance Appraisal System on Trust for Management: A Field Quasi-Experiment.” Journal of Applied Psychology 84(1):123–36.
Melamed, Samuel, Arie Shirom, Sharon Toker, Shlomo Berliner, and Itzhak Shapira. 2006.
“Burnout and Risk of Cardiovascular Disease: Evidence, Possible Causal Paths, and
Promising Research Directions.” Psychological Bulletin 132(3):327–53.
Miller, Alan S. and Tomoko Mitamura. 2003. “Are Surveys on Trust Trustworthy?” Social Psychology Quarterly 66(1):62–70.
Mookadam, Farouk and Heather M. Arthur. 2004. “Social Support and Its Relationship to Morbidity and Mortality after Acute Myocardial Infarction: Systematic Overview.” Archives of Internal Medicine 164(14):1514–18.
Munnell, Alicia H. and Rebecca Cannon Fraenkel. 2013. “Public Sector Workers and Job Security.” Issue No. 31. Center for Retirement Research, Boston College.
Nieuwenhuijsen, Karen, David Bruinvels, and Monique Frings-Dresen. 2010. “Psychosocial Work Environment and Stress-Related Disorders, a Systematic Review.” Occupational Medicine 60(4):277–86.
Putnam, Robert D. 2000. Bowling Alone. New York: Simon and Schuster.
Ryff, Carol D., Burton H. Singer, and Gayle Dienberg Love. 2004. “Positive Health: Connecting Well-being with Biology.” Philosophical Transactions of the Royal Society of London, Series B, Biological Science 359(1449):1383–94.
Shirom, Arie, Samuel Melamed, Ori Rogowski, Itzhak Shapira, and Shlomo Berliner. 2009.
among Apparently Healthy Employed Adults.” Journal of Occupational Health Psychology 14(4):349–64.
Shirom, Arie, Sharon Toker, Yasmin Alkaly, Orit Jacobson, and Ran Balicer. 2011. “Work
-Based Predictors of Mortality: A 20-Year Follow-Up of Healthy Employees.” Health Psychology 30(3):268–75.
Shirom, Arie, Sharon Toker, Shlomo Berliner, and Itzhak Shapira. 2008. “The Job Demand-Control-Support Model and Stress-Related Low-Grade Inflammatory Responses among Healthy Employees: A Longitudinal Study.” Work and Stress 22(2):138–52.
Shirom, Arie, Mina Westman, Ora Shamai, and Rafael S. Carel. 1997. “Effects of Work
Overload and Burnout on Cholesterol and Triglycerides Levels: The Moderating Effects of Emotional Reactivity among Male and Female Employees.” Journal of Occupational Health Psychology 2(4):275–88.
Steenland, Kyle, Lawrence J. Fine, Karen Belkic, Paul Landsbergis, Peter Schnall, Dean Baker, et al. 2000. “Research Findings Linking Workplace Factors to Cardiovascular Disease Outcomes.” Occupational Medicine-State of the Art Reviews 15(1):7–68.
Sturgis, Patrick, Roger Patulny, and Nick Allum. 2009. “Re-evaluating the Individual Level Causes of Trust: A Panel Data Analysis.” Working Paper, University of Essex. Uchino, Bert N. 2004. Social Support and Physical Health: Understanding the Health
Consequences of Relationships. New Haven, CT: Yale University Press.
Van der Doef, Margot and Stan Maes. 1998. “The Job Demand-Control (-Support) Model and Physical Health Outcomes: A Review of the Strain and Buffer Hypotheses.” Psychology and Health 13(5):909–36.
Van der Doef, Margot and Stan Maes. 1999. “The Job Demand-Control (-Support) Model and Psychological Well-being: A Review of 20 Years of Empirical Research.” Work and Stress 13(2):87–114.
Van Oorschot, Wim and Wil Arts. 2005. “The Social Capital of European Welfare States: The Crowding Out Hypothesis Revisited.” Journal of European Social Policy 15(1):5–26. Van Wanrooy, Brigid, Helen Bewley, Alex Bryson, John Forth, Stephanie Freeth, Lucy Stokes,
and Stephen Wood. 2013. Employment Relations in the Shadow of Recession: Findings from the 2011 Workplace Employment Relations Study. London: Palgrave MacMillan.
Table 1. Descriptive Statistics for the Key Variables Used in the Analysis.
VARIABLES Obs. Mean Std. dev. Min. Max.
Social trust: trustworthiness 60250 0.228 0.419 0 1
Social trust: caution 60250 0.206 0.404 0 1
Job demands
Working hours 60250 0.379 0.117 0 1
Task complexity 60250 0.397 0.215 0 1
Job sector Private 60250 0.681 0.465 0 1
Job sector Non-profit 60250 0.029 0.168 0 1
Control (over)
Sequence of tasks 60250 0.668 0.252 0 1
How to do work 60250 0.679 0.245 0 1
Speed of working 60250 0.670 0.237 0 1
Working hours 60250 0.493 0.267 0 1
Social support (through)
Learning from coworkers and supervisors 60250 0.643 0.257 0 1
Cooperating with others 60250 0.677 0.282 0 1
Sharing work-related information 60250 0.858 0.233 0 1
Key control variables
Participation in volunteering 60250 1.620 1.005 1 5
Political efficacy 60250 2.786 1.252 1 5
Subjective health condition 60250 2.477 0.977 1 5
Born in the country 60250 0.912 0.283 0 1
Age 60250 3.086 1.251 1 5
Company size 60250 2.466 1.215 1 5
Managerial responsibilities 60250 0.294 0.456 0 1
Challenged by the job 60250 0.829 0.377 0 1
Life-long learning 60250 0.238 0.245 0 1
Additional control variables
Intelligence level 60250 0.562 0.126 0 1
Satisfaction with job 60250 2.017 0.837 1 5
Income 57910 3.397 1.458 1 6
Table 2. Base Social Trust Model.
VARIABLES Trustworthiness Caution
Participation in volunteering 0.112*** 0.067***
(0.010) (0.011)
Political efficacy 0.389*** 0.306***
(0.009) (0.009)
Subjective health condition 0.195*** 0.209***
(0.012) (0.012)
Born in the country 0.184*** 0.244***
(0.039) (0.041)
Age 0.092*** 0.119***
(0.009) (0.009)
Company size 0.046*** 0.039***
(0.009) (0.009)
Managerial responsibilities 0.082*** 0.086***
(0.023) (0.024)
Challenged by the job -0.059** -0.103***
(0.029) (0.029)
Life-long learning 0.765*** 0.732***
(0.045) (0.047)
Constant -2.978*** -2.913***
(0.141) (0.131)
Log likelihood -28022.561 -26221.358
Between-class variance 0.304 0.548
(0.093) (0.124)
Number of level 1 units 60250 60250
Number of level 2 units 20 20
Note: Standard errors in parentheses.
Table 3. The JDC-S Model Applied to Social Trust.
VARIABLES Trustworthiness Caution
Job demands
Working hours -0.443*** -0.646***
(0.102) (0.106)
Task complexity 0.548*** 0.293***
(0.067) (0.071)
Job sector Private -0.232*** -0.306***
(0.024) (0.025)
Job sector Non-profit 0.043 0.087
(0.060) (0.062)
Control (over)
Sequence of tasks 0.174*** 0.198***
(0.063) (0.066)
How to do work 0.202*** 0.209***
(0.065) (0.068)
Speed of working -0.191*** -0.167***
(0.060) (0.063)
Working hours 0.249*** 0.208***
(0.047) (0.048)
Social support (through)
Learning from coworkers and supervisors 0.184*** -0.013
(0.048) (0.050)
Cooperating with others -0.060 -0.038
(0.045) (0.047)
Sharing work-related information 0.202*** 0.088
(0.059) (0.061)
Base model controls Yes Yes
Constant -3.089*** -2.639***
(0.142) (0.189)
Log likelihood -27831.601 -27698.418
Between-class variance 0.302 0.280
(0.061) (0.066)
Number of level 1 units 60250 60250
Number of level 2 units 20 20
Note: Standard errors in parentheses. As controls, each trust regression contains the full list of variables from the social trust base model.
Table 4. The Analysis of Modifying Effects of Control and Social Support on the Relationship between Job
Demands and Social Trust.
VARIABLES Trustworthiness Caution
Interactions between Job demands and Control
Working hours*Control over sequence of tasks 0.761 0.784
(0.579) (0.478)
Working hours*Control over how to do work 0.028 0.269
(0.175) (0.403)
Working hours*Control over speed of working 0.132 0.333
(0.382) (0.532)
Working hours*Control over choosing working hours 0.047 0.332
(0.333) (0.348)
Task complexity*Control over sequence of tasks 0.734*** 0.234
(0.211) (0.370)
Task complexity*Control over how to do work 0.537*** 0.386
(0.130) (0.272)
Task complexity*Control over speed of working 0.314 0.033
(0.219) (0.334)
Task complexity*Control over choosing working hours 0.429** 0.265
(0.199) (0.269)
Job sector Private*Control over sequence of tasks 0.001 -0.092
(0.097) (0.096)
Job sector Non-profit*Control over sequence of tasks 0.231 -0.036
(0.264) (0.287)
Job sector Private*Control over how to do work -0.045 -0.153
(0.102) (0.152)
Job sector Non-profit*Control over how to do work 0.125 0.144
(0.283) (0.289)
Job sector Private* Control over speed of working 0.146 0.059
(0.101) (0.122)
Job sector Non-profit*Control over speed of working 0.149 0.146
(0.277) (0.269)
Job sector Private*Control over choosing working hours -0.114 -0.244***
(0.105) (0.089)
Job sector Non-profit*Control over choosing working hours 0.106 0.008
(0.307) (0.234)
Interactions between Job demands and Social support
Working hours*Learning from coworkers and supervisors -0.172 0.209
(0.338) (0.388)
Working hours*Cooperating with others -0.307 -0.567
(0.319) (0.429)
Working hours*Sharing work-related information 0.127 -0.308
(0.368) (0.490)
Task complexity*Learning from coworkers and supervisors 0.255 -0.078
(0.206) (0.203)
Task complexity*Cooperating with others 0.195 0.067
(0.225) (0.283)
(0.230) (0.228)
Job sector Private*Learning from coworkers and supervisors -0.127 -0.256***
(0.094) (0.098)
Job sector Non-profit*Learning from coworkers and supervisors 0.159 -0.439*
(0.247) (0.250)
Job sector Private*Cooperating with others 0.085 -0.070
(0.084) (0.104)
Job sector Non-profit*Cooperating with others 0.078 -0.083
(0.223) (0.225)
Job sector Private*Sharing work-related information 0.086 -0.296**
(0.114) (0.118)
Job sector Non-profit*Sharing work-related information 0.798*** -0.247
(0.306) (0.282)
Number of level 1 units 60250 60250
Number of level 2 units 20 20
Note: Standard errors in parentheses. The interaction terms are included sequentially in the social trust augmented model.
VARIABLES Trustworthiness Caution
Male Female Male Female
Job demands
Working hours -1.023*** -0.796*** -0.931*** -0.644
(0.207) (0.342) (0.204) (0.400)
Task complexity 0.488*** 0.146*** 0.156 -0.010
(0.124) (0.123) (0.199) (0.170)
Job sector Private -0.172*** -0.326*** -0.187*** -0.339***
(0.039) (0.069) (0.038) (0.090)
Job sector Non-profit 0.042 -0.211** -0.121 -0.192
(0.127) (0.102) (0.146) (0.147)
Control (over)
Sequence of tasks 0.334** 0.414*** 0.321* 0.538***
(0.132) (0.144) (0.182) (0.146)
How to do work 0.241* 0.426*** 0.571*** 0.460***
(0.132) (0.126) (0.174) (0.139)
Speed of working -0.229** -0.365** -0.268* -0.351**
(0.092) (0.162) (0.163) (0.166)
Working hours 0.472*** 0.445*** 0.513*** 0.578***
(0.098) (0.135) (0.149) (0.155)
Social support (through)
Learning from coworkers and supervisors 0.401*** 0.361*** 0.239** 0.125
(0.087) (0.107) (0.117) (0.123)
Cooperating with others -0.117 0.021 -0.083 0.014
(0.121) (0.104) (0.117) (0.149)
Sharing work-related information 0.144 0.374*** -0.052 0.278***
(0.115) (0.121) (0.150) (0.105)
Constant 3.280*** 3.197*** 2.883*** 3.002***
(0.213) (0.225) (0.214) (0.288)
Number of level 1 units 30060 30190 30060 30190
Number of level 2 units 20 20 20 20
Note: Standard errors in parentheses. As controls, each trust regression contains the full list of variables from the social trust base model. Due to space limits, we do not report estimations for the between-class variance and log likelihood.
[image:32.792.77.727.121.487.2]Table 6. The JDC-S Model Applied to Social Trust by Age: The Case of Trustworthiness.
VARIABLES Age groups
24 or less 25 – 34 35 – 44 45 – 54 55 plus
Job demands
Working hours -1.296*** -0.858*** -1.239*** -0.724** -1.119***
(0.330) (0.282) (0.237) (0.288) (0.192)
Task complexity 0.189 0.284* 0.238 0.462*** 0.045
(0.204) (0.166) (0.204) (0.160) (0.221)
Job sector Private -0.244*** -0.309*** -0.267*** -0.188*** -0.301***
(0.078) (0.054) (0.065) (0.064) (0.106)
Job sector Non-profit 0.180 -0.188* -0.163 0.135 -0.184
(0.196) (0.103) (0.162) (0.139) (0.157)
Control (over)
Sequence of tasks 0.107 0.179 0.363** 0.578*** 0.584***
(0.180) (0.138) (0.164) (0.185) (0.194)
How to do work -0.101 0.261* 0.592*** 0.294** 0.605***
(0.156) (0.155) (0.181) (0.145) (0.202)
Speed of working 0.167 0.007 -0.604*** -0.424*** -0.424*
(0.148) (0.144) (0.185) (0.102) (0.229)
Working hours 0.055 0.374*** 0.653*** 0.556*** 0.493***
(0.160) (0.122) (0.189) (0.107) (0.149)
Social support (through)
Learning from coworkers and 0.318*** 0.079 0.580*** 0.375*** 0.307**
supervisors (0.110) (0.131) (0.124) (0.095) (0.153)
Cooperating with others 0.106 -0.062 -0.035 -0.037 -0.134
(0.167) (0.108) (0.145) (0.143) (0.231)
Sharing work-related information 0.162 0.169 0.215 0.359*** 0.195
(0.184) (0.171) (0.151) (0.131) (0.168)
Constant 2.274*** 2.502*** 3.015*** 2.962*** 2.957***
(0.265) (0.301) (0.231) (0.283) (0.293)
Number of level 1 units 7051 14213 15091 14394 9501
Number of level 2 units 20 20 20 20 20
Note: Standard errors in parentheses. As controls, each trust regression contains the full list of variables from the social trust base model. Due to space limits, we do not report estimations for the between-class variance and log likelihood.
Table 7. The JDC-S Model Applied to Social Trust by Age: The Case of Caution.
VARIABLES Age groups
24 or less 25 – 34 35 – 44 45 – 54 55 plus
Job demands
Working hours -1.365*** -0.819*** -1.142*** -0.786** -0.532
(0.549) (0.362) (0.376) (0.320) (0.359)
Task complexity -0.268 0.067 0.048 0.074 0.394**
(0.174) (0.210) (0.252) (0.183) (0.168)
Job sector Private -0.236*** -0.339*** -0.339*** -0.309*** -0.362***
(0.082) (0.076) (0.077) (0.082) (0.064)
Job sector Non-profit -0.028 -0.166 -0.191 0.126 -0.115
(0.269) (0.182) (0.210) (0.196) (0.107)
Control (over)
Sequence of tasks 0.443** 0.433** 0.309 0.543** 0.644***
(0.190) (0.173) (0.209) (0.243) (0.182)
How to do work -0.311 0.342** 0.694*** 0.478** 0.525**
(0.192) (0.172) (0.184) (0.206) (0.207)
Speed of working -0.234 -0.152 -0.340 -0.443*** -0.635***
(0.236) (0.167) (0.229) (0.155) (0.171)
Working hours 0.313** 0.292 0.681*** 0.629*** 0.353**
(0.148) (0.191) (0.202) (0.135) (0.145)
Social support (through)
Learning from coworkers and 0.179 0.062 0.249** 0.133 0.455***
supervisors (0.178) (0.136) (0.125) (0.134) (0.130)
Cooperating with others 0.269 0.001 -0.043 -0.059 -0.143
(0.167) (0.116) (0.143) (0.122) (0.166)
Sharing work-related information -0.229 0.034 0.169 0.323** 0.409**
(0.159) (0.155) (0.148) (0.157) (0.190)
Constant 1.882*** 2.051*** 2.514*** 2.447*** 2.121***
(0.293) (0.341) (0.346) (0.193) (0.339)
Number of level 1 units 7051 14213 15091 14394 9501
Number of level 2 units 20 20 20 20 20
Note: Standard errors in parentheses. As controls, each trust regression contains the full list of variables from the social trust base model. Due to space limits, we do not report estimations for the between-class variance and log likelihood.
trustworthiness into caution
(1) (2) (1) (2)
Identifying variables
Intelligence level 1.194*** 1.199*** 2.229*** 2.230***
(0.049) (0.048) (0.051) (0.049)
Areas of study
General programs Ref. category Ref. category Ref. category Ref. category
Teacher training and education science 0.188*** 0.225*** 0.265*** 0.211***
(0.027) (0.024) (0.029) (0.025)
Humanities, languages and arts 0.126*** 0.171*** 0.095*** 0.120***
(0.026) (0.024) (0.028) (0.024)
Social sciences, business and law 0.087*** 0.146*** 0.116*** 0.115***
(0.019) (0.018) (0.019) (0.018)
Science, mathematics and computing 0.057** 0.077*** 0.000 -0.034
(0.025) (0.023) (0.026) (0.023)
Engineering, manufacturing and construction 0.066*** -0.010 0.000 -0.076***
(0.017) (0.017) (0.018) (0.017)
Agriculture and veterinary 0.059 0.005 0.017 0.033
(0.037) (0.036) (0.038) (0.036)
Health and welfare 0.204*** 0.290*** 0.283*** 0.343***
(0.023) (0.021) (0.025) (0.021)
Services -0.039* -0.061** -0.042* -0.120***
(0.024) (0.024) (0.024) (0.024)
Work tasks
Frequency of teaching 0.015*** 0.035*** 0.018*** 0.029***
(0.005) (0.005) (0.005) (0.005)
Frequency of making presentations 0.052*** 0.073*** 0.064*** 0.093***
(0.006) (0.005) (0.006) (0.005)
Frequency of selling -0.005 -0.006 -0.019*** -0.014***
(0.004) (0.004) (0.004) (0.004)
Frequency of advising others -0.012** -0.001 0.010** 0.022***
(0.005) (0.004) (0.005) (0.005)
Frequency of planning own activities 0.019*** 0.024*** 0.026*** 0.006
(0.005) (0.005) (0.005) (0.005)
Frequency of planning others’ activities -0.006 -0.014*** -0.014*** -0.029***
(0.004) (0.004) (0.005) (0.004)
Frequency of organizing own time -0.000 -0.004 -0.001 0.005
(0.005) (0.005) (0.005) (0.005)
Frequency of influencing others’ activities 0.013*** 0.028*** -0.001 0.000
(0.005) (0.005) (0.005) (0.005)
Frequency of negotiating with others -0.018*** -0.025*** -0.006 -0.009**
(0.005) (0.004) (0.005) (0.004)
Frequency of simple problem solving -0.014*** 0.006 -0.015*** -0.014***
(0.005) (0.005) (0.005) (0.005)
Frequency of complex problem solving 0.003 0.016*** -0.013** -0.003
(0.005) (0.005) (0.006) (0.005)
The augmented trust equation
Job demands
Working hours -0.347*** -0.075* -0.389*** -0.019
(0.040) (0.042) (0.037) (0.040)
Task complexity 0.052* -0.157*** -0.042* -0.239***
(0.027) (0.029) (0.026) (0.029)
(0.010) (0.010) (0.009) (0.009)
Job sector Non-profit -0.038 -0.048* -0.043* -0.062***
(0.027) (0.025) (0.025) (0.024)
Control (over)
Sequence of tasks 0.203*** 0.129*** 0.085*** 0.107***
(0.019) (0.021) (0.018) (0.019)
How to do work 0.014 0.004 0.016 0.063***
(0.018) (0.019) (0.017) (0.018)
Speed of working 0.051** 0.073*** 0.027 -0.008
(0.023) (0.025) (0.022) (0.024)
Working hours 0.138*** 0.059** 0.182*** 0.034
(0.026) (0.027) (0.024) (0.026)
Social support (through)
Learning from coworkers and supervisors 0.127*** 0.071** 0.175*** 0.100***
(0.027) (0.028) (0.025) (0.026)
Cooperating with others 0.131*** 0.008 0.117*** 0.003
(0.025) (0.026) (0.023) (0.024)
Sharing work-related information 0.216*** 0.062*** 0.221*** 0.057***
(0.019) (0.019) (0.018) (0.019)
Rho -0.263 -0.346 -0.309 -0.029
(0.020) (0.030) (0.015) (0.031)
Sigma 0.961 0.662 0.909 0.637
(0.003) (0.006) (0.004) (0.003)
Lambda -0.253 -0.229 -0.281 -0.018
(0.020) (0.021) (0.015) (0.020)
Note: Standard errors in parentheses. Columns (1) and (2) report results for the Heckman two-step selection model. The base trust model’s control variables are included in the trust equations. The identifying variables are
operationalized as follows: Intelligence level is measured by averaging the cognitive test results in the areas of literacy and numeracy. Each of the two constructs is calculated as a mean of the ten possible values that the PIAAC survey provides. Areas of study dummies are derived from the question asking respondents to specify to which field their study belongs. Work tasks are operationalized through questions asking how often the individual deals with certain tasks, with responses varying from 1 “never” to 5 “every day”. Column (1) reports results for the Heckman two-step selection model in which the dependent variable is rescaled to take the value of 0 when the initial trust measures take the value of zero and the value of 1 when otherwise. Column (2) reports results for the Heckman two-step selection model in which the dependent variable is rescaled to take the value of 0 when the initial trust measures take the value of zero or one and the value of 1 when otherwise.
APPENDIX B. Controlling for Limitations in the Key Variables’ Operationalization Approach.
VARIABLES JDS-C model JDS-C model with interactions
Trustworthiness Caution Trustworthiness Caution
Main factors
Job demands 0.113*** 0.149*** 0.114*** 0.113*** 0.147*** 0.147***
(0.011) (0.011) (0.010) (0.011) (0.011) (0.011)
Control 0.129*** 0.114*** 0.129*** 0.129*** 0.114*** 0.114***
(0.014) (0.014) (0.014) (0.014) (0.014) (0.014)
Social support 0.086*** 0.007 0.086*** 0.086*** 0.007 0.006
(0.017) (0.017) (0.017) (0.017) (0.017) (0.017)
Interactions
Job demands*Control -0.009 0.014
(0.013) (0.013)
Jon demands* Social support
0.007 0.026
(0.016) (0.016)
Constant -2.460*** -2.660*** -2.782*** -2.793*** -2.618*** -2.713***
(0.132) (0.148) (0.098) (0.102) (0.098) (0.180)
Log likelihood -27913.882 -26104.228 -27913.653 -27913.795 -26103.767 -26102.782
Between-class variance 0.294 0.604 0.299 0.296 0.599 0.543
(0.062) (0.141) (0.058) 0.061 (0.094) (0.172)
Number of level 1 units 60250 60250 60250 60250 60250 60250
Number of level 2 units 20 20 20 20 20 20
Note: Standard errors in parentheses. As controls, each trust regression contains the full list of variables from the trust base model. We use STATA predict option for factor analysis to create a single measure for each of the three components. This option allows capturing the commonalities in the variation of sub-measures selected for the analysis and combining them into a single construct. The single measures are believed to better reflect the rationale behind each of the job strain model facets. The values for the single measures are rescaled to vary between zero and one, with higher values reflecting less job demands, less control and more social support in the workplace.
(1) (2) (3) (1) (2) (3) Job demands
Working hours -0.447*** -0.422*** -0.830*** -0.652*** -0.614*** -1.069***
(0.102) (0.102) (0.116) (0.107) (0.107) (0.121)
Task complexity 0.286*** 0.545*** 0.423*** 0.038 0.288*** 0.119
(0.069) (0.067) (0.071) (0.073) (0.071) (0.075)
Job sector Private -0.225*** -0.225*** -0.239*** -0.299*** -0.297*** -0.314***
(0.024) (0.024) (0.025) (0.025) (0.025) (0.025)
Job sector Non-profit 0.045 0.043 0.058 0.090 0.087 0.098
(0.060) (0.060) (0.061) (0.062) (0.062) (0.064)
Control (over)
Sequence of tasks 0.121* 0.160** 0.176*** 0.152** 0.181*** 0.189***
(0.063) (0.063) (0.064) (0.066) (0.066) (0.067)
How to do work 0.182*** 0.184*** 0.167** 0.190*** 0.188*** 0.193***
(0.066) (0.065) (0.066) (0.069) (0.068) (0.069)
Speed of working -0.135** -0.207*** -0.179*** -0.114* -0.189*** -0.154**
(0.061) (0.060) (0.061) (0.063) (0.063) (0.064)
Working hours 0.191*** 0.234*** 0.203*** 0.152*** 0.189*** 0.179***
(0.047) (0.047) (0.048) (0.049) (0.048) (0.049)
Social support (through)
Learning from coworkers 0.235*** 0.145*** 0.206*** 0.031 -0.059 0.006
and supervisors (0.049) (0.048) (0.049) (0.051) (0.051) (0.051)
Cooperating with others 0.035 -0.073 -0.061 0.049 -0.053 -0.029
(0.046) (0.045) (0.046) (0.047) (0.047) (0.048)
Sharing work-related 0.130** 0.203*** 0.207*** 0.021 0.087 0.094
information (0.060) (0.059) (0.061) (0.062) (0.061) (0.062)
Additional controls
Intelligence level 1.676*** 1.590***
(0.104) (0.109)
Satisfaction with job -0.098*** -0.121***
(0.014) (0.015)
Income 0.077*** 0.089***
(0.011) (0.011)
Log likelihood -27698.420 -27805.970 -26838.680 -25949.228 -26022.880 -25114.190
Between-class variance 0.280 0.333 0.314 0.508 0.525 0.535
(0.067) (0.044) (0.049) (0.125) (0.167) (0.168)
Number of level 1 units 60250 60242 57545 60250 60242 57545
Number of level 2 units 20 20 20 20 20 20
Note: Standard errors in parentheses. As controls, each trust regression contains the full list of variables from the social trust base model. In column (1), we additionally control for the individual’s cognitive abilities measured by averaging the cognitive test results in the areas of literacy and numeracy. Each of the two constructs is calculated as a mean of the ten possible values that the PIAAC survey provides. In column (2), we additionally control for the respondent’s job satisfaction measured from 1 “extremely satisfied” to 5 “extremely dissatisfied”. In column (3), we additionally control for the respondent’s income level operationalised through the question asking individuals to specify the decimal to which their yearly income belongs.