Munich Personal RePEc Archive
Does Branch Network Size Influence
Positively the Management Performance
of Japanese Regional Banks?
Kondo, Kazumine
8 September 2017
Does Branch Network Size Influence Positively
the Management Performance of Japanese Regional Banks?
Kazumine KONDO
Faculty of Economics, Aichi Gakuin University 3-1-1 Meijo, Kita-ku, Nagoya City, Aichi, 462-8739, Japan
kondo@dpc.agu.ac.jp
Abstract
This paper investigates whether branch network expansions by Japanese regional banks influence their management performances positively at a time when management environments surrounding regional financial institutions have become increasingly severe due to the population decreases and shrinkage of regional economies. Specifically, the effects of numbers of regional bank branches on their credit businesses and profits are empirically examined. The results indicated that regional banks with more branches can increase their loans and bills discounted as well as their small and mid-sized enterprises (SME) loans and bills discounted. Thus, establishing more branches is effective in increasing the total sum of loans and bills discounted by each bank because regional banks with many branches can make contact with more customers. On the other hand, return on assets (ROA) and return on equity (ROE) of regional banks with more branches were found to be lower. Therefore, regarding the cost performance of regional banks, establishing too many branches and maintaining branch networks that are too large can have negative effects on regional banks.
Keywords: region-based relationship banking policy, regional bank, branch, loans and bills discounted, profit ratio
JEL classification: G21
1. Introduction
Due to the substantial deregulations in the Japanese financial system that have occurred since approximately the mid-1990s, the principle of competition has been introduced into the Japanese financial markets. In addition, because the market sizes have been shrinking due to the population decrease, competition among financial institutions has been becoming more intense. Under these circumstances, financial institutions are forced to take various measures to improve their own management performances. Among them, a branching strategy is seen as one of the most important options. According to the results of a questionnaire survey, both households and firms regard distance to financial institution’s branches as a very important factor when selecting a financial institutions to use1. That is, to ensure that more customers can access them easily, establishing more branches could
be one of the strongest measures a financial institution can undertake to improve their management performance.
Under these circumstances, the tendency of financial institutions to continue to follow the branching strategy has not changed, even these latter days when methods used to sell various goods and services through the internet have become widespread2. However, branching strategies taken by financial
institutions do not necessarily have positive effects on regional economies or the institutions’ own management performance. The Japanese government has been requiring regional banks to practice region-based relationship banking since 2003. Based on this policy, regional financial institutions are expected to stimulate regional economies through building long-term and close relationships with regional small- and medium-sized enterprises (SMEs) and actively engaging in fund supplies and management support for those firms. But if banks place excessive focus on attracting new customers by increasing branch numbers, the possibility that they will make light of information production on their existing customer firms and offerings of support in terms of funding and management for such firms compared to previously cannot be perfectly denied. Considering that Japan has long had an ultra-low interest rate policy, banks could have incentives to seek higher volumes of loans and bills discounted. That is, expansions of branch networks by reginal banks might render their behaviors incompatible with the purpose of region-based relationship banking policy and they could be undesirable in terms of this policy.
In addition, banks have to bear high costs to establish and run new branches. Accordingly, if the revenues that can be generated by the customers acquired by new branch establishments are not
1 “The results of the hearing and the questionnaire surveys to firms: Evaluations by borrowing firms
to financial institutions,” which was carried out by the Financial Services Agency in 2016, and “The results of the questionnaire surveys to households: The surveys of public opinions on financial behaviors of households,” which is carried out by the Central Committee for Financial Information (Kinyu Koho Chuo Iinkai) every year, have shown these tendencies.
2 Number of branches per regional bank was changing under 100 by 2009, however since 2010,
commensurate with these costs, new branch establishments might negatively impact a bank’s management3. If so, the existence of regional financial institutions that expand their branch networks
excessively could destabilize regional financial systems, which in turn could depress regional SMEs and regional economies. In fact, of the previous studies reviewed in Section 2, some concluded that the branch network sizes of financial institutions positively influence their own management performances, while others concluded that those tendencies could not necessarily be found. Thus, whether expansion of branch network sizes by financial institutions are desirable strategies for their own performance is not necessarily clear.
In the present paper, we focus on Japanese regional banks, which are expected to play an important role in stimulating regional economies under the region-based relationship banking policy, in circumstances where bank management environments have become more severe due to regional economic shrinkage in recent years. In addition, we attempt to clarify whether the strategy to increase customer numbers through the expansion of branch networks and maintaining large branch networks is desirable for regional banks. Specifically, the effects of regional bank branch numbers on their credit businesses and profits are empirically investigated.
The remainder of the present paper is organized as follows. Section 2 reviews previous studies that have analyzed the effects of financial institutions’ branch network sizes on their management performances. Section 3 explains our analytical method and data used in this study. Section 4 presents and discusses our empirical results. A summary and conclusion are provided in the final section.
2. Literature review
Previous studies that tested the effects of branch numbers and management-area extensions of financial institutions on their management performances are discussed in this section4.
Chong (1991) analyzed the effects of interstate banking on bank management performances using an event study methodology and concluded that interstate banking benefits small and medium banks in terms of increased profitability; however, this increase is associated with significantly increased exposure to market risk for medium and large banks. Zardkoohi and Kolari (1994) examined economies of scale and scope for savings banks in Finland and found that large branch banks operate more efficiently than smaller branch banks, with most cost savings obtained at around five branches.
3 Although all regional banks are stock corporations, both listed firms and unlisted firms coexist, they
are required to practice region-based relationship banking and so on by the government. Therefore, they not only have to maximize profits for stockholders but also manage a business in consideration of the public interest, which is different from the situation facing ordinary firms. Therefore, it is possible that they take public nature into consideration to some degree in branching decisions as well.
4 Rasiah (2010) surveyed previous studies that investigated the determinants of bank profitability.
Rivard and Thomas (1997) investigated performance differences between large bank holding companies operating subsidiaries in other regions and bank holding companies operating in a single region and determined that the former experienced higher profitability; in addition both volatility risk and insolvency risk were found to be lower for this group.
Seale (2004) considered the relationship between a financial institution’s branch numbers and several financial ratios, reporting that extensive branch networks are generally associated with higher non-interest income, lower non-interest and non-non-interest expenses, and higher return on equity (ROE), especially among community banks. Zou et al. (2011) examined the effects of geographical deregulation on bank performances and demonstrated that profits and net-interest-margin ratios are higher for banks with a greater number of branches. Kondo (2015) investigated whether Japanese regional banks entering the banking market in other prefectures can increase their lending-based income and concluded that management-area extensions have positive effects on their lending-based income5; however, they could not improve their overall profitability, i.e., return on assets (ROA) and
ROE6.
Incidentally, automated teller machines (ATMs) are an important delivery channel, which equals a bank branch, for financial institutions. Holden and EL-Bannany (2004) analyzed the effects of UK banks’ ATM numbers on their profitability and showed that banks that have more ATMs can raise higher ROA.
Although the above-mentioned studies demonstrated that branch numbers and management-area extensions have positive effects on bank performances in some form, other studies have concluded that such tendencies cannot necessarily be observed. Hester and Zoellner (1966) examined the effects of bank assets and liabilities on their profits using cross-section data and demonstrated that although branch numbers per assets positively influenced their profits in 1957, a significant correlation cannot be found after that year, and in 1963, the former influence negatively the latter inversely7. They
performed a pooled estimation and reported that bank branch numbers do not have significant effects on their profits in this estimation. Cyree et al. (2000) investigated the relationship between bank and bank holding company market performance and the bank’s growth choice, i.e., branching, mergers and acquisition (M&A) of other banks, and product expansion, and revealed that M&A is more effective than branching and product expansion.
Hirtle (2007) tested the effects of the bank branch network sizes on their profitability and found no systematic correlation. In addition, that paper investigated the relationship between branch network
5 Keeton (2000), Seelig and Critchfield (2003), Berger et. al (2004), and Feinberg (2008, 2009)
investigated the determinants of bank branch expansions, and all revealed that banks are more likely to enter regional markets with higher income levels.
6 The Bank of Japan also reported that the ratio of loans beyond regional banks’ home prefectures and
the ROA do not have a statistically significant correlation in the Financial System Report (April 2014).
7 They interpreted their findings as attributable to both rising bank salaries and increasing competition,
size and branch performance, showing that banks with mid-sized branch networks may be at a competitive disadvantage compared with banks that have either small- or large-sized branch networks. Hirtle and Stiroh (2007) estimated an equation that tests the effect of branch numbers per assets on bank profitability and determined that the former negatively influences the latter.
Therefore, we cannot definitively assert that banks with larger branch network sizes can expect improved performance. The present study clarifies whether having larger branch numbers improves the credit businesses and profits of Japanese regional banks.
Previous studies that tested the effects of the deregulations of bank branching on bank performances include that by Krol and Svorny (1996), who investigated the effects of branching and interstate banking regulations on state economic activities and concluded that a bank regulatory system resulting in an openly competitive banking environment tends to have a significant positive impact on a state's economy. Carow and Herson (1998) revealed that the passage of Riegle–Neal Interstate Banking and Branching Efficiency Act (IBBEA) had a positive effect on stock prices of bank holding companies. Nippani and Green (2002) analyzed the impact of IBBEA on banking industry performance by comparing pre- and post-IBBEA period bank performances. They showed that performances improved in the post-IBBEA period; however, when controlled for real GDP and prime rate, no significant effects of IBBEA were observed. Zou et al. (2011) demonstrated that the effects of the deregulation of interstate bank branching on bank performances differed according to bank size.
3. Methodology and Data 3.1 Model
First, we investigate the effects of bank branches in providing financial services.
Bank A and bank B compete with each other in a regional lending market. Each bank has ni
homogenous branchesin the same area, where subscript i refers to bank i, and the amount of loans and
bills discounted in branch j of bank i is yij. The borrowing demand function for bank i in this region is
as follows, which is expressed as the reverse demand function of lending rates pi:
, Ω , ∑ ∑ (1)
where θis the demand factor that all banks in a region commonly face; and Ωiis the demand factor
that is specific to bank i. When we assume that the amount of loans and bills discounted per branch is
fixed, the higher the number of branches, the lower the lending rate becomes. Profits of bank i are as follows:
where c(ni) is the marginal cost (average cost) when bank i lends at branch j.
Banks decide the amount of loans and bills discounted at each branch to maximize their profits. Accordingly, the following equation is obtained for each bank:
, Ω , ∑ ∑ ∑ , Ω , ∑ ∑ 0 (3)
where p3 indicates that equation (1) is differentiated by the third term. From this, the amount of loans
and bills discounted per branch in equilibrium can be obtained as follows:
, Ω , Ω , , (4)
From equation (4), total amount of loans and bills discounted of each bank is expressed as follows:
, Ω , Ω , , (5)
The effects of the forth term and the fifth term in equation (5) are measured by the Herfindahl– Hirschman index (HHI). In the present paper, the following model, which is based on equation (5), is estimated using panel data on Japanese regional banks (i.e., first- and second-tier regional banks) from 2005 to 2012:
(6)
where subscript t refers to year t; and Y indicates the financial services offered at the branches, where
specifically, loans and bills discounted, and SME loans and bills discounted of each bank are used. These are converted into a natural logarithm. Labor is the number of staff employed by each bank. It
is natural to consider that banks employing more staffs can lend much greater amounts of money. Thus, the coefficient of Labor will take positive sign. Labor is converted into a natural logarithm.
Branch is the number of branches each bank operates, and is an important variable to test the present
paper’s hypothesis. Banks that have more branches might enjoy more opportunities to come in contact with more customers, including potential customers. As a result, if this enables banks to increase their amounts of loans and bills discounted, the coefficient of Branch will be positive. Branch is converted
into a natural logarithm.
HHI is the Herfindahl–Hirschman index, which is calculated using the deposits of regional banks and
credit associations whose headquarters are located in the same prefecture as bank i’s headquarters, and
headquarters located in less-competitive markets can lend more easily in their home prefectures and this is a factor enabling them to increase the total amounts of loans and bills discounted, the coefficient of HHI will take a positive sign.
However, the data on deposits of each regional bank and each credit association used to calculate HHI
include deposits gathered outside the prefecture in which the headquarters is located. Therefore, we also use the share of the deposits for the largest regional bank relative to total deposits held by regional banks and credit associations in each prefecture (Top1share) as a proxy for degree of competition.8 If
regional banks whose Top1share are low face circumstances where competition among financial
institutions to acquire customers is more intense, and this negatively influences total amounts of loans and bills discounted, the coefficient of Top1share will be positive.
Ygrowth is the prefectural income growth rate from the previous year for the prefecture where bank i’s headquarters are located. Economic activities by firms and households in regions where Ygrowth
is rising might be vibrant and therefore, funding requirements might be relatively larger in those regions. If the market environments of the regions where the headquarters are located, whose Ygrowth
is rising, have positive effects on total amounts of loans and bills discounted, the coefficient of Ygrowth
will take a positive sign.
Popgrowth is the population growth rate from the previous year for the prefecture where bank i’s
headquarters are located. It is possible that households that are potential customers for retail loans, such as housing loans, are more numerous in the regions where the population is relatively increasing. In addition, if there are many firms in regions where population is increasing, funding requirements by firms might be also larger in those markets. If the total amounts of loans and bills discounted of regional banks whose headquarters are located in those markets tend to be larger, the coefficient of
Popgrowth will be positive.
3.2 Data
The descriptive statistics of the variables that are used in the present paper are presented in Table 1.9
Table 1 Descriptive statistics
The mean of the data for the most important variable in the present paper, which is Branch, is less
than 100. On the other hand, difference is large because the maximum value is 282 and the minimum
8 Berger and Hannan (1989) and Tokle and Tokle (2000) used a three-firm concentration ratio as a
market concentration measure. Feinberg (2002) used a two-firm concentration. However, in Japan, some prefectures have only one regional bank with a headquarters located there, and we have access to deposit data for only one regional bank in those prefectures. Therefore, to secure the samples, we used a one-firm concentration in the present study.
9 The descriptive statistics for the variables that are used in the later analysis on the effects of the
value is 16. Even among regional banks that have the same characteristics in that they are closely tied to a particular region, some regional banks build and keep large branch networks to deal with many customers, and acquire new customers, whereas others keep small branch networks to maintain close business relations with a small numbers of customers. That is, a large difference is found in branching strategies used by regional banks.
Data from the financial statements of individual banks and credit associations were obtained from
Nikkei Needs. Data absent from Nikkei Needs were supplemented by data from Analysis of Financial Statements ofAll Banks, edited by the Japanese Bankers Association, securities reports, annual reports
of each bank, and Financial Statements of All Credit Associations, edited by the Consultant of
Financial Books Co., Ltd. Data on bank branch numbers in the prefecture where each regional bank is headquartered were obtained from the FinancialMap, edited by the Japan Financial News Co., Ltd,
and the total number of branches of each regional bank were obtained from the Analysis of Financial Statements of All Banks. Prefectural data are quoted from Financial Resources of a Nation, edited by
Asahi Shimbun.
4. Estimation results
4.1 Estimation results on loans and bills discounted
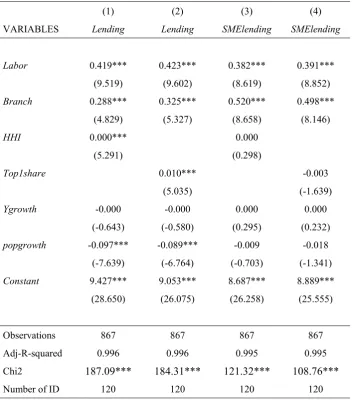
In this section, we examine the estimation results that use loans and bills discounted as well as SME loans and bills discounted as Y in equation (6). They are presented in Table 2.
Table 2 Estimation results for loans and bills discounted
According to the results of a Hausman test, selecting a fixed-effect model is supported in all estimations. Therefore, we present the estimation results of a fixed-effect model.
All of the coefficients of Labor are positive and significant at the 1% levels. This means that regional
banks that have more staff members that engage in credit businesses can lend greater amounts of money, which include SME loans and bills discounted. This is consistent with expectations.
All of the coefficients of Branch are positive and significant at the 1% levels too10. Thus, regional
banks that have large branch networks can lend greater amounts of money. From these findings, when we focus on credit businesses whose strongholds are branches, a strategy to expand branch networks has a positive effect. Accordingly, it can be said such a branching strategy is rational for regional banks that want to increase their amounts of loans and bills discounted.
10 The correlation coefficient between Labor and Branch is 0.940, which shows a strong positive
correlation between them. Therefore, we eliminated Labor and re-estimated to confirm whether the
4.2 Estimation results on returns and profits
Next, in line with some previous studies reviewed in Section 2, we examine the effects of branches on regional banks’ returns and profits. Specifically, equation (7) below is estimated11:
(7)
We use return on assets (ROA) and return on equity (ROE), which are standard profits, as dependent
variable Profit. We also use Lendingincome1, which is calculated by dividing the interest on loans and
bills discounted by total assets, and Lendingincome2, which is calculated by dividing (interest on loans
and bills discounted minus interest on deposits) by total assets, as the proxy variables of returns gained by credit businesses in Profit. In calculating both ROA and ROE, profit for the current term is used. In
addition, when calculating these variables, average balances of total assets are used. Asset is the total
assets for each bank, Capital is the capital–asset ratio for each bank, and Security is the ratio of
securities to total assets for each bank. Depositcomp is the deposit ratio, which is calculated by dividing
(deposits minus current deposits, on which banks do not have to pay interests to depositors) by total assets, and Wage is staff wages, which is calculated by dividing salary allowance by the number of
staff. Some regional banks are required to meet the Bank for International Settlement standard for capital–asset ratio, whereas others are required to meet Japan’s domestic standards. It is impossible to directly compare these capital–asset ratios because they are calculated differently. Thus, we calculate the capital–asset ratio by dividing the capital base by assets. Other variables are the same as in equation (6).
4.2.1 Estimation results on returns gained by credit businesses
In the previous section, it was demonstrated that regional banks’ branch network size positively influences their amounts of loans and bills discounted. In this section, we test whether the branch network sizes of regional banks also have positive effects on returns gained by credit businesses. The estimation results using Lendingincome1 and Lendingincome2 as Profit in equation (7) are presented
in Table 3.
Table 3 Estimation results for returns gained by credit businesses
11 We re-estimated equation (6) using Asset instead of Labor to confirm the results do not change even
According to the results of a Hausman test, selecting a fixed-effect model is supported in all estimations. Therefore, we present the estimation results of a fixed-effect model.
All coefficients of Security are negative and significant at the 1% level. This suggests that regional
banks who actively invest securities do not tend to also focus on credit businesses, and as a result, their returns on credit businesses are lower.
All of the coefficients of Wage are positive and significant at the 1% level. Many staff may be highly
skilled in acquiring new customers, undertaking credit investigations, monitoring, and offer management support to customers in regional banks that offer higher wages, and those banks could therefore be able to raise higher returns on credit businesses. The possibility also exists that staffs that are paid higher wages have higher motivation, and as a result, returns obtained by credit businesses are higher.
All coefficients of Branch are positive and significant at the 1% level. Thus, strategies to expand
branch network sizes do serve to increase returns on credit businesses and profit margins on interest rates. When also considering the tendency that amounts of loans and bills discounted, including those of SMEs, for regional banks with larger branch networks are higher, as found in the previous section, it can be considered that regional banks increase their branches in order to increase lending opportunities and returns on credit businesses.
4.2.2 Estimation results on ROA and ROE
In this section, we run the estimation for ROA and ROE, which are ordinary profit indexes, as Profit
in equation (7). Estimation results are presented in Table 4.
Table 4 Estimation results for ROA and ROE
According to the results of a Hausman test, selecting a fixed-effect model is supported in all estimations. Therefore, we present the estimation results of a fixed-effect model.
In all estimations, the coefficients of Capital are positive and significant at the 1% level. Banks with
a sound financial position are not likely to take large risks in asset management. Accordingly, loan loss provisions and costs to dispose of the losses of assets, such as nonperforming loans, of these banks, are smaller. are smaller. As a result, they can earn higher profits12. In addition, because the funding
costs of financially sound banks are generally lower, this could also contribute to high profits. Thus, it can be said that keeping financial soundness at a high level without taking excessive risks directly
12 We re-estimate using nonperforming loan ratio of each bank instead of Capital. As a result, the
garners high profits for regional banks.
In two cases among the estimation results of ROA, the coefficients of Security are positive and
significant at the 10% level. In Japan, a regional bank that invests less than 45% of assets in securities is the top one in terms of the ratio of securities, and banks that actively invest in securities can raise higher profits as evaluated by ROA. Incidentally, we also estimate using the ratio of stocks to total
assets instead of Security and found the coefficients of stock ratio are negative and significant at the
5% level in three estimation results. Thus, although regional banks that actively invest in bonds and so on among securities can raise higher ROA, regional banks that invest in stocks whose risks are
excessively higher cannot necessarily raise expected results.
The coefficients of Ygrowth are positive and significant at the 5% or 10% level in two estimations,
and the coefficients of Popgrowth are positive and significant at the 5% or 10% level in three
estimations. The needs for various financial services might be larger in regions experiencing higher income and population growth, and regional banks with headquarters located in those regions could find it easier to boost profits.
The coefficients of Branch are negative and significant at the 1% or 5% level in the all estimations.
From the perspective of overall profitability for all regional banks, the negative effects, e.g., from paying high costs, are stronger than the positive effects, e.g., that banks can raise higher returns, in the strategies requiring a bank to establish many branches. In addition, as the number of branches increases, the amount of loans and bills discounted increases whereas lending rates could be lower, which was demonstrated in Section 3.1. Thus, the returns gained by increasing branches do not necessarily correspond to the costs of such expansion. The above analysis revealed that branches can act to increase the amounts of loans and bills discounted and returns raised by credit businesses. However, according to the cost performances of regional banks, strategies to expand branch networks excessively could have negative effects on regional banks.
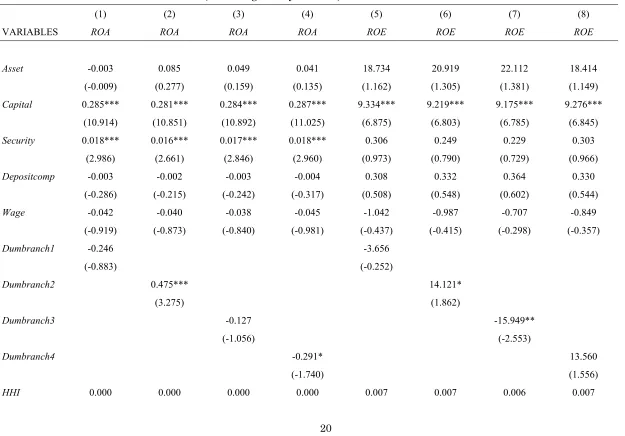
Then, what number of branches is the most effective to increase profits earned by regional banks? We ran the estimate using the following dummy variables: Dumbranch1 equals one when a bank has 49
branches or fewer, Dumbranch2 equals one when a bank has from 50 to 99 branches, Dumbranch3
equals one when a bank has from 100 to 149 branches, and Dumbranch4 equals one when a bank has
150 branches or more. Estimation results are presented in Table 5.
Table 5 Estimation results for ROA and ROE (cases using dummy variables)
According to the results of a Hausman test, selecting a fixed-effect model is supported in all estimations. Therefore, we present the estimation results of a fixed-effect model.
The coefficients of Dumbranch2 are positive and significant at the 1% level in estimations using ROA,
coefficients of Dumbranch4 are negative and significant at the 10% level in estimations using ROA,
and the coefficients of Dumbranch3 are negative and significant at the 5% level in estimations using ROE. These findings reveal a possibility that having 50–99 branches is the most desirable rather than
expanding branch network size blindly to achieve increased overall profitability, which might be the desire for many regional banks.
5. Conclusion
Management environments surrounding Japanese regional financial institutions, which are supporters of regional economies, have become much stricter due to population decreases and ultra-low interest rate policies in recent years. Under these circumstances, some regional financial institutions have expanded their branch networks more than others in a drive to acquire new customers. But if the relationship between regional financial institutions and their existing customers weaken due to those behaviors, branch network expansion is not desirable in terms of the policy view, and such steps could negatively influence regional economies. In addition, it is not clear that the positive effects of branch network expansions correspond to the costs required to establish new branches as well as those incurred by running and maintaining existing large branch networks. Therefore, in the present paper, the effects of Japanese regional banks’ branch network size on their management performances were empirically tested to consider what branch strategies regional banks should consider in strict revenue environments.
First, we investigated the effects of branches in terms of providing financial services and found that regional banks with more branches have increased their amounts of loans and bills discounted as well as of SME loans and bills discounted. Thus, a strategy to establish many branches can serve to increase each bank’s total of loans and bills discounted because regional banks with many branches can come into contact with more customers.
Next, we examined the effects of branches on the returns obtained by credit businesses and demonstrated that regional banks with larger branch networks can raise those returns. Taking into consideration the tendency that regional banks with a higher number of branches also have higher amounts of loans and bills discounted and those of SME loans and bills discounted, which was found in the previous analysis, it can be considered that regional banks seeking to increase the sum of loans and bills discounted and the returns obtained by credit business could seek to establish new branches and build large branch networks for this purpose.
branches and maintain large branch networks, are stronger than the positive effects, namely that regional banks can receive higher returns by expanding their branch network. In addition, because increases in branch numbers (or keeping an extensive branch network) could bring lower lending rates, it is possible that the returns obtained by increasing branch numbers do not necessarily correspond to the costs incurred. Thus, judging from the aspect of cost performance, expanding branch networks and maintaining large branch networks could negatively impact regional banks. It was also demonstrated that the most desirable branch number in terms of allowing regional banks to boost their profits might be 50–99.
Judging from these findings, in recent years as the sizes of regional markets are shrinking, regional banks should carefully consider whether establishing new branches will positively influence their performance, instead of increasing branches blindly to increase their number of new borrowing customers. This caveat should also be applied to restructuring of branches for regional banks supporting overly large branch networks. Banks trying to win new customers and support existing customer firms in terms of funding supply and management within branch networks built on sufficient considerations will bring desirable effects to both their own profits as well as regional economies. Investigating the effects of branch network expansion by regional financial institutions, including regional banks, on regional SMEs, and regional economic performances is left for a future work. In the present paper, we clarified the effects of branch network expansions by focusing on regional banks. However, these branching strategies could negatively influence regional SMEs and regional economies, as mentioned before.13 The necessity of analyses focusing on regional SMEs and regional
economies is increasing wherein the differences among regions in various aspects along with shrinking regional market sizes widen and various policies, such as the region-based relationship banking policy, are undertaken to overcome population decline and revitalize local economies in Japan.
References
Berger AN, Hannan TH (1989) The price-concentration relationship in banking. The Review of Economics and Statistics 71:291–299
Berger AN, Bonime SD, Goldberg LG, White LJ (2004) The dynamics of market entry: the effects of mergers and acquisitions on entry in the banking industry. Journal of Business 77:797–834 Carow KA, Herson RA (1998) The interstate banking and branching efficiency act of 1994: a wealth
13 This problem might become stricter because banks can have incentives to establish branches by
event for acquisition targets. Journal of Banking and Finance 22:175–196
Chong BS (1991) The effects of interstate banking on commercial banks’ risk and profitability. The Review of Economics and Statistics 73:78–84
Cohen A, Mazzeo MJ (2010) Investment strategies and market structure: an empirical analysis of bank branching decisions. Journal of Financial Services Research 38:1–21
Cyree KB, Wansley JW, Black HA (2000) Bank growth choices and changes in market performance. The Financial Review 35:49–66
Dick AA (2007) Market size, services quality, and competition in banking. Journal of Money, Credit and Banking 39:49–81
Feinberg RM (2002) Credit unions: fringe suppliers or cournot competitors? Review of Industrial Organization 20:105–113
Feinberg RM (2008) explaining the credit union entry decision, and implications for performance. Review of Industrial Organization 33:81–91
Feinberg RM (2009) Patterns and determinants of entry in rural country banking markets. Journal of Industry, Competition and Trade 9:101–115
Hester DD, Zoellner JF (1966) The relation between bank portfolios and earnings: an econometric analysis. The Review of Economics and Statistics 48:372–386
Hirtle B (2007) The impact of network size on bank branch performance. Journal of Banking and Finance 31:3782–3805
Hirtle B, Stiroh KJ (2007) The return to retail and the performance of U.S. banks. Journal of Banking and Finance 31:1101–1133
Holden K, El-Bannany M (2004) Investment in information technology systems and other determinants of bank profitability in the UK. Applied Financial Economics 14:361–365 Keeton WR (2000) Are mergers responsible for the surge in new bank charters? Federal Reserve Bank
of Kansas City Economic Review 85:21–41
Kondo K, Harimaya K (2014) Why do Japanese non-local regional banks enter other prefectures under the region-based relationship banking policy? Journal of Industry, Competition and Trade 14:473–485
Kondo K (2015) Cross-prefecture expansion of regional banks in Japan and its effects on lending-based income. Cogent Economics & Finance 3:1–11
Krol R, Svorny S (1996) The effect of the bank regulatory environment on state economic activity. Regional Science and Urban Economics 26:531–541
Nippani S, Green KW (2002) The banking industry after the Riegle–Neal Act: re-structure and overall performance. The Quarterly Review of Economics and Finance 42:901–909
Rivard RJ, Thomas CR (1997) The effect of interstate banking on large bank holding company profitability and risk. Journal of Economics and Business 49:61–76
Seale G (2004) Branching continues to thrive as the U.S. banking system consolidates. Federal Deposit Insurance Corporation FYI October 10:1–13
Seelig S, Critchfield T (2003) Merger activity as a determinants of de novo entry into urban banking markets. FDIC Working Paper 2003–01:1–23
Tokle RJ, Tokle JG (2000) The influence of credit union and savings and loan competition on bank deposit rates in Idaho and Montana. Review of Industrial Organization 17:427–439
Zardkoohi A, Kolari J (1994) Branch office economies of scale and scope: evidence from savings banks in Finland. Journal of Banking and Finance 18:421–432
Table 1 Descriptive statistics
Variable Obs Mean Std. Dev. Min Max
Lending 867 1779589 1506629 142696 9017178 SMElending 867 1338517 1123719 128390 7329676 ROA 839 0.107 0.518 -4.567 6.077
ROE 839 0.183 24.014 -500.882 36.966
Lendingincome1 839 1.466 0.342 0.765 2.701 Lendingincome2 839 1.306 0.315 0.634 2.368 Lendingincome3 839 32616.410 15365.150 10965.710 129519.400 Lendingincome4 839 28900.910 12875.510 10240.000 91591.430 Labor 867 1636.149 944.191 229 4637 Branch 867 98.912 42.936 16 282
Asset 839 2664777 2228019 183391 12600000 Capital 839 4.741 1.349 -5.999 8.840 Security 839 24.241 7.055 8.791 44.250 Depositcomp 839 86.862 4.214 71.856 94.965 Wage 839 6.846 0.989 4.026 11.957
HHI 839 3689.092 1523.536 569.687 7178.022
Table 2 Estimation results for loans and bills discounted
(1) (2) (3) (4)
VARIABLES Lending Lending SMElending SMElending
Labor 0.419*** 0.423*** 0.382*** 0.391***
(9.519) (9.602) (8.619) (8.852)
Branch 0.288*** 0.325*** 0.520*** 0.498***
(4.829) (5.327) (8.658) (8.146)
HHI 0.000*** 0.000
(5.291) (0.298)
Top1share 0.010*** -0.003
(5.035) (-1.639)
Ygrowth -0.000 -0.000 0.000 0.000
(-0.643) (-0.580) (0.295) (0.232)
popgrowth -0.097*** -0.089*** -0.009 -0.018
(-7.639) (-6.764) (-0.703) (-1.341)
Constant 9.427*** 9.053*** 8.687*** 8.889***
(28.650) (26.075) (26.258) (25.555)
Observations 867 867 867 867
Adj-R-squared 0.996 0.996 0.995 0.995
Chi2 187.09*** 184.31*** 121.32*** 108.76***
Number of ID 120 120 120 120
Table 3 Estimation results for returns gained by credit businesses
(1) (2) (3) (4)
VARIABLES lendingincome1 lendingincome1 lendingincome2 lendingincome2
Asset -0.837*** -0.792*** -1.017*** -0.978***
(-13.215) (-12.246) (-15.287) (-14.348)
Capital -0.012** -0.011** 0.010* 0.011**
(-2.341) (-2.212) (1.915) (2.009)
Security -0.022*** -0.022*** -0.016*** -0.016***
(-17.640) (-17.512) (-12.551) (-12.524)
Depositcomp -0.001 -0.001 -0.014*** -0.014***
(-0.466) (-0.397) (-5.963) (-5.785)
Wage 0.070*** 0.068*** 0.027*** 0.025***
(7.715) (7.504) (2.870) (2.652)
Branch 0.608*** 0.561*** 1.005*** 0.973***
(6.556) (5.912) (10.320) (9.732)
HHI 0.000 0.000**
(1.066) (2.183)
Top1share -0.006* -0.001
(-1.679) (-0.421)
Ygrowth -0.003*** -0.003*** 0.002*** 0.002**
(-3.657) (-3.844) (2.681) (2.552)
Popgrowth 0.113*** 0.101*** 0.155*** 0.145***
(5.241) (4.552) (6.815) (6.220)
Constant 10.967*** 10.867*** 12.733*** 12.556***
(11.265) (11.208) (12.464) (12.287)
Observations 839 839 839 839
Adj-R-squared 0.939 0.939 0.921 0.920
Chi2 89.39*** 90.97*** 143.05*** 140.41***
Number of ID 116 116 116 116
Table 4 Estimation results for ROA and ROE
(1) (2) (3) (4)
VARIABLES ROA ROA ROE ROE
Asset 0.411 0.405 31.371* 24.304
(1.298) (1.252) (1.888) (1.436)
Capital 0.286*** 0.286*** 9.368*** 9.259***
(11.122) (11.104) (6.939) (6.869)
Security 0.011* 0.010* 0.087 0.019
(1.793) (1.684) (0.271) (0.059)
Depositcomp -0.000 0.001 0.412 0.474
(-0.002) (0.093) (0.681) (0.789)
Wage -0.040 -0.041 -0.999 -0.779
(-0.889) (-0.907) (-0.422) (-0.329)
Branch -2.036*** -1.999*** -64.567*** -54.696**
(-4.393) (-4.214) (-2.654) (-2.203)
HHI 0.000 0.006
(1.010) (0.936)
Top1share 0.013 1.861**
(0.782) (2.106)
Ygrowth 0.005 0.006 0.323* 0.356**
(1.570) (1.610) (1.798) (1.976)
Popgrowth 0.271** 0.276** 8.747 11.026*
(2.502) (2.496) (1.541) (1.906)
Constant 1.592 1.259 -257.784 -269.675
(0.327) (0.260) (-1.010) (-1.062)
Observations 839 839 839 839
Adj-R-squared 0.336 0.335 0.150 0.154
Chi2 100.74*** 100.71*** 27.2*** 31.07***
Number of ID 116 116 116 116
Table 5 Estimation results for ROA and ROE (cases using dummy variables)
(1) (2) (3) (4) (5) (6) (7) (8)
VARIABLES ROA ROA ROA ROA ROE ROE ROE ROE
Asset -0.003 0.085 0.049 0.041 18.734 20.919 22.112 18.414
(-0.009) (0.277) (0.159) (0.135) (1.162) (1.305) (1.381) (1.149)
Capital 0.285*** 0.281*** 0.284*** 0.287*** 9.334*** 9.219*** 9.175*** 9.276***
(10.914) (10.851) (10.892) (11.025) (6.875) (6.803) (6.785) (6.845)
Security 0.018*** 0.016*** 0.017*** 0.018*** 0.306 0.249 0.229 0.303
(2.986) (2.661) (2.846) (2.960) (0.973) (0.790) (0.729) (0.966)
Depositcomp -0.003 -0.002 -0.003 -0.004 0.308 0.332 0.364 0.330
(-0.286) (-0.215) (-0.242) (-0.317) (0.508) (0.548) (0.602) (0.544)
Wage -0.042 -0.040 -0.038 -0.045 -1.042 -0.987 -0.707 -0.849
(-0.919) (-0.873) (-0.840) (-0.981) (-0.437) (-0.415) (-0.298) (-0.357)
Dumbranch1 -0.246 -3.656
(-0.883) (-0.252)
Dumbranch2 0.475*** 14.121*
(3.275) (1.862)
Dumbranch3 -0.127 -15.949**
(-1.056) (-2.553)
Dumbranch4 -0.291* 13.560
(-1.740) (1.556)
(1.482) (1.311) (1.393) (1.504) (1.222) (1.127) (1.054) (1.185)
Ygrowth 0.006* 0.006* 0.006* 0.006* 0.338* 0.338* 0.343* 0.342*
(1.686) (1.704) (1.699) (1.666) (1.872) (1.880) (1.910) (1.896)
Popgrowth 0.205* 0.211* 0.206* 0.216** 6.721 6.851 6.570 6.366
(1.890) (1.956) (1.901) (1.993) (1.188) (1.215) (1.167) (1.127)
Constant -1.624 -3.069 -2.372 -2.219 -367.236 -403.601 -411.941 -366.773
(-0.333) (-0.636) (-0.488) (-0.458) (-1.446) (-1.598) (-1.635) (-1.454)
Observations 839 839 839 839 839 839 839 839
Adj-R-squared 0.318 0.328 0.319 0.321 0.141 0.145 0.149 0.144
Chi2 84.09*** 92.52*** 84.25*** 85.16*** 19.81** 22.99*** 26.26*** 22.11***
Number of ID 116 116 116 116 116 116 116 116
t-statistics in parentheses