Driving ROVER with Segment-based ASR Quality Estimation
Shahab Jalalvand(1,2), Matteo Negri(1), Daniele Falavigna(1), Marco Turchi(1) (1)FBK - Fondazione Bruno Kessler, Via Sommarive 18, 38123 Trento, Italy
(2) University of Trento, Italy
{jalalvand,negri,falavi,turchi}@fbk.eu
Abstract
ROVER is a widely used method to combine the output of multiple auto-matic speech recognition (ASR) systems. Though effective, the basic approach and its variants suffer from potential draw-backs:i)their results depend on the order in which the hypotheses are used to feed the combination process,ii)when applied to combine long hypotheses, they disre-gard possible differences in transcription quality at local level,iii)they often rely on word confidence information. We address these issues by proposing a segment-based ROVER in which hypothesis ranking is obtained from a confidence-independent ASR quality estimation method. Our re-sults on English data from the IWSLT2012 and IWSLT2013 evaluation campaigns significantly outperform standard ROVER and approximate two strong oracles. 1 Introduction
In automatic speech recognition (ASR), the com-bination of transcription hypotheses produced by multiple systems usually leads to significant word error rate (WER) reductions compared to the out-put of each individual system. Systems’ diversity and complementarity have been exploited in dif-ferent ways to synthetically obtain more accurate transcriptions. Recognizer output voting error re-duction – ROVER (Fiscus, 1997), the most widely used method, performs hypothesis fusion in two steps. First, the 1-best transcriptions from multi-ple systems are aligned by means of dynamic pro-gramming to build a single, minimal word tran-sition network. Then, the resulting network is searched to select the best scoring word at each node. The final hypothesis is constructed via a ma-jority voting mechanism and, if available, by using word confidence measures.
This general strategy has been improved in sev-eral ways but, despite their proven effectiveness, ROVER and its variants have three potential draw-backs. The first one is intrinsic to their implemen-tation: the fusion process starts from one of the input hypotheses, which is used as “skeleton” for the greedy alignment of the others. The order in which the hypotheses are used to feed the process can hence determine significant variations in the WER of the resulting combination.This calls for automatic methods forrankingthe hypotheses to initialise and carry on the fusion process.
The second drawback is inherent to the way ROVER is usually run: the fusion process is typi-cally fed with transcriptions of entire audio record-ings (lasting up to hours). With this level of granu-larity, the skeleton used as basis for the alignment may consist of long transcriptions whose quality can considerably vary at local level. For instance, the worst transcription of an entire audio recording (globally) could be the best one for some passages (locally). This calls for solutions capable to op-erate at higher granularity levels (e.g. segments lasting up to few seconds) to better exploit the local diversity of the combined transcriptions.
The third drawback relates to the applicability of ROVER-like fusion methods: their common trait is the reliance on information about the in-ner workings of the combined systems. Indeed, the standard voting scheme with confidence scores is usually much more reliable than the simpler frequency-based voting. The access to confidence scores, however, is a too rigid constraint in ap-plication scenarios where the hypotheses to be combined come from unknown (“black-box”) sys-tems.1 This calls forconfidence-independent
fu-sion methods.
1One example, among the many possible ones, is the
sce-nario in which an array of microphones (e.g. in a room or a vehicle) sends input to one or more commercial ASR systems which do not provide confidence information.
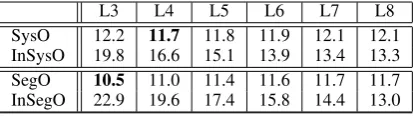
L3 L4 L5 L6 L7 L8 SysO 12.2 11.7 11.8 11.9 12.1 12.1 InSysO 19.8 16.6 15.1 13.9 13.4 13.3 SegO 10.5 11.0 11.4 11.6 11.7 11.7 InSegO 22.9 19.6 17.4 15.8 14.4 13.0
Table 1: Motivation: the influence of hypothesis order and granularity on standard ROVER results.
The impact of the first two issues is evident from the figures provided in Table 1. The results refer to the WER achieved by different “oracles” obtained from the output of eight ASR systems that partici-pated in the IWSLT2013 campaign (Cettolo et al., 2013).2 Such oracles combine:
• Different numbers of transcriptions (from
three– L3 toeight– L8);
• At different granularity levels (whole utter-ance– SysO andsegment– SegO);
• In different orders (best to worst – SysO, SegO andinverse– InSysO, InSegO). As shown in the table, the gap between utterance-based (SysO) and segment-based (SegO) is evident at all levels: WER differences vary from 0.3 (11.9 vs. 11.6 at L6) to 1.7 points (12.2 vs. 10.5 at L3). Another gap is evident between best-to-worst and inverse rankings, with WER differences up to 7.6 points at whole utterance level (SysO vs. InSysO at L3) and 12.4 points at segment level (SegO vs. InSegO at L3). Another interesting observation is that top results (i.e. lower WER) are obtained when combining a subset of the outputs (respectively four at utterance level and three at segment level). Referring to this analysis, the goal of computing ROVER based on hypothesis ranking at higher granularity levels is well motivated.
A crucial need to achieve this goal is the avail-ability of a confidence-independent method to pre-dict the quality of ASR transcriptions at segment level. This “quality estimation” (QE) task has been recently addressed in (Negri et al., 2014; C. de Souza et al., 2015) as a supervised regres-sion problem in which transcriptions’ WER is pre-dicted without having access to reference tran-scripts.3 Different feature sets have been evalu-ated, showing that even with those extracted only
2Details about this dataset will be provided in Section 6.1. 3This formulation is very similar to the machine
transla-tion counterpart of the task (Specia et al., 2009; Mehdad et al., 2012; Turchi et al., 2014; C. de Souza et al., 2014).
from the signal and the transcription (i.e. disre-garding information about the decoding process) the prediction error is sufficiently low to open to real applications. However, though promising, ex-perimental results stem from an intrinsic evalua-tion in which QE is only addressed in isolaevalua-tion.
By applying it to inform ROVER, we pro-pose for the first time an application-oriented
ex-trinsic evaluation of ASR QE (our first
contri-bution). To this aim, we extend previous ASR QE methods with new features (second contribu-tion), and report significant improvements over standard ROVER on a shared dataset (third con-tribution). For the sake of brevity, our compar-ison is performed only against standard ROVER and in “black-box” conditions. However it’s worth remarking that our approach can be straightfor-wardly applied to any ROVER-like variant and, if available, by exploiting confidence features.
2 Related work
This paper gathers three main research strands to-gether: ASR system combination, ASR quality es-timation and machine-learned ranking.
Fiscus (1997) proposed ROVER as an approach to produce a composite ASR output. The basic ap-proach has been extended in several ways. N-Best ROVER (Stolcke et al., 2000) improves the orig-inal method by combining multiple alternatives from each combined system. Schwenk and Gau-vain (2000) exploit a secondary language model to rescore the final n-best hypotheses generated by ROVER.iROVER (Hillard et al., 2007) exploits a classifier to choose the system that is most likely to be correct at each word location.cROVER (Abida et al., 2011) integrates a semantic pre-filtering step in which the word transition network is scanned to flag and eliminate erroneous words to facilitate the voting. Other approaches to ASR system combi-nation make use of word lattices or confusion net-works (Mangu, 2000; Li et al., 2002; Evermann and Woodland, 2000; Hoffmeister et al., 2006; Bougares et al., 2013, inter alia). Note that all these combination methods require to have access to the inner structure of the ASR decoder, while ASR systems, especially the commercial ones, of-ten do not provide this information.
(Negri et al., 2014; C. de Souza et al., 2015), here we extend the approach with new features and per-form an extrinsic evaluation in a real application scenario. Our new features are inspired by re-search on ASR error detection at word level (Gold-water et al., 2010; Pellegrini and Trancoso, 2010). Machine-learned ranking (MLR) or learning to rank (Hang, 2011) is widely used in information retrieval to order the answers to a user’s query (Cao et al., 2007; McFee and Lanckriet, 2010; McSherry and Najork, 2008). We use it to order the transcription hypotheses produced by multiple ASR systems and feed ROVER with the resulting ranked lists.
3 Method
Given an utterance and a set of M transcription hypotheses produced byMdifferent (possibly un-known) ASR systems, our goal is to:
1. Split the utterance into segments (ideally at sentence level);
2. For each segment, automatically estimate the quality (e.g. in terms of WER) of the corre-spondingM(segment-level) hypotheses; 3. Use the estimates to rank the hypotheses and
feed ROVER based on the ranking;
4. Reconstruct the entire utterance transcrip-tion by concatenating the combined segment-level transcriptions produced by ROVER;
5. Measure the overall WER differences against standard ROVER and other oracles.
Step 1 is performed by a start-end point detection module based on signal energy, which is followed by a segment classification module based on Gaus-sian Mixture Models similar to (Cettolo and Fed-erico, 2000). Although the comparison with al-ternative splitting methods might lead to different results, this is not the main focus of the paper and is left as future work. Steps 2–4, instead, repre-sent the core of our contribution and are described in the following sections.
4 Segment-based QE-informed ROVER ROVER uses iterative dynamic programming to build a word transition network (WTN) from mul-tiple ASR output hypotheses. The resulting WTN can be seen as a confusion network with an equal
number of word arc hypotheses (one for each ASR system entering the combination) in each corre-spondence slot. The best word sequence is deter-mined from the WTN via majority voting among the words in each slot. Most of the extensions of ROVER, such as iROVER (Hillard et al., 2007),
cROVER (Abida et al., 2011) and the one de-scribed in (Zhang and Rudnicky, 2006), aim to learn a scoring function that allows improving the reordering of words inside each slot. In particu-lar, iROVER reorders the words in each slot by means of a classifier trained with features that characterize the individual ASR systems. This ap-proach, however, needs first to properly normal-ize the word lattices generated by each system, in order to exhibit the same vocabulary and similar densities, and to generate a unified segmentation for joining the lattices.
In a similar way, motivated by the analysis shown in Table 1, our method applies reordering of the ASR hypotheses atsegment level. However, differently from iROVER, it does not require to access the inner components of the decoders (e.g.
word lattices or word confidences), nor to apply pre-processing steps that can distort the outputs of individual ASR components.
this is my mobile A mobile phone can change ………Thank you
………
concat(SRV)
T1A T
2A TnA
T1B T
2B TnB
T1C T2C TnC
SRV(T1A, T1B, T1C) SRV(T2A, T2C, T2B) SRV(TnB, TnA, TnC)
RV(T
1.
.n
A,
T1.
.n
B,
T1.
.n
[image:3.595.308.522.432.562.2]C)
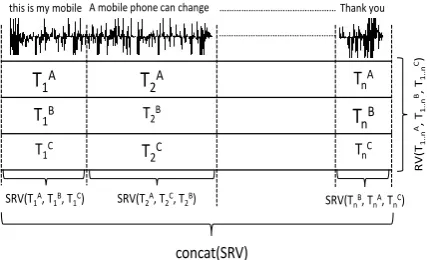
Figure 1: Segment-based ROVER
Figure 1 illustrates the difference between stan-dard ROVER (RV, shown at the rightmost verti-cal) which works at the utterance level (lasting up to few hours) and the segment-based ROVER (SRV, shown at the bottom horizontal) that works at the segment level (lasting up to few seconds).
RV keeps the order of the systems static along the whole utterance (A B C, i.e. system
A has generated a better transcription than sys-temB which, in turn is better than systemC) for all the segmentsRV(TA
one segment to the other. For example, the system order for the first segment isA B C, while for the next segment it isA C B. Our hy-pothesis is that, with a proper segment-based rank-ing, SRV will result in lower WER scores than RV. Note that, as depicted in Figure 1, segment-based ROVER requires that all the ASR systems share a common segmentation. This is easy to ob-tain by force-aligning the transcriptions of each system with a given segmentation (e.g. one ran-domly chosen among those employed by each ASR system).
In this paper we approach segment-level ASR QE as a supervised learning task, by comparing two alternative strategies: ranking by regression (Section 4.1) and machine-learned ranking (Sec-tion 4.2). Both methods rely on the features used in (Negri et al., 2014), extended with a new set of word-level features described in Section 5.
4.1 Ranking by regression (RR)
The first ranking strategy is based on training a re-gressor on a set of (signal, transcription, WER) triples, and use it to predict the WER score for new, unseen (signal,transcription) test instances. Then, based on the predicted WERs, a ranked list is produced for each segment to feed ROVER.
To train the regressor, we are given N seg-ments (Si,1 ≤i≤N), their automatic transcrip-tions ({T1
i . . . TiM}ii==1N) produced byMASR sys-tems, and manual references from which the true WERs ({T W1
i . . . T WiM}ii==1N) can be computed for each segment i. The whole set of train-ing data is hence represented by instances: I =
{(Si, Tij, T Wij),1 ≤ j ≤ M,1 ≤ i ≤ N }. Training is performed with two alternative strate-gies, which differ in the amount of training data used. The first one,RR1, employs the whole train-ing set I. The second one, RR2, uses only one transcription for each segment, randomly chosen from theMavailable. In this case, the training set becomes: I0 ={(S
i, Tij, T Wij),1 ≤i≤ N, j =
rnd(M)}wherernd(M)is a random number be-tween 1 to M. In practice, RR2 learns from a smaller but more diverse training set compared to
RR1. On the one side, in fact, RR1 deals with a larger number of training instances (M times more), but the feature vectors will share the same values for the features extracted from the signal of each utterance. On the other side,RR2reduces the size of the training setI0down to 1
M ofI, but only
one feature vector is extracted for each utterance. The unpredictable effect of such differences on QE results motivates experiments with both methods.
4.2 Machine-learned ranking (MLR)
The second strategy relies on directly training a ranking model from a set of instances I =
{(Si, Tij, T Rji),1≤i≤N,1≤j ≤M }, where
Si and Tij respectively represent segments and transcriptions, and T Rji represents “true ranks” computed from the corresponding reference WER valuesT Wij. That is, given two transcriptions,Tij
andTk
i and the true WERs, thenT Rji T Rik, if
T Wij ≤T Wk i .
It is worth to note that MLR, differently from the two regression methods described above, per-forms a pairwise comparison between the ment candidates. That is, for each pair of seg-ment transcriptions, the algorithm processes their corresponding feature vectors against each other and decides to place one transcription ahead of the other, as long as returning a score for this decision. Based on this score, the algorithm is then able to rank more than two candidates.
5 Features
We use two sets of features. One consists of the basic features described in (Negri et al., 2014); the other includes several word-based features specif-ically introduced for our ranking task.
5.1 Basic features
Basic features can be further divided in three groups:
Signal features (16 in total) aim to capture the difficulty to transcribe a given input by looking at the signal as a whole. They are obtained by analyzing the audio waveform with a window of 20ms at a frame rate of 10ms. For each analysed window, 12 Mel Frequency Cepstral Coefficients (MFCCs) are evaluated (MFCC of order 0 is dis-carded) plus log energy. Then, to form the signal feature vector for each given segment, we com-pute the mean/min/max values of raw energy, as well as the mean MFCCs values and total segment duration.
Hybrid features (26) provide a more
the forced alignment between theM given auto-matic transcriptions of each segment and the cor-responding acoustic observations obtained from raw features. For each transcription hypothesis hybrid features are: signal to noise ratio (SNR), mean/min/max noise energy, mean/min/max word energy, (max word - min noise) energy, number of silences (#sil), #sil per second, number of words (#wrd) per second, ##wrdsil , total duration of words (Dwrd), total duration of silences (Dsil), mean du-ration of words, mean dudu-ration of silences, Dsil
Dwrd, Dwrd−Dsil, standard deviation (std) of word du-ration, std of silence dudu-ration, mean/std/min/max of pitch4, number of hesitations, frequency of hes-itations.
Textual features (10) aim to capture the plausi-bility (i.e.the fluency) of a transcription. For each hypothesis textual features are: number of words, LM log probability, LM log probability of part of speech (POS), log perplexity, LM log perplexity of POS, percentage (%) of numbers, % of tokens which do not contain only “[a-z]”, % of content words, % of nouns, % of verbs.
5.2 Word-based features
To compensate the absence of ASR confidence in-formation, we also designed a set of “word-based” features inspired by previous approaches to ASR error detection (Chieu and Ng, 2002; Pellegrini and Trancoso, 2010; Goldwater et al., 2010; Tam et al., 2014). They aim to capture words’ pronun-ciation difficulty, which is determined by the num-ber of lexical neighbors (similar pronunciations) and the types of phonemes that form the words. From the ASR error detection field we also borrow additional language model features based on re-current neural network language model (RNNLM) probability (Mikolov et al., 2010).
Word-based features (22) are: POS tag and
score of the previous/current/next words (6), RNNLM probabilities (2) given by models trained on domain and out-of-domain data, in-domain/out-of-domain 4-gram LM probability (2), number of phoneme classes (including fricatives, liquids, nasals, stops and vowels) (5), number of homophones (1), number of lexical neighbors (1) and binary features answering the three questions: “is stop word?” (1), “is before/after repetition?”
4Pitch features have been computed with the Praat
soft-ware tool (Boersma and Weenink, 2005).
[image:5.595.315.516.62.98.2]Dataset duration sent token voc talks tst2012 1h45m 1,124 19.2k 2.8k 11 tst2013 4h50m 2,246 41.6k 5.6k 28
Table 2: Dataset statistics: duration, number of sentences, number of tokens, vocabulary size, number of talks.
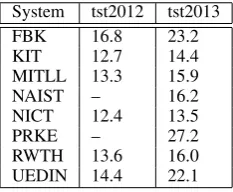
System tst2012 tst2013
FBK 16.8 23.2
KIT 12.7 14.4
MITLL 13.3 15.9
NAIST – 16.2
NICT 12.4 13.5
PRKE – 27.2
RWTH 13.6 16.0 UEDIN 14.4 22.1
Table 3: Official WER[%] scores of the partic-ipants in the IWSLT2012 and IWSLT2013 ASR evaluations.
(2), “is before/after silence?” (2). Since the ASR hypotheses of a given segment might contain dif-ferent numbers of words, we average the values of the word-based features for each hypothesis.
6 Experimental setup
In this section we illustrate the audio data used in our experiments, the methods used to inform and run ROVER, the evaluation metric and the signifi-cance testing method applied.
6.1 Data
We experiment with two sets of speech recordings collected from English TED talks and used for the 2012 (IWSLT2012) and 2013 (IWSLT2013) editions of the International Workshop on Spo-ken Language Translation (Federico et al., 2012; Cettolo et al., 2013). Statistics for both datasets are shown in Table 2. Six teams participated in the 2012 evaluation: FBK, KIT, MITLL, NICT, RWTH and UEDIN. Two more competi-tors, NAIST and PRKE, took part in the 2013 edi-tion of the campaign. The related WERs are re-ported in Table 3. For detailed system descrip-tions we refer the reader to the IWSLT20125 and IWSLT20136proceedings.
In the experiments, we used tst2012 for train-ing with 4-fold cross-validation, and tst2013 for testing purposes. Note that cross-validation was applied ensuring that a given speaker does not
[image:5.595.357.474.158.254.2]pear simultaneously both in the training and vali-dation sets. The same condition holds for the test set: speakers in tst2012 do not occur intst2013. These conditions, and the use of two different sets of talks (acquired in different IWSLT editions and transcribed by different sets of ASR systems), make our task particularly difficult and guarantee the congruence with real-life scenarios in which training and test data are totally independent.
As previously mentioned, a common segmenta-tion needs to be shared among the various ASR components. To do this we decided to use the one provided by our internal ASR system, and to force-align to it all the other ones.
6.2 Terms of comparison
We compare our segment-based QE-informed ROVER against three methods that differ in the granularity of the combined hypotheses and in the way they are ranked:
Random ROVER. It is obtained by averaging
the results of 100 runs of standard, system-level ROVER (i.e. the WTN is obtained by com-bining transcriptions of the whole utterance) in which the systems to be combined are ranked ran-domly. Note that this is the only possible way to run ROVER in absence of information about the reliability of the combined systems. Random ROVER is the standard fusion method adopted in IWSLT2013 to produce the final transcriptions that are sent to the machine translation phase.
System-based Oracle (SysO). It is obtained by computing the standard, system-level ROVER based on the true system ranking (i.e. the actual ranking of the IWSLT2013 participants). We con-sider it as an oracle since the true ranking repre-sents prior knowledge about systems’ reliability which is not available in real testing conditions.
Segment-based Oracle (SegO). It is obtained by computing ROVER at segment-level, using the true system ranking for each segment. Also this oracle relies on information about systems’ rank-ing (at a higher granularity level), which is not available in real testing conditions. As shown in Table 1, this is the strongest term of comparison and actually represents out upper bound.
6.3 Evaluation metric and significance test
As usually done in ASR evaluation, performance results are measured in terms of WER.7 Our segment-based, QE-informed ROVER is hence compared against the other methods based on the WER computed on the test set (tst2013).
To measure if two methods produce statistically different results, we run the matched-pairs signif-icance test (Gillick and Cox, 1989). It is based on averaging the differences between the number of errors (insertions, deletions and substitutions) produced by the two approaches for the individual segments. If the average falls in the [-0.05,+0.05] interval, then the global WER difference between the two methods is not statistically significant.
In terms of results’ significance tests, our suc-cess criteria are: i) a statistically significant im-provement over random ROVER, and ii) non-significant differences with respect to the two strong oracles. For the sake of comparison, we define three symbols for the evaluation results re-ported in Table 4:
1. “†” indicates that the corresponding WER score is not significantly different from ran-dom ROVER (a negative result);
2. “•” indicates that the WER score is not sig-nificantly different from the system-based ROVER oracle (a positive result);
3. “?” indicates that the WER score is not sig-nificantly different from the segment-based ROVER oracle (the best result).
6.4 Ranking Models
Ranking by regression (see Section 4.1) is per-formed using the implementation of the extremely randomized trees algorithm (Geurts et al., 2006) provided by the Scikit-learn package (Pedregosa et al., 2011). Extra-trees are a tree-based ensemble method for supervised classification and regres-sion, which we successfully used in the past both for MT (de Souza et al., 2013) and ASR quality estimation (Negri et al., 2014). The model used for machine learned ranking (see Section 4.2) is based on the implementation of the random forest
7The word error rate is the minimum edit distance
method-number of combined systems L3 L4 L5 L6 L7 L8
Random ROVER 14.6 13.7 13.2 12.8 12.7 12.4
SegO 10.5 11.0 11.4 11.6 11.7 11.7
SysO 12.2 11.7 11.8 11.9 12.1 12.1
RR1 +Basic 13.9 13.1 12.6 12.4 12.4 12.3† •
RR1 +WordBased 14.0 13.0 12.5 12.2 12.3• 12.3† •
RR1 +Basic+WordBased 14.0 13.0 12.5 12.2 12.3• 12.3† •
RR2 +Basic 13.8 13.0 12.6 12.4 12.3• 12.3† •
RR2 +WordBased 14.2 13.1 12.7 12.4 12.5† 12.4† •
RR2 +Basic+WordBased 13.7 12.8 12.4 12.2 12.2• 12.2† •
MLR +Basic 12.9 12.4 12.3 12.1• 12.3 12.2† •
[image:7.595.84.512.61.246.2]MLR +WordBased 12.4• 12.1 12.0 12.0• 12.2• 12.2† • MLR +Basic+WordBased 12.4• 12.1 12.0• 11.9•? 12.2• 12.2† •
Table 4: WER[%] (↓) of random, oracle and QE-informed ROVERs. The symbols assigned to some scores indicate their statistical significance (p≤0.05computed with the matched-pairs test). In particu-lar: “†” = the result is not statistically different from random ROVER; “•” = the result is not statistically different from SysO; “?” the result is not statistically different from SegO.
ensemble method (Breiman, 2001) provided in the RankLib library.8
As mentioned in Section 6.1, all the ranking models are trained in 4-fold cross validation.RR1
uses all the instances in tst2012 (i.e. 1,124 seg-ments transcribed by 6 ASR systems, which re-sults in a total of 6,744 training instances). RR2
uses only one instance per segment, which is ran-domly selected among the 6 automatic transcrip-tions available in tst2012 (resulting in a total of 1,124 training instances). Similar to RR1, MLR
uses all the instances in tst2012 (6,744 in total). The learning parameters of each model (number of bags, number of trees per bag, number of leaves per tree and minimum number of instances per leaf) are tuned by maximising Mean Average Pre-cision as the objective function (Hang, 2011).
All the models are trained using the ba-sic features (+Basic), the word-based ones
(+WordBased) and their combination (
+Ba-sic+WordBased).
7 Results and discussion
Table 4 reports the WER results obtained on
tst2013 by ROVER methods fed with: different
numbers of hypotheses (from 3 to 8), at different granularity levels (whole utterance vs. segment), ranked with different models (random, RR1, RR2 and MLR) trained with different sets of features
8http://sourceforge.net/p/lemur/wiki/
RankLib/
(Basic, WordBased, Basic+WordBased).
The first three rows present the results achieved by our terms of comparison: random ROVER, the segment-based oracle (SegO) and the system-based oracle (SysO). As anticipated when moti-vating our work (see Table 1), the WER achieved by SegO is always lower than the scores achieved by SysO. Note also that the performance of SegO decreases as the number of combined hypotheses increases, due to the introduction in the input of progressively worse transcripts. Instead, SysO ex-hibits a less coherent behaviour, with close WER values at all levels, and a minimum in correspon-dence of column L4 (the combination of four transcriptions of the whole utterance). We inter-pret these results as a further motivation for our work: feeding ROVER with a good ranking that exploits local (segment-level) differences between the combined hypotheses seems to be more reli-able than relying on system-level ranks based on global WER scores. A theoretical analysis of the relation between the diversity of the combined hy-potheses and ROVER results is presented in (Au-dhkhasi et al., 2014). In light of this analysis, our results open an interesting issue concerning the trade-offs between optimal hypothesis ranking and their (local) diversity. We initially explore this problem in Section 7.1, but leave for future work a more systematic investigation.
Rows 4-6 show the results achieved by RR1
tran-scriptions for each input segment). When trained only with basic features, it always outperforms random ROVER. At L8 the gain is not statisti-cally significant but, at the same time, also the WER difference with SysO is not significant. Note that, proceeding from L3 to L8, the WER differ-ence between RR1+Basic and random ROVER de-creases from 0.7 to 0.1. This can be explained by the fact that when the number of candidates in-creases, then the role of majority voting dominates the role of hypothesis ranking. Similar trends are shown by all other approaches, including the or-acles. RR1+WordBased slightly improves over RR1+Basic, indicating the possible usefulness of this new set of features. However, when used in combination (RR1+Basic+WordBased), the two feature sets do not yield further WER reductions. Nevertheless, what is worth to remark is that at L7 and L8 the distance from Sys0 is not statistically significant (a positive result).
As shown in rows 7-9, the situation changes withRR2(ranking by regression, trained with one transcription per segment). When trained with the combined feature sets (RR2+Basic+WordBased), the model always leads to slight WER reductions over RR2+Basic. Also in this case, the gains over random ROVER are consistent (they range from 0.9 at L3 to 0.2 at L8), and the difference with re-spect to SysO is not statistically significant at L7 and L8 (a positive result).
As shown in rows 10-12, results are further im-proved byMLR. Except for L8, the improvement over random ROVER is statistically significant, large and consistent with all feature sets. The WER reduction obtained by MLR+Basic varies from 1.7 to 0.2 WER points, indicating a higher ef-fectiveness of machine-learned ranking compared to ranking by regression. MLR+WordBased pro-duces further WER reductions, with differences with SysO that become statistically not-significant at four levels (L3, L6, L7 and L8). Finally, when trained with the combined feature sets, the ranking model leads to the lowest WER scores. Notice-ably, such results are not only on par with SysO (the difference is statistically significant only at L4), but in one case (L6) they even reach those of SegO, the strongest competitor (best result).
Overall, as evidenced by the L8 column, when the number of input components becomes large our QE-informed approaches are not significantly better than random ROVER and SysO. This raises
the need of a stopping criterion to avoid entering useless inputs into the ROVER combination. To-gether with the trade-off between ranking perfor-mance and hypotheses’ diversity, this represents an interesting topic for future work.
7.1 The role of hypotheses’ diversity
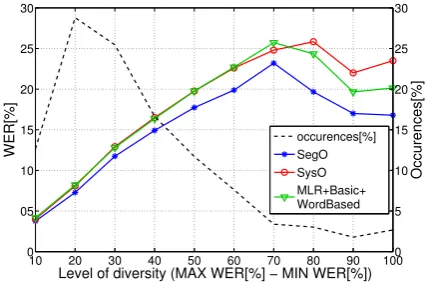
To gain further insights on our results, and as a first step along the research directions previ-ously outlined, we analysed the relation between ROVER results and hypotheses’ diversity. To this aim, Figure 2 plots the WER of our best method (MLR+Basic+WordBased) and the two oracles as a function of hypotheses’ diversity at L6, for which we obtain the best results.
10 20 30 40 50 60 70 80 90 100 0
05 10 15 20 25 30
Level of diversity (MAX WER[%] − MIN WER[%])
WER[%]
0 5 10 15 20 25 30
Occurences[%]
[image:8.595.311.525.284.425.2]occurences[%] SegO SysO MLR+Basic+ WordBased
Figure 2: Results ontst2013of the oracles and our best model, as functions of hypotheses’ diversity.
Diversity is measured by computing the difference between the maximum and the minimum WERs of the input transcriptions. All the segments are then grouped with regard to this difference. For example 10 on the x-axis refers to the group of segments whose diversities lay in the interval of [0,10); 20 refers to the segments whose diversities are in [10,20) and consequently, 100 represents the segments whose diversities lay in [90,100]. This latter means that for each segment there is at least one transcription that is perfect or close to perfec-tion, and one that is (almost completely) wrong.
with asterisk marks). Remarkably, for diversity values in the interval [90,100], our method is able to halve the distance that separates the two oracles. The considerable WER reductions observed for diversity values larger than 70 shed new light on the global results reported in Table 4. The fact that such performance gains are hidden in the global scores can be explained by looking at the dashed line in Figure 2, which shows the percentage of segments belonging to each diversity level. As it can be observed, the vast majority of the seg-ments (∼95%) falls in diversity bins in the inter-val [10,70). The large WER reductions obtained on the few remaining segments are definitely not enough to boost global results. Overall, this find-ing suggests that our segment-level QE-informed ROVER can fully unfold its potential in applica-tion scenarios featuring high diversity among the transcriptions.
7.2 Prediction of overall ranks
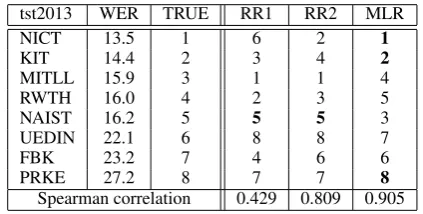
Since our results strongly depend on the reliabil-ity of hypothesis ranking, our final analysis fo-cuses on the correlation between QE-based rank-ing methods and the “true” ranks used as prior knowledge by the system-based oracle (the official ranking of the IWSLT2013 participants). In order to predict the overall IWSLT2013 ranking, we first run our QE models on each segment. Systems are then ordered based on the average ranking score received by their transcriptions. Finally, the alter-native QE-based methods (RR1, RR2 and MLR) are compared by measuring their Spearman corre-lation with the TRUE systems’ order.
Table 5 reports the resulting rankings and the corresponding correlation with the true, official one. Among all the possible combinations (8 fac-torial), our two best methods (RR2 and MLR) re-sult in a systems’ ordering with high correlation with the official IWSLT2013 ranking. In particu-lar, MLR achieves correlation of 0.905 with three out of eight systems (1, 2 and 8) that are correctly positioned. The correlation values of the differ-ent approaches reflect the performance reported in Table 4, in which the WER achieved by us-ing MLR is usually better than the ones obtained from RR1 and RR2. It is interesting to note in the last column of Table 5 that the ranking errors are represented by switches between systems with similar WERs, while it seems easier to discrimi-nate between systems with more distant WER
val-ues. This consideration is in line with the findings of Section 7.1 concerning the higher potential of segment-level QE-informed ROVER in scenarios featuring a higher diversity between the combined systems.
tst2013 WER TRUE RR1 RR2 MLR
NICT 13.5 1 6 2 1
KIT 14.4 2 3 4 2
MITLL 15.9 3 1 1 4
RWTH 16.0 4 2 3 5
NAIST 16.2 5 5 5 3
UEDIN 22.1 6 8 8 7
FBK 23.2 7 4 6 6
PRKE 27.2 8 7 7 8
[image:9.595.310.522.141.248.2]Spearman correlation 0.429 0.809 0.905
Table 5: True and predicted IWSLT2013 system ranks (correct predictions are shown in bold).
8 Conclusions
References
Kacem Abida, Fakhri Karray, and Wafa Abida. 2011. cROVER: Improving ROVER using Automatic Er-ror Detection. In Proceedings of the IEEE Inter-national Conference on Acoustics, Speech, and Sig-nal Processing, (ICASSP 2011), pages 1753–1756, Prague, Czech Republic, May.
Kartik Audhkhasi, Andreas M Zavou, Panayiotis G Georgiou, and Shrikanth S Narayanan. 2014. The-oretical analysis of diversity in an ensemble of au-tomatic speech recognition systems. IEEE/ACM Transactions on Audio, Speech & Language Pro-cessing, 22(3):711–726.
Paul Boersma and David Weenink. 2005. Praat: Doing Phonetics by Computer (Version 4.3.01). Retrieved from http://www.praat.org/.
Fethi Bougares, Del´eglise, Est`eve Paul, Yannick, and Mickael Rouvier. 2013. LIUM ASR System for Etape French Evaluation Campaign: Experiments on System Combination using Open-source Recog-nizers. In Proceedings of the 16th International Conference on Text, Speech, and Dialogue, pages 319–326, Pilsen, Czech Republic, September. Leo Breiman. 2001. Random forests. Machine
learn-ing, 45(1):5–32.
Jos´e G. C. de Souza, Marco Turchi, and Matteo Ne-gri. 2014. Machine Translation Quality Estimation Across Domains. InProceedings of the 25th Inter-national Conference on Computational Linguistics (COLING 2014): Technical Papers, pages 409–420, Dublin, Ireland, August.
Jos´e G. C. de Souza, Hamed Zamani, Matteo Negri, Marco Turchi, and Daniele Falavigna. 2015. Mul-titask Learning for Adaptive Quality Estimation of Automatically Transcribed Utterances. In Proceed-ings of the 2015 Conference of the North American Chapter of the Association for Computational Lin-guistics - Human Language Technologies (NAACL HLT 2015), Denver, Colorado, USA.
Zhe Cao, Tao Qin, Tie-Yan Liu, Ming-Feng Tsai, and Hang Li. 2007. Learning to Rank: from Pairwise Approach to Listwise Approach. In Proceedings of the 24th International Conference on Machine learning (ICML-07), pages 129–136, Corvalis, Ore-gon, USA.
Mauro Cettolo and Marcello Federico. 2000. Model Selection Criteria for Acoustic Segmentation. In
ASR2000-Automatic Speech Recognition: Chal-lenges for the new Millenium ISCA Tutorial and Re-search Workshop (ITRW).
Mauro Cettolo, Jan Niehues, Sebastian St¨uker, Luisa Bentivogli, and Marcello Federico. 2013. Report on the 10th IWSLT Evaluation Campaign. In Proceed-ings of the International Workshop on Spoken Lan-guage Translation (IWSLT 2013), Heidelberg, Ger-many, December.
Hai Leong Chieu and Hwee Tou Ng. 2002. Named Entity Recognition: A Maximum Entropy Approach Using Global Information. In Proceedings of the 19th International Conference on Computational Linguistics - Volume 1, COLING ’02, pages 1–7, Taipei, Taiwan.
Jos´e G. C. de Souza, Christian Buck, Marco Turchi, and Matteo Negri. 2013. FBK-UEdin participation to the WMT13 quality estimation shared task. In
Proceedings of the Eighth Workshop on Statistical Machine Translation, pages 352–358, Sofia, Bul-garia, August. Association for Computational Lin-guistics.
Gunnar Evermann and PC Woodland. 2000. Pos-terior Probability Decoding, Confidence Estimation and System Combination. InProceedings of NIST Speech Transcription Workshop, volume 27, College Park, MD, USA.
Marcello Federico, Luisa Bentivogli, Michael Paul, and Sebastian St¨uker. 2012. Overview of the IWSLT 2012 Evaluation Campaign. In Proceed-ings of the International Workshop on Spoken Lan-guage Translation (IWSLT 2012), pages 11–27, Hong Kong, December.
Jonathan G Fiscus. 1997. A Post-processing Sys-tem to Yield Reduced Word Error Rates: Recog-nizer Output Voting Error Reduction (ROVER). In
Proceedings of the IEEE Workshop on Automatic Speech Recognition and Understanding, pages 347– 354, Santa Barbara, CA, USA. IEEE.
Pierre Geurts, Damien Ernst, and Louis Wehenkel. 2006. Extremely randomized trees. Machine learn-ing, 63(1):3–42.
Laurence Gillick and Stephen J Cox. 1989. Some Sta-tistical Issues in the Comparison of Speech Recog-nition Algorithms. InProceedings of the IEEE In-ternational Conference on Acoustics, Speech, and Signal Processing, (ICASSP 1989), pages 532–535, Glasgow, Scotland.
Sharon Goldwater, Dan Jurafsky, and Christopher D Manning. 2010. Which words are hard to rec-ognize? prosodic, lexical, and disfluency factors that increase speech recognition error rates. Speech Communication, 52(3):181–200.
LI Hang. 2011. A short introduction to learning to rank. IEICE TRANSACTIONS on Information and Systems, 94(10):1854–1862.
Bj¨orn Hoffmeister, Tobias Klein, Ralf Schl¨uter, and Hermann Ney. 2006. Frame Based System Com-bination and a Comparison with Weighted ROVER and CNC. In Proceedings of the International Conference on Spoken Language Processing (Inter-speech 2006 — ICSLP), pages 537–540, Pittsburgh, PA, USA.
Xiang Li, Rita Singh, and Richard M. Stern. 2002. Lattice Combination for Improved Speech Recogni-tion. InProceedings of the International Conference of Spoken Language Processing, Denver, CO, USA, September.
Lidia Mangu. 2000. Finding Consensus in Speech Recognition. John Hopkins University. PhD The-sis.
Brian McFee and Gert R Lanckriet. 2010. Metric Learning to Rank. InProceedings of the 27th Inter-national Conference on Machine Learning (ICML-10), pages 775–782, Haifa, Israel, June.
Frank McSherry and Marc Najork. 2008. Comput-ing information retrieval performance measures ef-ficiently in the presence of tied scores. InAdvances in information retrieval, pages 414–421. Springer. Yashar Mehdad, Matteo Negri, and Marcello
Fed-erico. 2012. Match without a Referee: Evaluating MT Adequacy without Reference Translations. In
Proceedings of the Machine Translation Workshop (WMT2012), pages 171–180, June.
Tomas Mikolov, Martin Karafi´at, Lukas Burget, Jan Cernock`y, and Sanjeev Khudanpur. 2010. Recur-rent Neural Network Based Language Model. In
Proceedings of INTERSPEECH 2010, 11th Annual Conference of the International Speech Communi-cation Association, pages 1045–1048, Makuhari, Chiba, Japan, September.
Matteo Negri, Marco Turchi, Jos´e G. C. de Souza, and Falavigna Daniele. 2014. Quality Estimation for Automatic Speech Recognition. InProceedings of COLING 2014, the 25th International Confer-ence on Computational Linguistics: Technical Pa-pers, pages 1813–1823, Dublin, Ireland, August. Fabian Pedregosa, Ga¨el Varoquaux, Alexandre
Gram-fort, Vincent Michel, Bertrand Thirion, Olivier Grisel, Mathieu Blondel, Peter Prettenhofer, Ron Weiss, Vincent Dubourg, et al. 2011. Scikit-learn: Machine learning in python. The Journal of Ma-chine Learning Research, 12:2825–2830.
Thomas Pellegrini and Isabel Trancoso. 2010. Im-proving ASR Error Detection with Non-decoder Based Features. InProceedings of INTERSPEECH 2010, 11th Annual Conference of the International Speech Communication Association, pages 1950– 1953, Makuhari, Chiba, Japan, September.
Holger Schwenk and Jean-Luc Gauvain. 2000. Im-proved ROVER using Language Model Information.
In ASR2000-Automatic Speech Recognition: Chal-lenges for the new Millenium ISCA Tutorial and Re-search Workshop (ITRW).
Lucia Specia, Nicola Cancedda, Marc Dymetman, Marco Turchi, and Nello Cristianini. 2009. Es-timating the Sentence-Level Quality of Machine Translation Systems. In Proceedings of the 13th Annual Conference of the European Association for Machine Translation (EAMT’09), pages 28–35, Barcelona, Spain.
Andreas Stolcke, Harry Bratt, John Butzberger, Ho-racio Franco, Venkata Ramana Gadde, Madelaine Plauche, Colleen Richey, Elizabeth Shriberg, Kemal Sonmez, F Weng, and Jing Zheng. 2000. The SRI march 2000 HUB5 conversational speech transcrip-tion system.
Yik-Cheung Tam, Yun Lei, Jing Zheng, and Wen Wang. 2014. ASR Error Detection using Recur-rent Neural Network Language Model and Comple-mentary ASR. InProceedings of the IEEE Interna-tional Conference on Acoustics, Speech, and Signal Processing, (ICASSP 2014), pages 2312–2316, Flo-rence, Italy, May.
Marco Turchi, Antonios Anastasopoulos, Jos´e G. C. de Souza, and Matteo Negri. 2014. Adaptive Qual-ity Estimation for Machine Translation. In Proceed-ings of the 52nd Annual Meeting of the Association for Computational Linguistics (Volume 1: Long Pa-pers), pages 710–720, Baltimore, Maryland, June. Rong Zhang and Alexander I. Rudnicky. 2006.
![Table 4: WER[%] (↓scores indicate their statistical significance () of random, oracle and QE-informed ROVERs](https://thumb-us.123doks.com/thumbv2/123dok_us/197407.518700/7.595.84.512.61.246/table-scores-indicate-statistical-signicance-random-informed-rovers.webp)