1149
A Framework for Representing Language Acquisition in a Population
Setting
Jordan Kodner University of Pennsylvania Department of Linguistics, Dept. of Computer and Info. Science
Christopher M. Cerezo Falco University of Pennsylvania
Department. of Electrical and Systems Engineering [email protected]
Abstract
Language variation and change are driven both by individuals’ internal cognitive pro-cesses and by the social structures through which language propagates. A wide range of computational frameworks have been proposed to connect these drivers. We compare the strengths and weaknesses of existing approaches and propose a new analytic framework which combines pre-vious network models’ ability to capture realistic social structure with practically and more elegant computational proper-ties. The framework privileges the pro-cess of language acquisition and embeds learners in a social network but is mod-ular so that population structure can be combined with different acquisition mod-els. We demonstrate two applications for the framework: a test of practical concerns that arise when modeling acquisition in a population setting and an application of the framework to recent work on phono-logical mergers in progress.
1 Introduction
The process of language change should be thought of as a two-step cycle in which 1) individuals acquire their native languages from their prede-cessors then 2) pass them on to their sucprede-cessors. Small changes accrue over time this way and cre-ate both small-scale interpersonal variation and large-scale typological differences. It is easy to draw a strong analogy here between linguistic evo-lution and biological evoevo-lution. Both feature clas-sic descent with modification, except while phe-notypes are transmitted through genes and acted on by natural selection, language is both trans-mitted through and constrained by the individual
(Cavalli-Sforza and Feldman, 1981; Ritt, 2004, etc.).
But while evolution, linguistic or otherwise, is driven by forces acting on the individual, it un-folds on the level of populations (Cavalli-Sforza and Feldman,1981). The influence of community-level social factors on the path of language change is a major focus of sociolinguistics (Labov,2001; Milroy and Milroy,1985;Rogers Everett,1995). Ideally, one could observe population-level vari-ation unfold in real time while testing out indi-vidual factors, but this is impossible because no-body can travel back in time or fit entire natu-ral environments into a lab. Change that has al-ready happened is out of reach, and change in progress is buried in a world of confounds. The classic sociolinguistic method instead approaches the problem by inferring causal factors from pat-terns discovered in field interviews and corpora (Labov, 1994; Labov et al., 2005, etc.). This is the primary source of empirical data in the field and the only way to look at language change in a naturalistic setting, but it is limited in that it can-not test cause and effect directly. More recently, controlled experimental studies have emerged as a complementary line of research which manipu-late causal factors directly (Johnson et al., 1999; Campbell-Kibler, 2009, etc.), but are inherently removed natural time and scale. A third approach, the one we build upon here, relies on computa-tional modeling to simulate how sociolinguistic factors might work together in larger populations (Klein,1966;Blythe and Croft, 2012;Kauhanen, 2016, etc.).
etc.), leading to the strong conclusion that change is the inevitable consequence of mixed linguis-tic input or finite learning periods (Niyogi and Berwick, 1996), even if children are “perfect” learners. An important result connecting the learner and population emphasizes the need for this line of work: the space of paths of change available in populations is formally larger than the paths available to linear chains of iterated learn-ers. Niyogi and Berwick (2009) prove formally that evenperfectly-mixed(i.e., uniform and homo-geneous social network) populations admit phase transitions in the path of change unavailable to chains of single learners commonly implemented in iterated learning (Kirby et al.,2000). This sug-gests that small-population experimental studies in sociolinguistics and in child language acquisition do not paint the full picture of language change.
We introduce a new framework for modeling language change in populations. It has an outer loop to represent generational progression, but it replaces the inner loop which calculates random-ized interactions between agents with a single for-mula that is defined generally enough to allow the simulation of a wide range of scenarios. It builds upon the principled formalism described by Niyogi and Berwick(1996, et seq.), privileging the acquisition model and separating it from the pop-ulation model. The resulting modular framework is described in the following sections. First, Sec-tion 1.1 presents a survey of previous simulation work followed by a description of the new popula-tion model in Secpopula-tion2. Next, Section3addresses practical concerns relating population size to as-sumptions about language acquisition. Finally, Section4introduces a case study on phonological change which demonstrates the need for appropri-ate models both of acquisition and populations.
1.1 Related Work
Computational models for the propagation of lin-guistic variation have been employed with a vari-ety of research goals in mind. Every paper imple-ments its own framework with few exceptions, so comparison across studies is difficult. Addition-ally, since each model is essentially ‘boutique,’ it is always possible that models are designed con-sciously or unconcon-sciously to achieve a specific outcome rather driven by underlying principles. We group these frameworks into three classes ac-cording to their implementation,swarm,network,
and algebraic, and discusses their strengths and weaknesses.
The first class, called swarm here, models populations as collections of agents placed on a grid. They “swarm” around randomly accord-ing to some movement function, and “interact” when they occupy adjacent grid spaces ( Satter-field,2001;Harrison et al.,2002;Ke et al.,2008; Stanford and Kenny, 2013). This tends toward concrete interpretation, for example, more mobile populations are expressed directly by more mo-bile agents. They capture Bloomfield (1933)’s “principle of density” which describes the obser-vation that geographically or socially close indi-viduals interact more frequently than those far-ther away. On the ofar-ther hand, they provide little control over network structure, relying on series of explicit movement constraints in order to di-rect their agents, and since each one moves ran-domly at each iteration, these models have poten-tially thousands of degrees of freedom. Such sim-ulations should be run many times if any sort of statistically expected results are to be computed.
The second class, network frameworks, model speakers as nodes and interaction probabilities as weighted edges on network graphs (Minett and Wang, 2008; Baxter et al., 2009; Fagyal et al., 2010;Blythe and Croft, 2012;Kauhanen, 2016). These frameworks offer precise control over social network structure and can test specific community models from within sociolinguistics. However, implementations usually proceed by some kind of iterative probabilistic node-pair selection pro-cess, and in this way suffer from the same statis-tical pitfalls as swarm frameworks. In contrast to swarm models, interaction is rigidly restricted to immediately connected nodes, so to achieve gra-dient interaction probabilities, edges must be fre-quently updated or nearly fully-connected graphs with carefully assigned edge weights would need to be constructed and motivated.
up calculation as well, making larger simulations more tractable than with network or swarm frame-works. But this power is achieved by sacrificing the social network. Up to this point, such models have, to our knowledge, only been defined over perfectly-mixed (i.e., no network effects) popu-lations. That assumption is useful for reasoning about the mathematical theory behind language change, but it hinders such models’ utility in em-pirical studies. For example, thoughBaxter et al. (2006) andMinett and Wang(2008) implement al-gebraic models for perfectly mixed populations, they fall back on network models to model net-work effects.
2 Framework for Transmission in Social Networks
Algebraic frameworks have their mathematical advantage, but network frameworks provide a richer model for representing real-world popula-tion structures and swarm models capture density effects by default. An ideal framework would combine the benefits of all three of these. Here we do just that. We introduce a framework that instan-tiates Niyogi and Berwick (1996)’s acquisition-driven formalism where change is handled explic-itly as a two-step alternation between individual learners learning and populations interacting. It provides an analytic solution to the state of a net-work structure over which swarm-like behavior can be modeled.
We begin by conceptualizing the framework in terms of agents traveling probabilistically over a network structure as in Algo. 1 before introduc-ing the analytic solution. There is an individual standing at every node in the graph, and at every iteration, each individual begins at some location and travels along the network’s edges, at each step deciding to continue on or to stop and interact with the agent at that node. Any two agents with a non-zero weight path between them could potentially interact, so the overall probability of an interaction is a function of the shape of the network and the decay rate of the step probability. The shorter and higher weighted the path between two agents, the more likely they are to interact. This corresponds to the gradient interaction probabilities of swarm frameworks.
Algorithm 1:One iteration of the propagation model conceptualized on the level of an indi-vidual agent
foreach individual nodedo
Begin traveling;
whiletravelingdo
Randomly select an outgoing edge by weight and follow it OR stop travel; increase chance of stopping next time;
end
Interact with the individual at the current node;
end
2.1 Representing the Network
Social networks are typically conceived of as graph structures with individuals as vertices and the social or geographical connections between individuals as edges, and this allows for a great deal of flexibility. If edges are undirected, then all interactions are equal and bidirectional, but if edges are directed, interactions may or may not be. Edges can be weighted to represent likelihood of interaction or some measure of social valuation, and this too can vary over time. Lastly, it is possi-ble to add and remove nodes themselves to capture births, deaths, or migration.
The network structure is represented computa-tionally here as an adjacency matrixA. In a pop-ulation ofnindividuals, this isn×nwhere each elementaij is the weight of the connection from
individual j to individual i. The matrix must be column stochastic (all columns sum to 1 and con-tain only positive elements) so that edge weights can be interpreted as probabilities. The special case where the matrix is symmetric (everyaij =
aji) models undirected edges, and more strongly,
the model reduces to perfectly-mixed populations when eachaij = 1n.
We define a notion of communities over the nodes of the network in order to add the option to categorize groups of individuals. Membership amongccommunities is identified with ann×c
2.2 Propagation in the Network
In a typical network model, the edge weights be-tween nodes inAare interpreted directly as inter-action probabilities, meaning that individuals only ever interact with their immediate graph neigh-bors. We take a different approach by allowing the agents to “travel” and potentially interact with any other agent whose node is connected by a path of non-zero edges. If the number of traveling steps were fixed atk, the probability of each pair inter-acting would be defined asAk. It is more compli-cated for us since the number of steps traveled is a random variable. The probability ofjinteracting with i(p(ij)) is the probability of them interact-ing afterksteps times the probability ofkfor all values ofkas in Eqn. 1. Combining this intuition withA yields the interaction probabilities for all
i, jpairs.
p(ij) =X
k
p(ij|ksteps)p(ksteps) (1)
The pattern of linguistic variants or grammars (in the formal sense where grammargis the inten-sional equivalent of languageLg) within a network
unfolds as a dynamical system over the course of many iterations, and learners’ positions within the network mediate which ones they eventually ac-quire. In a system with g grammars and n indi-viduals, a n ×g row-stochastic matrix G spec-ifies the probability with which each community expresses each grammar. Given this notion of in-teraction and the specification of grammars ex-pressed within a network, it is possible to compute the distribution of grammars presented to each learner. This is the learners’ linguistic environ-ment and is represented by a matrixEin the same form asG>.
An environment function En(Gt,A) = Et+1 shown in Eqn. 2calculatesE by first calculating all the interaction probabilities in the network then multiplying those by the grammars which every agent expresses to get the environmentE. Theα
parameter from the geometric distribution1defines the travel decay rate. A lowerαdefines conceptu-ally more mobile agents.
More generally, En is a special case of
E(Gt,Ct,At) =Et+1where the number of com-munities equals the number of individuals (c=n).
1In this paper, jump probabilities decay according to a
geometric distribution, but other distributions including the Poisson have been implemented as well.
Cbecomes the identity matrix without loss of gen-erality, so the network’s initial condition does not have to be defined explicitly. For any other com-munity definition, an initial condition has to be de-fined as in Eqn.3which specifies the starting point in the network that each agent conceptually begins traveling from. The output of E is a g ×c ma-trix giving the environment of the average agent in each community.2
En(Gt,A) =Gt>α(I−(1−α)A)
−1 (2)
E(Gt,C,A) =En(Gt,A)C(C>C)−1 (3)
The output of E must be broadcast to g×n, which would result in the loss of some informa-tion unless the assumpinforma-tion can be made that each community is internally uniform. However, when that assumption can be made, then×nadjacency matrix admits ac×cequitable partitionAπ(Eqn. 4) (Schaub et al., 2016) which permits an alter-nate environment functionEEP(Gt,C,A)shown
in Eqn.5that is equivalent to the losslessEnifA. Ifnc,EEP is much faster to calculate because it only inverts a smallc×cmatrix rather than a large n×n. This makes it feasible to run much larger simulations than what has been done in the past.
Aπ= (C>C)−1C>AC (4)
EEP= αG>C(I−(1−α)Aπ)−1(C>C)−1 (5)
2.3 Learning in the Network
The environment function describes what inputs
Et+1 are available to learners given the language expressed by the mature speakers of the previ-ous age cohort with grammars Gt. The second
component of the framework describes the learn-ing algorithm A(Et+1) = Gt+1, how individu-als respond to their input environment. The result-ingGt+1 describes which grammars those learn-ers will eventually contribute to the subsequent generation’s environment Et+2. This
back-and-forth between adults’ grammarsGand childrens’ environment Eis the two-step cycle of language change (Fig.1).
Inneutral change, learners would acquire gram-mars at the rates that they are expressed in their environments, but there is good reason to believe
2(I−(1−α)A)−1
. . .Gt→Et+1 →Gt+1. . .Gt+i →Et+i+1. . .
Figure 1: Language change as an alternation be-tweenGandEmatrices
that most language change involves differential fit-ness between competing variants, and most non-trivial learning algorithms yield some kind of fit-ness (Kroch,1989;Yang,2000;Blythe and Croft, 2012, etc.), soA is rarely neutral. A neutral and simple advantaged model are both considered in Section3, and a more complex learning algorithm is described for Section4.
3 Application: Testing Assumptions
The general nature of the framework described here renders it suitable for reproducing the results of previous works and evaluating their assump-tions. To demonstrate this, we reproduce the ma-jor result fromKauhanen(2016), which tested the behavior of neutral change in networks of single-grammar learners, in order to dissect two of its primary assumptions. Implemented in a typical network framework, the original setup contains
n= 200individuals in probabilistically generated centralized networks in which individuals mature categorically to the single most frequent grammar in their input. The author found that categorical neutral change produced chaotic paths of change regardless of network shape and that periodically “rewiring” some of the network edges smoothed this out. Without commenting on rewiring, we find that the combination ofnand choice of categorical learners conspire to create the chaotic results.
We create two communities, both centralized along the lines of the single cluster in Kauhanen (2016), initialize all members of cluster 1 with grammar g1 and all members of cluster 2 with grammar g2, and additional edges are added be-tween members of clusters 1 and 2 to allow inter-action.Gis converted to an indicator matrix at the end of each learning iteration by rounding values to0 and1 in order to model categorical learners who only internalize the most common grammar in their inputs as in the original model.
In a pair of infinitely large clusters or two clus-ters where individuals are permitted to learn a probabilistic distribution of grammars, each clus-ter should homogenize to a 50/50 distribution of
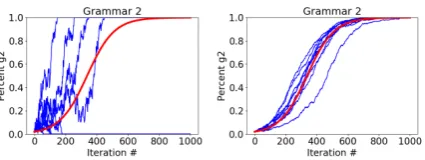
g1andg2after some number of iterations depend-ing on the specifics of the network shape and set-ting for α creating the red curves in Fig. 2. At
[image:5.595.309.525.211.290.2]n = 20000, each of 10 trials roughly follows the path of the predicted curve, but when run at the originaln = 200for 10 trials, this produces the type of chaotic behavior whichKauhanen (2016) attempts to repair. The outcome appears to be the result of an assumption made out of convenience (n= 200) rather than a principled decision.
Figure 2: Predicted curve (red); neutral change at
n = 200(left; Kauhanen (2016)); neutral change atn= 20000(right)
To further explore the impact of the population size assumption, we experiment on a model of advantaged change, which is typically contrasted with neutral change because of its tendency to produce “well-behaved” S-curve change (Blythe and Croft, 2012; Kauhanen, 2016). This time, only a single cluster is created, and the advantaged grammar is initially assigned to 1% of the pop-ulation. As seen in Figure 3, results are chaotic for n = 200 once again and near predicted for
n= 20000. This is important because atn= 200, advantaged change is chaotic, and most simula-tions both rise and fall. An experimenter who only studied advantaged change in small popula-tion might concluded that it is as ill-behaved as neutral change. While the conclusions that Kauha-nen (2016) draws appear valid for n = 200, it is not clear to what extent they can be projected onto larger populations. This demonstrates the need for carefully choosing one’s modeling as-sumptions and testing them out when possible.
4 Application: Mergers in Progress
Figure 3: predicted curve (red); advantaged change atn = 200(left; cf. Kauhanen (2016)); advantaged change atn= 20000(right)
lower chance of misinterpretation if a listener as-sumes the merged grammar instead of the non-merged grammar once a sufficient proportion of the environment is merged. Applied to Johnson (2007)’s detailed population study of the frontier of the COT-CAUGHT merger in the small towns
along the border between Rhode Island and Mas-sachusetts, this accurately predicts the ratio of merged input for a child to acquire the merged grammar, however when applied to a perfectly mixed population of learners, it fails to model the spread of the merged grammar in the population. Yang’s model is input-driven, so it is conducive to simulation with minimal assumptions past those drawn from the empirical data. We test the behav-ior of this learning model in a typical population network and demonstrate that it produces a rea-sonable path of change.
4.1 Background
The COT-CAUGHT merger, also called the low
back merger describes the phenomenon present in varieties of North American English spoken in eastern New England, western Pennsylvania, the American West, and Canada among others where the vowel in words like cot and the vowel in words like caught have come to be pronounced the same (Labov et al., 2005, pp. 58-65). The geographical extent of the merger is currently ex-panding, which might be expected if the merger has a cognitive or social advantage associated with it. Johnson (2007)’s study of the merger’s fron-tier on the border Rhode Island and Massachusetts uncovered an interesting social dynamic that il-lustrates the merger’s speed: there are families where the parents and older siblings non-merged, but the younger siblings are. The merger has swept through in only a few years and passed between the siblings.
Yang (2009) seeks to understand why mergers have an advantage from a cognitive perspective, and his model treats the acquisition of mergers as an evolutionary process. Learners who receive both merged (M+) and non-merged (M−) input entertain both a merged (g+) and non-merged (g−) grammar and reward whichever grammar success-fully parses the input. This kind of variational learner (Yang, 2000) is essentially an adaptation of the classic evolutionary Linear Reward Punish-ment model (Bush and Mosteller,1953). The fit-ness of each grammar is the probability in the limit that it will fail to parse any given input, and since it is virtually always the case that this probabil-ity is different for both grammars, fitness is virtu-ally always asymmetric. The variational learner is characterized as follows.
Given two grammars and an input tokens, The learner parses s with g1 with probability p and withg2 with probabilityq = 1−p. pis rewarded according to whether the choice ofgsuccessfully parsess(g→ s) or it fails to (g9 s), whereγis some small constant.
p0 =
(
p+γq, g→s
(1−γ)p, g9s
Given a specific problem, one can calculate a penalty probability C for each g, the proportion of input that would cause g 9 s. The grammar with the lowerC has the advantage, so the other one will be driven down in the long run.Ccan be estimated from type frequencies in a corpus, and the model is non-parametric because these values do not depend onγ.
lim
t→∞pt=
C2
C1+C2
lim
t→∞qt=
C1
C1+C2
To understand theCOT-CAUGHTmerger empir-ically, one must reason about what kind of in-put would trigger a penalty and then calculate the penalty probabilities of the merged grammar C+ and non-merged grammarC−from a corpus. This model considers parsing failure to be the rate of initial misinterpretation, and for a vowel merger, the only inputs that could create an initial misinter-pretation are minimal pairs because they become homophones. Examples ofCOT-CAUGHTminimal pairs includecot-caught, Don-Dawn, stock-stalk, odd-awed,collar-caller, and so on.
rate C+ comes down to lexical access. Under the observation that more frequent homophones are retrieved first regardless of syntactic context (Caramazza et al., 2001), g+ listeners only suf-fer initial misinterpretation when the less frequent member of a pair is uttered regardless of the rate of
M+. IfHis the sum token frequency of all mini-mal pairs andhio, hiohare the frequencies of theith pair’s members, thenC+is calculated by Eqn.6.
In contrast, g− listeners are sensitive to the phonemic distinction, so they misinterpretM− in-put at the rate of mishearing one vowel for the other(Peterson and Barney, 1952) (second half of Eqn. 7). And givenM+ input, they misinter-pret whenever they hear the phoneme which g− does not expect (e.g., a merged speaker pronounc-ingcot with the CAUGHT vowel) times the prob-ability of not mishearing that vowel (1-) plus
times the probability of hearing the right vowel (i.e., the merged speaker pronouncescotwith the
COT vowel but it is misheard anyway) (first half
of Eqn. 7). Sinceg− misinterpretation rates are a function of the rate ofM+(p) in the environment, there is a threshold ofM+speakers above which the merged grammar has a fitness advantage over the non-merged one.
C+=
1 H
X
i
min(hio, hioh) (6)
C−=
1 H
X
i
p0((1−oh)hoi +ohhioh) (7)
+q0(ohhio+ohhioh)
Calculating this threshold for the frequent min-imal pairs that Yang extracts from the Wortschatz project (Biemann et al., 2004) corpus3 and mis-hearing rates from Peterson and Barney (1952), the Yang model predicts that a learner exposed to at least ∼ 17% COT-CAUGHT-merged input will acquire the merger. This threshold repre-sents a strong advantage for M+ because it is well under the 50% threshold expected for neu-tral (non-advantaged) change and it is very close to what was found in Johnson (2007)’s sociolin-guistic study. It predicts that younger children may haveg+while their parents and even older siblings
3
Don(1052) –Dawn(736); collar (403) –caller(23);
knotty(25) – naughty(195); odd (830) –awed (80); Otto (67) –auto(260);tot(9) –taught(1327);cot(39) –caught
(2444);pond(258) –pawned(31);hock(25) –hawk(127);
nod(180) –gnawed(53);sod(30) –sawed(37)
haveg−if the 17% threshold was crossed inE af-ter the acquisition period of the older sibling but before that of the younger sibling.
4.2 Model Setup
All the mechanics behind the learning model re-duce to a simple statement: learners acquiresg+ iff > 17% of their input is M+ and they acquire
g− otherwise. However, this kind of categorical learner in a perfectly-mixed population leads to immediate fixation at eitherg−org+in a single it-eration, since the proportion ofg+speakers in the population is equivalent to the proportion ofM+ input in every learner’s environment. This is not realistic change. Clearly, social network structure is at least as important as the learning algorithm in modeling the spread of the merger.
We model the change in a non-uniform social network of 100 centralized clusters of 75 individu-als each. 75 was chosen as half Dunbar’s number, the maximum number of reliable social connec-tions that an adult can maintain (Dunbar, 2010). There are two grammars, g+ and g−, and learn-ers internalize one or the other according to the 17% threshold ofM+ in their input. One cluster represents the source of the merger and is initial-ized at 100% g+, while the rest begin 100% g−. Inter-cluster connections are chosen randomly so that some connections are between central mem-bers of the clusters and some are between periph-eral members. The one merged cluster is con-nected to half the other clusters representing those at the frontier of the change, and each other clus-ter is connected to five randomly chosen ones.4 This network structure echoes work in sociolin-guistics, in particular,Milroy and Milroy(1985)’s notion ofstrongandweakconnections in language change, where weak connections between social clusters are particularly important for propagation of a change.
Propagation of the merged grammar is calcu-lated byEnbecause we are interested in the
behav-ior of individuals without loss of precision and be-cause it cannot be assumed that each cluster is in-ternally uniform.5 Since the spread of the merger has been rapid enough to detect over a period of a few years, iterations are modeled as short age
co-4Originally, the clusters were set up as a “stepping-stone”
chain with the merged community at one end, and that pro-duced a similar S-curve. The structure presented here is more geographically plausible but not crucial for the results.
horts rather than full generations in the first exper-iments by updating only a randomly chosen 10% of nodes at each iteration because only a fraction of the population is learning at any given time. A model where every node is updated is investigated as well.
4.3 Results
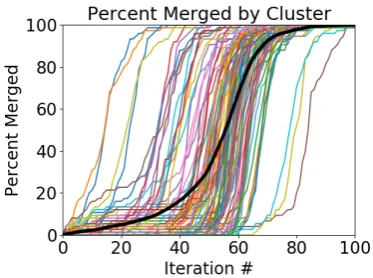
[image:8.595.322.508.269.408.2]The behavior of this simulation is shown graphi-cally in Figure 4. The fine/colored lines indicate the rate of M+ within each initially non-merged cluster, and the bold/black line shows the average rate across all initially non-merged. The merger spreads from cluster to cluster in succession over the “weak” inter-cluster connections and through each cluster over the ‘strong’ connections before moving on to the next ones.
Figure 4: Spread of merger across communities (fine/colored) and population average (bold/black)
Most individual clusters exhibit a period of time in which only a fewearly adopter(Rogers Everett, 1995) members have the merger, a period of rapid diffusion of the merger, then some time where a fewlaggards resist the merger. As a result, most clusters exhibit an S-like shape. A few clusters change rapidly because of their especially well-connected positions in the network, and some lag behind the rest because they are poorly connected to the rest of the network. More interestingly, the population-wide average, the population-level data at the kind of granularity that is often studied, yields a smooth S-curve with a shallower slope than the individual clusters. The fact that it arises naturally here in a network that conforms with typ-ical network shapes but was otherwise randomly generated is encouraging because the experiment was not set up so that it would produce such a curve, and the steep rate of change in individual
clusters is what is expected for a change that is rapid enough to affect siblings differently.
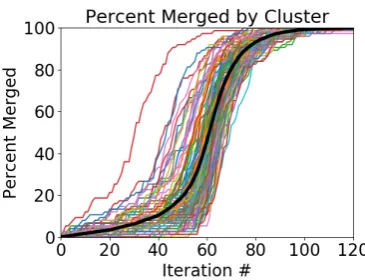
[image:8.595.87.274.311.450.2]In the above simulation, only a fraction of nodes were updated at each iteration in order to model a rapid change. In order to confirm that this choice is not affecting the results and to test a purer imple-mentation of the framework presented here, we re-move that constraint and update every node at each iteration. Figure5shows what happens over 20 it-erations in a network that is otherwise identical but with 2/5 as many inter-cluster connections as the original. A qualitatively similar pattern arises, so the choice to update only a fraction of the popula-tion is not crucially affecting the results.
Figure 5: Spread of merger across communities (fine/colored) and population average (bold/black)
In all experiments so far, social connections were fixed at the first iteration even though con-nections in real populations tend to change over time. To investigate that modeling assumption, we perform another simulation in which connections are randomly updated both within and across clus-ters at each iteration akin to Kauhanen (2016)’s rewiring. The result as shown in Figure6is simi-lar to before, with one major difference. The in-dividual clusters transition more closely in time because no individual cluster remains poorly con-nected or especially well concon-nected throughout the entire simulation.
Figure 6: Spread of merger within commu-nities (fine/colored) and as population average (bold/black). Network updated.
reach 100% because some of the clusters are not connected to the innovative one. The slope varies between trials, indicating that the rate of change is a function of both the population structure and the learning algorithm, but the network size does not substantially affect these results.
Figure 7: Single small network trial (left); average curves from 10 trials (right)
5 Discussion
The algebraic-network framework for modeling population-level language change presented here has substantial practical and theoretical advan-tages over previous ones. It is much simpler com-putationally than previous frameworks because it calculates the statistically expected behavior of each generation analytically and therefore re-moves the entire inner loop of calculating stochas-tic inter-agent interactions from the simulation. It follows theNiyogi and Berwick(1996) formalism for language change which presents a clean and modular way of reasoning about the problem and promotes the centrality of language acquisition.
In addition to the core algorithm, the framework offers enough flexibility to represent a wide va-riety of processes from the highly abstract (e.g., Kauhanen (2016)) to those grounded in
soci-olinguistic and acquisition research (e.g., Yang (2009)). In our investigation of Kauhanen’s basic assumptions, we discover how seemingly innocu-ous decisions about population size and learning conspire to drive simulation results. If learners are conceived as categorical learners, population size becomes a deciding factor in the path of change. So while the original results are interesting and meaningful, they may only valid for small (on the order of102) populations.
In our simulation of the spread of the COT
-CAUGHT merger, we show how a
cognitively-motivated model of acquisition requires a network model in order to represent population-level lan-guage change. The population is represented as a collection of individual clusters based on socio-logical work, but the clusters themselves are con-nected randomly. The fact that S-curves arise nat-urally from these networks underscores their cen-trality to language change.
One problem that this line of simulation work has always faced has been the lack of viable com-parison between models because every study im-plements its own learning, network, and interac-tion models. The modular nature of our frame-work advances against this trend since it is now possible to hold the population model constant while slotting in various learning models to test them against one another and vice-versa. Fi-nally, since this framework reduces to Niyogi & Berwick’s models in perfectly-mixed populations, it can be used to reason about the formal dynamics of language change as well.
Without simulation, it would be difficult or im-possible to undercover the interplay between ac-quisition and social structure on the propagation of language change. Neither factor alone can ac-count for the theoretical or empirically observed patterns. Simulations of this kind which explic-itly model both simultaneously is well equipped to provide insights that fieldwork and laboratory work cannot. As such, it is an invaluable comple-ment to those more traditional methodologies.
Acknowledgments
[image:9.595.74.289.372.451.2]References
Gareth J Baxter, Richard A Blythe, William Croft, and Alan J McKane. 2006. Utterance selection model of language change. Physical Review E, 73(4):046118.
Gareth J Baxter, Richard A Blythe, William Croft, and Alan J McKane. 2009. Modeling language change: an evaluation of trudgill’s theory of the emergence of new zealand english. Language Variation and Change, 21(02):257–296.
Christian Biemann, Stefan Bordag, Gerhard Heyer, Uwe Quasthoff, and Christian Wolff. 2004. Language-independent methods for compil-ing monolcompil-ingual lexical data. In International Conference on Intelligent Text Processing and Com-putational Linguistics, pages 217–228. Springer.
Leonard Bloomfield. 1933. Language history: from Language (1933 ed.). Holt, Rinehart and Winston.
Richard A Blythe and William Croft. 2012. S-curves and the mechanisms of propagation in language change. Language, 88(2):269–304.
Robert R Bush and Frederick Mosteller. 1953. A mathematical model for simple learning. In Se-lected Papers of Frederick Mosteller, pages 221– 234. Springer.
Kathryn Campbell-Kibler. 2009. The nature of so-ciolinguistic perception. Language Variation and Change, 21(1):135–156.
Alfonso Caramazza, Albert Costa, Michele Miozzo, and Yanchao Bi. 2001. The specific-word frequency effect: implications for the representation of homo-phones in speech production. Journal of Experimen-tal Psychology: Learning, Memory, and Cognition, 27(6):1430.
Luigi Luca Cavalli-Sforza and Marcus W Feldman. 1981. Cultural transmission and evolution: a quan-titative approach. 16. Princeton University Press.
Robin Dunbar. 2010. How many friends does one per-son need?: Dunbar’s number and other evolution-ary quirks. Faber & Faber.
Zsuzsanna Fagyal, Samarth Swarup, Anna Mar´ıa Esco-bar, Les Gasser, and Kiran Lakkaraju. 2010. Centers and peripheries: Network roles in language change.
Lingua, 120(8):2061–2079.
Edward Gibson and Kenneth Wexler. 1994. Triggers.
Linguistic inquiry, 25(3):407–454.
K David Harrison, Mark Dras, Berk Kapicioglu, et al. 2002. Agent-based modeling of the evolution of vowel harmony. In PROCEEDINGS-NELS, 32; VOL 1, pages 217–236.
Daniel E Johnson. 2007. Stability and change along a dialect boundary: The low vowel mergers of south-eastern new england. University of Pennsylvania Working Papers in Linguistics, 13(1):7.
Keith Johnson, Elizabeth A Strand, and Mariapaola D’Imperio. 1999. Auditory–visual integration of talker gender in vowel perception. Journal of Pho-netics, 27(4):359–384.
Henri Kauhanen. 2016. Neutral change. Journal of Linguistics, pages 1–32.
Jinyun Ke, Tao Gong, and William SY Wang. 2008. Language change and social networks. Communi-cations in Computational Physics, 3(4):935–949.
ed. Knight Chris Kirby, Simon, Michael Studdert-Kennedy, and James Hurford. 2000. The evolution-ary emergence of language: social function and the origins of linguistic form. Cambridge University Press.
Sheldon Klein. 1966. Historical change in language us-ing monte carlo techniques. Mechanical Translation and Computational Linguistics, 9(3):67–81.
Anthony S Kroch. 1989. Reflexes of grammar in pat-terns of language change. Language variation and change, 1(03):199–244.
William Labov. 1994. Principles of language change: Internal factors.
William Labov. 2001. Principles of language change: Social factors. Malden, MA: Blackwell.
William Labov, Sharon Ash, and Charles Boberg. 2005. The atlas of North American English: Pho-netics, phonology and sound change. Walter de Gruyter.
David W Lightfoot. 1979. Principles of diachronic syntax. Cambridge Studies in Linguistics London, 23.
James Milroy and Lesley Milroy. 1985. Linguis-tic change, social network and speaker innovation.
Journal of linguistics, 21(02):339–384.
James W Minett and William SY Wang. 2008. Mod-elling endangered languages: The effects of bilin-gualism and social structure.Lingua, 118(1):19–45.
Partha Niyogi. 1998. The logical problem of language change. InThe Informational Complexity of Learn-ing, pages 173–205. Springer.
Partha Niyogi and Robert C Berwick. 1996. A lan-guage learning model for finite parameter spaces.
Cognition, 61(1):161–193.
Partha Niyogi and Robert C Berwick. 1997. A dynam-ical systems model for language change. Complex Systems, 11(3):161–204.
Gordon E Peterson and Harold L Barney. 1952. Con-trol methods used in a study of the vowels.The Jour-nal of the acoustical society of America, 24(2):175– 184.
Nikolaus Ritt. 2004. Selfish sounds and linguistic evo-lution: A Darwinian approach to language change. Cambridge University Press.
M Rogers Everett. 1995. Diffusion of innovations.
New York, 12.
Teresa Satterfield. 2001. Toward a sociogenetic so-lution: Examining language formation processes through swarm modeling. Social Science Computer Review, 19(3):281–295.
Michael T Schaub, Neave O’Clery, Yazan N Billeh, Jean-Charles Delvenne, Renaud Lambiotte, and Mauricio Barahona. 2016. Graph partitions and cluster synchronization in networks of oscillators.
Chaos: An Interdisciplinary Journal of Nonlinear Science.
James N Stanford and Laurence A Kenny. 2013. Re-visiting transmission and diffusion: An agent-based model of vowel chain shifts across large communi-ties. Language Variation and Change, 25(2):119.
Henry Sweet. 1899. The practical study of languages. London: Dent.
Charles Yang. 2009. Population structure and language change. Ms., University of Pennsylvania.