http://www.scirp.org/journal/ajor ISSN Online: 2160-8849
ISSN Print: 2160-8830
DOI: 10.4236/ajor.2017.75023 Sep. 28, 2017 307 American Journal of Operations Research
A Weighted Goal Programming Model for the
DASH Diet Problem: Comparison with the
Linear Programming DASH Diet Model
Anayo Charles Iwuji
1, Emeka Uchendu Agwu
21Department of Statistics, Michael Okpara University of Agriculture, Umudike, Nigeria 2Department of Mathematics, Michael Okpara University of Agriculture, Umudike, Nigeria
Abstract
A Linear Programming DASH diet model for persons with hypertension has previously been formulated and daily minimum cost diet plans that satisfy the DASH diets’ tolerable intake level of the nutrients for 1500 mg a day Sodium level and different daily calorie levels were obtained using sample foods from the DASH diet eating plan chart. But the limitation in the use of linear pro-gramming model in selecting diet plans to meet specific nutritional require-ments which normally results in the oversupply of certain nutrients was evi-dent in the linear programming DASH diet plan obtained as the nutrient level of the diet plans obtained had wide deviations of from the DASH diets’ tolera-ble upper and lower intake level for the given calorie and sodium levels. Hence the need for a model that gives diet plans with minimized nutrients’ level deviations from the DASH diets’ tolerable intake level for different daily calorie and sodium level at desired cost. A weighted Goal Programming DASH diet model that minimizes the daily cost of the DASH eating plan as well as deviations of the diets’ nutrients content from the DASH diet’s tolera-ble intake levels is hereby presented in this work. The formulated weighted goal programming DASH diet model is further illustrated using chosen sam-ple foods from the DASH food chart as used in the work on the linear pro-gramming DASH diet model for a 1500 mg sodium level and 2000 calories a day diet plan as well as for 1800, 2200, 2400, 2600, 2800 and 3000 daily calorie levels. A comparison of the DASH nutrients’ composition of the weighted Goal Programming DASH diet plans and those of the linear programming DASH diet plans were carried out at this sodium level and the different daily calorie levels. It was evident from the results of the comparison that the weighted goal programming DASH diet plans has minimized deviations from the DASH diet’s tolerable intake levels than those of the linear programming DASH diet plans.
How to cite this paper: Iwuji, A.C. and Agwu, E.U. (2017) A Weighted Goal Pro-gramming Model for the DASH Diet Prob-lem: Comparison with the Linear Pro-gramming DASH Diet Model. American Journal of Operations Research, 7, 307-322. https://doi.org/10.4236/ajor.2017.75023
Received: August 24, 2017 Accepted: September 25, 2017 Published: September 28, 2017
Copyright © 2017 by authors and Scientific Research Publishing Inc. This work is licensed under the Creative Commons Attribution International License (CC BY 4.0).
DOI: 10.4236/ajor.2017.75023 308 American Journal of Operations Research
Keywords
DASH (Dietary Approaches to Stop Hypertension) Diet Model, Hypertension Diet Model, Minimum Nutrient Deviation Diet Plan, Weighted Goal Programming Diet Model, Linear and Goal Programming Comparison
1. Introduction
The DASH eating plan has been shown by research to prevent or lower high blood pressure. The DASH heart healthy daily eating plan requires foods that have low sodium, saturated fat, total fat and cholesterol nutrient content while rich in potassium, magnesium, calcium and fiber: see [1]. These eight mentioned nutrients which the DASH diet tends to decrease (i.e. sodium, total fat, saturated fat, cholesterol) and increase (i.e. potassium, magnesium, calcium, fiber) are re-ferred to as the “DASH nutrients” in this work. The DASH diet problem in-volves the challenge of having daily eating plans that meets the DASH diets’ nu-trients tolerable intake levels at a targeted budget based on the desired daily ca-lorie and sodium levels by concerned persons in order to reduce high blood pressure. A Linear Programming (LP) DASH diet model for persons with hypertension has been formulated in a previous research in which daily mini-mum cost diet plans that satisfy the DASH diets’ nutrients tolerable target intake level for 1500 mg sodium level and different daily calorie levels were obtained using sample foods of the DASH diet eating plan chart: see [2]. But the linear programming DASH diet model just like every linear programming model had its limitation. Besides, having just a single objective which was to obtain a daily minimum cost diet plan, there were large deviation of some nutrients from the DASH diets’ nutrients tolerable intake level for 1500 mg sodium level as was seen in the work on the LP DASH diet model. There was excess fiber, calcium, magnesium and potassium nutrients content in the LP diet plans as compared to their DASH tolerable intake levels. As we know, Nutrients when taken in excess have harmful effects. Excess fiber in a diet can cause several health problems like cramping, diarrhea, intestinal blockage while excess potassium on the other hand causes hyperkalemia among other side effects. Also excess calcium causes constipation, depression and fatigue among other side effects while excess mag-nesium is known to cause irregular heartbeat, low blood pressure, slow breathing and even death. Hence the need for a better model that give diet plans with mi-nimized deviations from the DASH diets’ tolerable intake levels for different daily calorie level diet plans at a desired cost. The goal programming technique is an appropriate method for achieving nutritional balance in selected diets [3]
DOI: 10.4236/ajor.2017.75023 309 American Journal of Operations Research
problems involving multiple, conflicting objectives and is applied in systems for which these varieties of conflicting, non-commensurable goals might be im-possible to satisfy exactly and thus an attempt is made to minimize the sum of the absolute values of deviations from such goals [5]. Hence goal programming tends to obtain an efficient solution since the solution might not be optimum with respect to all the conflicting objectives [6]. Weights are assigned to some deviational variables in the objective function to better reflect the importance and desirability of such deviations from the various goals.
DOI: 10.4236/ajor.2017.75023 310 American Journal of Operations Research
showed some uncertainties about how factors of nutrition diet—including taste and price, amounts of nutrients and their intake—affects diet quality, making the proposed model more realistic. Meanwhile, [13] presented a method and tool for optimizing beef-fattening diets. The approach presented was an example of how a combination of mathematical programming techniques might be ap-plied to prepare a user-friendly tool for optimal ration formulations. A spread-sheet was constructed from two modules based on mathematical deterministic programming techniques. To obtain an estimate of the magnitude of cost that any be incurred, the first module utilizes a linear program for least-cost ration formulation. The resulting value is then targeted as a cost goal in the second module. This is supported by weighted goal programming with a penalty func-tion. An algorithm to produce a list of food items that meets specific nutritional requirements was generated in [14]. With the algorithm, each nutrient received a score based on the amount of nutrients contained in the food list in relation to the Lower Bound Amount (LBA), Ideal Amount (IA) and Upper Bound Amount (UBA) necessary for the human body to thrive and these scores were aggregated to give the meal plan an overall score. [15] explored shared explanatory models (EM) of high blood pressure(HBO)/hypertension (HTN) using systematic data collection and analysis methods from cognitive anthropology. Quantitative and qualitative methods were used to discover the cultural knowledge of HBP/HTN shared by Medicare-eligible older adults in Los Angeles, some of whom had been diagnosed with HTN and some whom had not. [16] presented a linear and goal programming optimization model for determining and analyzing the food basket in Bosnia and Herzegovina in terms of adequate nutritional needs ac-cording to WHO and World Bank recommendations. Based on the official food basket, Linear Programming modeling was used to provide a more efficient so-lution for the food basket while a Goal Programming model was also developed in order to minimize deviations from nutrients constraints for a fixed budget. Meanwhile in this paper we present the Weighted Goal Programming model for the DASH diet problem for persons with hypertension as a more systematic ap-proach in minimizing the deviations of the nutrient content of the daily eating plans from the targeted DASH diet nutrients’ tolerable intake level as well as showing it is a better model compared to the Linear programming DASH diet model.
2. Methodology
2.1. The Linear Programming DASH Diet Model
The linear programming DASH diet model is given as follows:1 1 2 2 3 3
MinimizeDC=C X +C X +C X + + C Xn n
Subject to the Constraints
11 1 12 2 13 3 1n n 1c a X +a X +a X + + a X ≤R
DOI: 10.4236/ajor.2017.75023 311 American Journal of Operations Research
21 1 22 2 23 3 2n n 2c a X +a X +a X + + a X ≤R
(Constraint on sodium)
31 1 32 2 33 3 3n n 3c a X +a X +a X + + a X ≤R
(Constraint on cholesterol)
41 1 42 2 43 3 4n n 4c a X +a X +a X + + a X ≤R
(Constraint on saturated fat)
51 1 52 2 53 3 5n n 5c a X +a X +a X + + a X ≥R
(Constraint on calcium)
61 1 62 2 63 3 6n n 6c a X +a X +a X + + a X ≥R
(Constraint on magnesium)
71 1 72 2 73 3 7n n 7c a X +a X +a X + + a X ≥R
(Constraint on fiber)
81 1 82 2 83 3 8n n 8c a X +a X +a X + + a X ≥R
(Constraint on potassium)
91 1 92 2 93 3 9n n c a X +a X +a X + + a X =R
(Constraint on calorie)
j Ljc
X ≥S
j Hjc
X ≤S
where X X1, 2,X3,,Xn≥0,
1, 2, 3, ,
j= n, where j is number of food items;
1, 2, 3, , 9
i= , where i is number of nutrients. where DC = Diet Cost,
11, 12, 13, , 8n
a a a a are the content of the “DASH nutrients” in the foods.
1c, 2c, 3c
R R R and R4c are the Tolerable Upper Intake Level for Total fat, So-dium Cholesterol and Saturated fat respectively for calorie level c.
5c, 6c, 7c
R R R and R8c are the Tolerable Lower Intake Level for Calcium,
Magnesium, Fiber and Potassium respectively for calorie level c.
c
R is the Calorie level.
Ljc
S is the estimated Least number of daily Servings of food item j for calorie
level c.
Hjc
S is the estimated Highest number of daily Servings of food item j for
ca-lorie level c.
2.2. Weighted Goal Programming Model
DOI: 10.4236/ajor.2017.75023 312 American Journal of Operations Research
(
)
1 Minimize
m
i i i i i
Z w d+ + w d− −
=
=
∑
+Subject to the constraints Goal constraints: 1
n
ij j i i i
j a x d d b
− +
= + − =
∑
for i=1,,m System constraints: n1ij j i j= a x =b
∑
With
d d
i,
i,
x
j0
+ −
≥
, for i=1,,m and j=1,,n
where
Z is the objective function,
i
d− and di
+ are the negative and positive deviational variables
(undera-chievement and overa(undera-chievement) in goal i,
i
w− and wi
+ are non-negative constants representing the relative weights to
be assigned to the respective positive and negative deviation variables,
ij
a is the coefficient associated with variable j in goal i.
With i=1,,m and j=1,,n.
2.3. The Dash Eating Plan
The DASH eating plan is rich in fruits, vegetables, fat free or low-fat milk and milk products, whole grains, fish, poultry, beans, seeds and nuts. It also contains less salt and sodium, sweets, added sugar, and sugar-containing beverages, fats and red meats than most typical diets. The DASH eating plan for each individual according to the “Guide to lowering your Blood Pressure with DASH” depends on the number of calories that individual is allowed each day. The calorie levels which includes 1800, 2000, 2200, 2400, 2600, 2800 and 3000 calories a day de-pends on the age and activity level of the individual. Different calorie needs for each of the activity levels and for different ages for both males and females is shown in the appendices. The DASH eating plan is also based on recommended levels of daily sodium intake. This includes the 2300 and 1500 milligrams So-dium levels that DASH allows each day.
2.4. Weighted Goal Programming DASH Diet Model
The decision variables for the weighted Goal Programming DASH diet model are x x x1, 2, 3,,xn which represents the daily number of servings of foods 1, 2, 3,,n in the diet plan.
The target goals to be achieved include:
- Goal 1 (Cost goal): Minimize the overachievement of the daily target cost of
the diet, Cg.
- Goal 2 (Sodium nutrient goal): Minimize the overachievement of the
Tolera-ble Intake Level of sodium (Sg), in milligrams (mg).
- Goal 3 (Cholesterol goal): Minimize the overachievement of the Tolerable
Intake Level of cholesterol, (COLmg), in milligrams (mg).
- Goal 4 (Total fat goal): Minimize the overachievement of the Tolerable
In-take Level of total fat (TFg), in grams (g).
DOI: 10.4236/ajor.2017.75023 313 American Journal of Operations Research - Goal 6 (Saturated fat goal): Minimize the overachievement of the Tolerable
Intake Level of saturated fat (SFmg), in milligrams (mg).
- Goal 7 (Magnesium goal): Minimize the underachievement of the Tolerable
Intake Level of magnesium (Mmg), in milligrams (mg).
- Goal 8 (Fiber goal): Minimize the underachievement of the Tolerable Intake
Level of fiber (FIBg), in grams (g).
- Goal 9 (Potassium goal): Minimize the underachievement of the Tolerable
Intake Level of potassium, Pmg, in milligrams (mg).
- Goal 10 (Calcium goal): Minimize the underachievement of the Tolerable
Intake Level of calcium, CALmg, in milligrams (mg).
Because we don’t have the same unit of measurements for the different goals, hence the variables in the objective function will represent percentage deviation rather than absolute deviation.
So the objective function that minimizes the sum of the percentage deviations from the targets is given as;
100 100 100 100
Minimize
1 1 1 1
100 100 100 100
1 1 1 1
100
1
C S col TF
C S col TF
C S col TF
SF M Fib P
SF M Fib P
SF M Fib P
Cal calo calo
Cal calo calo
Cal calo calo
d d d d
D w w w w
b b b b
d d d d
w w w w
b b b b
d d d
w w w
b b b
+ + + +
+ + + +
+ − − −
+ − − −
− − +
− − +
= ⋅ + ⋅ + ⋅ + ⋅
+ ⋅ + ⋅ + ⋅ + ⋅
+ ⋅ + +
100
1
⋅
Subject to the constraints
( )
( )
( )1 1 2 2 3 3 n n 0 c 1 c $
c x +c x +c x ++c x + d−+ d+=C
(Cost goal constraint in Dollars)
( )
( )
( )11 1 12 2 13 3 1n n 0 s 1 s g
a x +a x +a x ++a x + d−− d+=S
(Sodium goal constraint in grams)
( )
( )
( )21 1 22 2 23 3 2n n 0 col 1 col mg
a x +a x +a x ++a x + d− − d+ =COL
(Cholesterol goal constraint in milligrams)
( )
( )
( )31 1 32 2 33 13 3n n 0 tf 1 tf g
a x +a x +a x ++a x + d−− d+=TF
(Total fat goal constraint in grams)
( )
( )
( )41 1 42 2 43 3 4n n 0 sf 1 sf mg
a x +a x +a x ++a x + d− − d+ =SF
(Saturated fat goal constraint in milligrams)
( )
( )
( )51 1 52 2 53 3 5n n 1 M 0 M mg
a x +a x +a x ++a x + d− − d+ =M
(Magnesium goal constraint in milligrams)
( )
( )
( )61 1 62 2 63 3 6n n 1 fib 0 fib g
a x +a x +a x ++a x + d− − d+ =FIB
DOI: 10.4236/ajor.2017.75023 314 American Journal of Operations Research
( )
( )
( )71 1 72 2 73 3 7n n 1 P 0 P mg
a x +a x +a x ++a x + d−− d+=P
(Potassium goal constraint in milligrams)
( )
( )
( )81 1 82 2 83 3 8n n 1 Ca 0 Ca mg
a x +a x +a x ++a x + d− − d+ =CA
(Calcium goal constraint in milligrams)
( )
( )
91 1 92 2 93 3 9n m0
calo1
caloa x
+
a x
+
a x
+ +
a x
+
d
−+
d
+=
CALO
(Calorie goal Constraint)
With dC,dS,dcol,dTF,dSF,dM,dFib,dP,dCalanddcalo,dcalo 0
+ + + + + − − − − + − ≥
where:
,
,
,
,
,
,
,
,
,
C S col tf sf M fib P Ca calo
d d d
+ + +d d
+ +d
+d
+d d
+ +d
+ and,
,
,
,
,
,
,
,
,
0
C S col tf sf M fib P Ca calo
d d d
− − −d d
− −d
−d
−d d
− −d
−≥
represents the overachievementsand under achievements respectively of the cost, sodium, cholesterol, total fat, saturated fat, magnesium, fiber, potassium, calcium and calorie level,
, , , , , , , , ,
C S Col TF SF M Fib P Cal Calo
w+ w w+ + w+ w+ w− w− w w− − w+ and wCalo
+ are the weights
as-signed to the respective overachievements and under achievements of the diet cost, DASH nutrients and calorie level.
Weights are assigned to indicate desirable and undesirable deviations. Weights of “1” are assigned to deviations that are undesirable in the model while weights of “0” are assigned to deviations that are desirable in the model [18]. Hence we will assign weights of 1 to the overachievement of the cost target, the Tolerable Intake levels sodium, cholesterol, total fat, saturated fat and calorie goals and also to the underachievement of magnesium, fiber, potassium, calcium and calorie goals. This is because it is undesirable to overachieve and undera-chieve their target levels respectively as it against the intents of the DASH eating plan for reducing hypertension.
, , , , , , ,
C S Col TF M Fib P Cal
b b b b b b b b and bCalo are the target values of the diet cost,
DASH nutrients and calorie level respectively.
ij
a = Quantity of ith DASH nutrient in jth food (in g or mg depending on the
nutrient).
with i=1, 2,,8 and j=1, 2,,n.
9j
a = Calorie level of jth food (in calorie)
j
C , cost of 1 serving of jth food.
j
x = is the number of servings of food j in the diet plan.
g
C is the budgeted cost of the eating plan.
g
S , COLg, TFg and SFg are the Tolerable target level of Sodium,
Cho-lesterol, Total Fat and Saturated Fat respectively in the days’ diet plan while Mg,
g
FIB , P0g and CALCg are the tolerable target level of magnesium, fiber,
potassium and calcium intake level respectively in the days’ diet plan.
3. Data Illustration of the Weighted Goal Programming
DASH Diet Model
DOI: 10.4236/ajor.2017.75023 315 American Journal of Operations Research
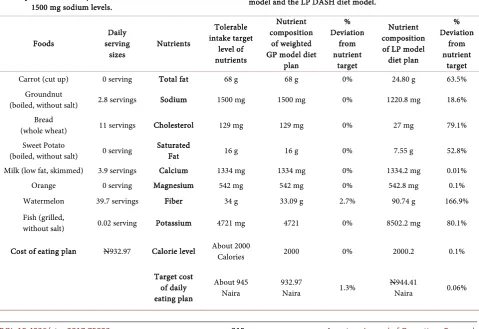
using the same data of selected food items from the DASH sample food chat and their cost per serving as used in work by [2]. The weighted Goal Programming DASH Diet plan for about 2000 calories a day with 1500 milligrams sodium level is considered in this model illustration where the targeted Tolerable Intake level of the nutrients is based on the attained nutrients level of a sample menu for 1500 milligrams sodium level and 2000 calories a day DASH eating plan as shown in the appendices. The formulated weighted Goal Programming DASH diet model with goals of attaining the desired daily cost of eating plan as well as attainment of the targeted Tolerable Intake Level of the nutrients is also pre-sented in the appendices. Meanwhile the sufficient weighted Goal programming eating plan using the sample food items for a 1500 milligrams sodium level and about 2000 calories a day is presented in Table 1 below. Weights of one (1) are assigned to those deviational variables in which deviation in those direction are being avoided. The sufficient Weighted Goal programming DASH diet model was compared with that of the Linear programming DASH diet model with respect to their deviations from the Tolerable target Intake Level of the DASH nutrients.
[image:9.595.59.539.416.745.2]The first part of Table 1 shows the Weighted Goal Programming daily diet plan for 2000 daily calories and 1500mg sodium level. The second part of
Table 1. Weighted goal programming daily diet plan for 2000 calorie-a-day and 1500 mg sodium level and comparison of its DASH nutrients’ composition with that of the linear programming DASH diet model with respect to DASH nutrients’ tolerable intake level.
Weighted Goal Programming daily diet plan for 2000 daily calories and
1500 mg sodium levels.
Comparison of the “DASH nutrients” composition of daily eating plans of the Weighted GP model and the LP DASH diet model.
Foods serving Daily
sizes Nutrients
Tolerable intake target
level of nutrients
Nutrient composition
of weighted GP model diet
plan
% Deviation
from nutrient
target
Nutrient composition of LP model diet plan
% Deviation
from nutrient
target Carrot (cut up) 0 serving Total fat 68 g 68 g 0% 24.80 g 63.5%
Groundnut
(boiled, without salt) 2.8 servings Sodium 1500 mg 1500 mg 0% 1220.8 mg 18.6% Bread
(whole wheat) 11 servings Cholesterol 129 mg 129 mg 0% 27 mg 79.1% Sweet Potato
(boiled, without salt) 0 serving Saturated Fat 16 g 16 g 0% 7.55 g 52.8% Milk (low fat, skimmed) 3.9 servings Calcium 1334 mg 1334 mg 0% 1334.2 mg 0.01% Orange 0 serving Magnesium 542 mg 542 mg 0% 542.8 mg 0.1% Watermelon 39.7 servings Fiber 34 g 33.09 g 2.7% 90.74 g 166.9% Fish (grilled,
without salt) 0.02 serving Potassium 4721 mg 4721 0% 8502.2 mg 80.1%
Cost of eating plan N932.97 Calorie level About 2000 Calories 2000 0% 2000.2 0.1%
Target cost of daily eating plan
About 945
DOI: 10.4236/ajor.2017.75023 316 American Journal of Operations Research Table 1 shows the comparison of the deviations of the nutrients content of the Weighted GP DASH diet model with those of the LP DASH diet model from the targeted DASH nutrients’ tolerable intake level for 2000 daily calorie and 1500 mg sodium levels. We can see in the comparison that there is deviation in the weighted Goal Programming model eating plan only for Fiber while the tolerable intake level nutrient target were met for the other DASH nutrients. On the other hand, for the Linear Programming DASH model eating plan we can see large deviations in the nutrient content of Total fat, Sodium, Cholesterol, Saturated fat, Fiber and Potassium from their DASH targeted tolerable intake nutrient levels.
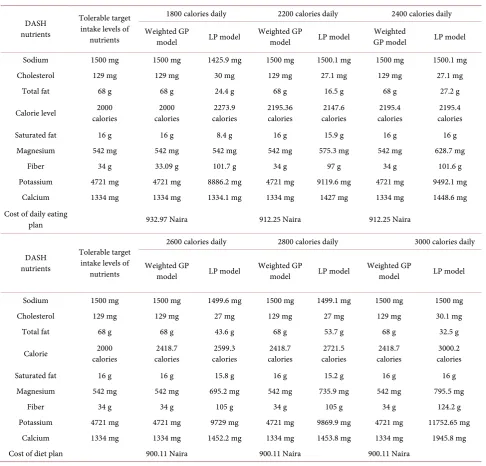
Table 2 shows the comparison of the nutrient content of the Weighted GP
Table 2. Comparison of the “DASH nutrients” composition between the weighted goal programming DASH diet model and the linear programming DASH diet model eating plans for different daily calorie levels.
DASH nutrients
Tolerable target intake levels of
nutrients
1800 calories daily 2200 calories daily 2400 calories daily Weighted GP
model LP model Weighted GP model LP model GP model Weighted LP model Sodium 1500 mg 1500 mg 1425.9 mg 1500 mg 1500.1 mg 1500 mg 1500.1 mg Cholesterol 129 mg 129 mg 30 mg 129 mg 27.1 mg 129 mg 27.1 mg
Total fat 68 g 68 g 24.4 g 68 g 16.5 g 68 g 27.2 g
Calorie level calories 2000 calories 2000 calories 2273.9 2195.36 calories calories 2147.6 calories 2195.4 calories 2195.4
Saturated fat 16 g 16 g 8.4 g 16 g 15.9 g 16 g 16 g Magnesium 542 mg 542 mg 542 mg 542 mg 575.3 mg 542 mg 628.7 mg
Fiber 34 g 33.09 g 101.7 g 34 g 97 g 34 g 101.6 g Potassium 4721 mg 4721 mg 8886.2 mg 4721 mg 9119.6 mg 4721 mg 9492.1 mg
Calcium 1334 mg 1334 mg 1334.1 mg 1334 mg 1427 mg 1334 mg 1448.6 mg Cost of daily eating
plan 932.97 Naira 912.25 Naira 912.25 Naira
DASH nutrients
Tolerable target intake levels of
nutrients
2600 calories daily 2800 calories daily 3000 calories daily
Weighted GP
model LP model Weighted GP model LP model Weighted GP model LP model
Sodium 1500 mg 1500 mg 1499.6 mg 1500 mg 1499.1 mg 1500 mg 1500 mg Cholesterol 129 mg 129 mg 27 mg 129 mg 27 mg 129 mg 30.1 mg Total fat 68 g 68 g 43.6 g 68 g 53.7 g 68 g 32.5 g
Calorie calories 2000 calories 2418.7 calories 2599.3 calories 2418.7 calories 2721.5 calories 2418.7 calories 3000.2
Saturated fat 16 g 16 g 15.8 g 16 g 15.2 g 16 g 16 g Magnesium 542 mg 542 mg 695.2 mg 542 mg 735.9 mg 542 mg 795.5 mg
Fiber 34 g 34 g 105 g 34 g 105 g 34 g 124.2 g Potassium 4721 mg 4721 mg 9729 mg 4721 mg 9869.9 mg 4721 mg 11752.65 mg
DOI: 10.4236/ajor.2017.75023 317 American Journal of Operations Research
DASH diet model and that of the LP DASH diet model with respect to the DASH nutrients tolerable intake level for 1500 mg sodium level for 1800, 2200, 2400, 2600, 2800 and 3000 calorie levels. As in the case of the comparison of the 2000 daily calorie level we see that the Weighted Goal programming model gives eating plans with minimized nutrient deviations from the targeted DASH nu-trients’ tolerable target levels while in the cases of the Linear programming mod-el there are very large nutrient deviations from targeted DASH nutrients’ tolera-ble intake levels.
4. Conclusion
The Weighted Goal Programming DASH diet model that minimizes the daily cost of the DASH eating plan as well as deviations of the daily diet plans’ nu-trient content from the targeted DASH diet’s tolerable intake levels has been formulated. It was further illustrated using the chosen sample foods from the DASH food chart for 1500 mg sodium level and 2000 calories a day diet plan and then also for 1800, 2200, 2400, 2600, 2800 and 3000 calorie levels. The “DASH nutrients” composition between the Weighted Goal Programming DASH diet model and the Linear Programming DASH diet model eating plans for different daily calorie levels was compared. From the comparison of the percentage devia-tion of the nutrient contents of the eating plan of two models from the DASH nutrients’ tolerable target level for 2000 calorie and 1500 mg sodium daily levels as shown in Table 1, we saw that there is minimized deviation from the DASH diet’s tolerable intake levels using the Weighted Goal Programming DASH diet model than when the Linear Programming DASH diet model is used. As shown in the comparison, in the Weighted GP DASH diet model only has deviation of 2.7% only in the fiber content whereas in the diet plan of the LP DASH model there were large deviations of some nutrients from their targeted DASH tolera-ble intake level. As shown, there was 63.5%, 18.6%, 79.1%, 52.8%, 166.9% and 80.1% nutrient content deviation for total fat, sodium, cholesterol, saturated fat, fiber and potassium respectively from their DASH tolerable target level which is enormous. Such is also the case in Table 2 in the comparison for other calorie levels. Hence, we can conclude that the Weighted Goal Programming DASH diet model is a better model in obtaining a daily diet plan that minimizes the devia-tions from the DASH tolerable intake nutrient levels at desired cost than the LP DASH diet model.
References
[1] National Heart, Lung and Blood Institute (2006) Your Guide to Lowering Your Blood Pressure with DASH. NIH Publication.
[2] Iwuji, A.C., Nnanna, M. and Ndulue, N.E.C. (2016) An Optimal DASH Diet Model for People with Hypertension Using Linear Programming Approach. Open Journal of Optimization, 5, 14-21. https://doi.org/10.4236/ojop.2016.51002
Interna-DOI: 10.4236/ajor.2017.75023 318 American Journal of Operations Research
tional Transactions in Mathematical Sciences & Computer, 4, 123-130. https://doi.org/10.4236/ajor.2014.42007
[4] Orumie, U.C. and Ebong, D. (2014) A Glorious Literature on Linear Goa Program-ming Algorithms. American Journal of Operations Research, 4, 59-71.
[5] Ignizio, J.P. (1978) A Review of Goal Programming: A Tool for Multi-Objective Analysis. The Journal of the Operational Research Society, 29, 1109-1119.
https://doi.org/10.1057/jors.1978.243
[6] Gupta, P.K. and Hira, D.S. (2012) Operations Research. S. Chand and Company Ltd., New Delhi.
[7] Anderson, A.M. and Earle, M.D. (1983) Diet Planning in the Third World by Linear and Goal Programming. The Journal of the Operational Research Society, 34, 9-16. https://doi.org/10.1057/jors.1983.2
[8] Ferguson, E.L., Darmon, N., Fahmida, U., Fitrivanti, S., Harper, T.B. and Prema-chandra, I.M. (2006) Design of Optimal Food-Based Complementary Feeding Recommendation and Identification of Key “Problem Nutrients” Using Goal Pro-gramming. Journal of Nutrition, 136, 2399-2404.
[9] Omotesho, O.A. and Muhammad-Lawal, A. (2010) Optimal Food Plan for Rural Households’ Food Security in Kwara State Nigeria: The Goal Programming Ap-proach. Journal of Agricultural Biotechnology and Sustainable Development, 2, 101-104. http://www.academicjournals.org/JABSD
[10] Pasic, M., Catovic, A., Bijelonja, I. and Bahtanovic, A. (2013) Weighted Goal Pro-gramming Optimization Model. Journal of Trends in the Development of Machi-nery and Associated Technology, 17, 101-104.
[11] Gerdessen, J.C. and de Vries, J.H.M. (2015) Diet Models with Linear Goal Pro-gramming: Impact of Achievement Function. European Journal of Clinical Nutri-tion, 69, 1272-1278.https://doi.org/10.1038/ejcn.2015.56
[12] Eghbali, H., Eghbali, M.A. and Vahidian, K.A. (2012) Optimizing Human Diet Problem Based on Price and Taste using Multi-Objective Fuzzy Linear Program-ming Approach. Ijocta, 2, 1-9. https://doi.org/10.11121/ijocta.01.2012.0095 [13] Zgajnar, J., Erjavec, E. and Kavcic, S. (2008) Multi-Step Beef Ration Optimization:
Application of Linear and Weighted Goal Programming with a Penalty Function.
Agricultural and Food Science, 3, 193-206.
[14] Pikes, T. and Adams, R. (2016) Computational Nutrition: An Algorithm to Gener-ate a Diet Plan to Meet Specific Nutritional Requirements. E-Health Telecommuni-cation Systems and Networks, 5, 31-38. https://doi.org/10.4236/etsn.2016.52004 [15] Hurwicz, M.-L. and Rose, M. (2016) Older Adults’ Explanatory Models of High
Blood Pressure. Health, 8, 680-693. https://doi.org/10.4236/health.2016.87072 [16] Arraut-Berilo, A., Delalic, A. and Huseinbasic (2017) A Nutritional Analysis of the
Food Basket of BiH: A Linear Programming Approach. South East European Jour-nal of Economics and Business, 12, 104-113.
[17] Charnes, A. and Cooper, W.W. (1975) Goal Programming and Multiple Objective Optimizations. Center for Cypernetic Studies Report CCS-250, the University of Texas Austin.
DOI: 10.4236/ajor.2017.75023 319 American Journal of Operations Research
Appendices
1) Formulated weighted goal programming model for 2000 calorie a day eat-ing plan with 1500 mg sodium level
( )
( )
( )
( )
( )
( )
( )
( )
( )
( )
( )
100 100 100 100
Minimize 1 1 1 1
944 1 1500 1 129 1 68 1
100 100 100 100
1 1 1 1
16 1 542 1 34 1 4721 1
100 100
1 1 1
1334 1 2000 2000 1
C S col TF
SF M Fib P
Cal calo calo
d d d d
D
d d d d
d d d
+ + + + + − − − − − + = ⋅ + ⋅ + ⋅ + ⋅ + ⋅ + ⋅ + ⋅ + ⋅ + ⋅ + + ⋅
Subject to the constraints
( )
( )
1 2 3 4 5 6 7
8
15 20 15 15 30 15 15
50 0 c 1 c 944 Naira
x x x x x x x
x d− d+
+ + + + + +
+ + + =
(Cost goal constraint in Naira)
( )
( )
1 2 3 4 5 6
7 8
33.6 1.5 124.8 15 8.1 3.2
2.4 73 0 s 1 s 1500 mg
x x x x x x
x x d− d+
+ + + + +
+ + + − =
(Sodium goal constraint in grams)
( )
( )
5 8
3
x
+
0.29
x
+
0
d
col−−
1
d
col+=
129 mg
(Cholesterol goal constraint in milligrams)
( )
( )
1 2 3 4 5 6
7 8
0.24 11.48 0.58 0.30 0.10 0.48
0.16 4.1 0 f 1 f 68 g
x x x x x x
x x d− d+
+ + + + +
+ + + − =
(Total fat goal constraint in grams)
( )
( )
1 2 3 4 5 6
7 8
0 1.55 0.2 0 0.6 0
0 34 0 sf 1 sf 16 g
x x x x x x
x x d− d+
+ + + + +
+ + + − =
(Saturated fat goal constraint in milligrams)
( )
( )
1 2 3 4 5 6
7 8
9.6 47.75 13.25 14 2.4 17.6
8 43 1 mag 0 mag 542 mg
x x x x x x
x x d− d+
+ + + + +
+ + + − =
(Magnesium goal constraint in milligrams)
( )
( )
1 2 3 4 5 6
7 8
2.48 2.33 1.55 3 0 2.72
0.24 0 1 fib 0 fib 34 g
x x x x x x
x x d− d+
+ + + + +
+ + + − =
(Fiber goal constraint in grams)
( )
( )
1 2 3 4 5 6
7 8
212.8 181.75 56.5 264 31 265.6
87.2 397 1 P 0 P 4721 mg
x x x x x x
x x d− d+
+ + + +
+ + + − =
+
(Potassium goal constraint in milligrams)
( )
( )
1 2 3 4 5 6
7 8
28 4.25 12.25 24 25 49.6
5.6 40 1 Cal 0 Cal 1334 mg
x x x x x x
x x d− d+
+ + + +
+ + − =
DOI: 10.4236/ajor.2017.75023 320 American Journal of Operations Research
(Calcium goal constraint in milligrams)
( )
( )
1 2 3 4 5 6 7
28 144.5 58.5 90 7 72 23.2
151 m 0 calo 1 calo 2000 calories
x x x x x x x
x d− d+
+ + + + + +
+ + + =
(Calorie goal Constraint).
2) Linear Programming DASH diet model for 2000 calorie and 1500 mg so-dium levels a day eating plan.
1 2 3 4 5 6 7 8
MinimizeDC=15X +20X +15X +15X +30X +15X +15X +50X
Subject to the constraints
1 2 3 4 5 6 7 8
0.24X +11.48X +0.58X +0.30X +0.10X +0.48X +0.16X +4.1X ≤68
(Constraint on total fat)
1 2 3 4 5 6 7 8
33.60X +1.5X +124.8X +15X +8.1X +3.2X +2.4X +73X ≤1500
(Constraint on sodium)
1 2 3 4 5 6 7 8
0X +0X +0X +0X +3X +0X +0X +0.29X ≤129
(Constraint on cholesterol)
1 2 3 4 5 6 7 8
0X +1.55X +0.2X +0X +0.6X +0X +0X +340X ≤16
(Constraint on saturated fat)
1 2 3 4 5 6 7 8
28X +4.25X +12.25X +24X +250X +49.6X +5.6X +40X ≥1334
(Constraint on calcium)
1 2 3 4 5 6 7 8
9.6X +47.75X +13.25X +14X +2.4X +17.6X +8X +43X ≥542
(Constraint on magnesium)
1 2 3 4 5 6 7 8
2.48X +2.33X +1.55X +3X +0X +2.72X +0.24X +0X ≥34
(Constraint on fiber)
1 2 3 4 5 6 7 8
212.8X +181.75X +56.5X +264X +31X +262.6X +87.2X +397X ≥4721
(Constraint on potassium)
1 2 3 4 5 6 7 8
20X +144.5X +58.5X +90X +7X +72X +23.2X +151X =2000
(Constraint on calorie)
1 4 X ≥
2 1 X ≤
3 3 X ≥
4 4 X ≥
5 6 X ≥
6 4 X ≥
7 4 X ≥
8 6 X ≤
DOI: 10.4236/ajor.2017.75023 321 American Journal of Operations Research
3 8 X ≤
4 6 X ≤
5 9 X ≤
6 8 X ≤
7 9 X ≤
3) Table showing sample foods together with their nutrient composition, weigh (in Grams) and cost for a serving size.
Nutrients
F FOODS
Carrot Ground nut (cooked)
Bread (whole wheat)
Sweet potato (boiled)
Milk
(low fat) Orange melon Water (grilled) Fish
Total
Fat 0.24 11.48 0.58 0.30 0.10 0.48 0.16 4.10
Sodium 33.60 1.50 124.80 15.00 8.10 3.20 2.40 73.00
Cholesterol 0 0 0 0 3.00 0 0 0.29
Saturated
Fat 0 1.55 0.20 0 0.60 0 0 34.00 Calcium 28.00 4.25 12.25 24.00 25.00 49.60 5.60 40.00 Magnesium 9.60 47.75 13.25 14.00 2.40 17.60 8.00 43.00 Fiber 2.48 2.33 1.55 3.00 0 2.72 0.29 0.00 Potassium 212.8 181.75 56.50 264.0 31.0 265.6 87.2 549.0
Calorie 28 144.50 58.5 90.00 7.00 72.0 23.2 151.00 Weight per
serving of food (in grams)
80 g 25 g 25 g 100 g 20 g 160 g 80 g 100 g
Cost of per serving of
food N15 N20 N15 N15 N30 N15 N15 N50
4) DASH daily calorie need chart for different level of activities
Gender Age Calories needed for each activity level Sedentary Moderately active Active
Female
19 - 30 2000 2000 - 2200 2400
31 - 50 1800 2000 2200
51+ 1600 1800 2000 - 2200
Male
19 - 30 2400 2600 - 2800 3000 31 - 50 2200 2400 - 2600 2800 - 3000
DOI: 10.4236/ajor.2017.75023 322 American Journal of Operations Research
5) Tolerable target intake level of DASH nutrients for 1500 milligrams sodium level and 2000 calories a day DASH eating plan
Nutrients Sodium Calorie Total fat Saturated fat Cholesterol Calcium Magnesium Potassium Fiber
Daily level 1500 mg 2000 68 g 16 g 129 mg 1334 mg 542 mg 5471 mg 34 g
Submit or recommend next manuscript to SCIRP and we will provide best service for you:
Accepting pre-submission inquiries through Email, Facebook, LinkedIn, Twitter, etc. A wide selection of journals (inclusive of 9 subjects, more than 200 journals)
Providing 24-hour high-quality service User-friendly online submission system Fair and swift peer-review system
Efficient typesetting and proofreading procedure
Display of the result of downloads and visits, as well as the number of cited articles Maximum dissemination of your research work
Submit your manuscript at: http://papersubmission.scirp.org/