Artificial intelligence and statistical techniques to predict
probability of injury survival
SALEH, Mohammed
Available from Sheffield Hallam University Research Archive (SHURA) at: http://shura.shu.ac.uk/24775/
This document is the author deposited version. You are advised to consult the publisher's version if you wish to cite from it.
Published version
SALEH, Mohammed (2018). Artificial intelligence and statistical techniques to predict probability of injury survival. Doctoral, Sheffield Hallam University.
Copyright and re-use policy
See http://shura.shu.ac.uk/information.html
Sheffield Hallam University
Materials and Engineering research Institute
Department of Engineering and Mathematics
Artificial Intelligence and Statistical Techniques
to Predict Probability of Injury Survival
Mohammed Saleh
Supervisors:
Professor Reza Saatchi (Sheffield Hallam University)
Professor Derek Burke (Sheffield children's Hospital)
Professor Fiona Lecky (Sheffield University)
ii
Declaration
This is to certify that I am responsible for the work submitted in this
report.
Signed……….Saleh…………..…
iii
ABSTRACT
The aim of this study is to design, develop and evaluate artificial intelligence and statistical techniques to predict the probability of survival in traumas using knowledge acquired from a database of confirmed traumas outcomes (survivors and not survivors). Trauma in this study refers to body injuries from accidents or other means. Quantifying the effects of traumas on individuals is challenging as they have many forms, affect different organs, differ in severity and their consequence could be related to the individual's physiological attributes (e.g. age, fragility, premedical condition etc). It is known that appropriate intervention improves survival and may reduce disabilities in traumas. Determining the probability of survival in traumas is important as it can inform triage, clinical research and audit. A number of methods have been reported for this purpose. These are based on a combination of physiological and anatomical examination scores. However, these methods have shortcomings as for example, combining the scores from injuries for different organs is complicated.
A method for predicting probability of survival in traumas needs to be accurate, practical and accommodate broad cases. In this study Sheffield Hallam University, Sheffield Children's Hospital, Sheffield University and the Trauma Audit and Research Network (TARN) collaborated to develop improved means of predicting probability of survival in traumas. The data used in this study were trauma cases and their outcomes provided by the TARN. The data included 47568 adults (age: mean = 59.9 years, standard deviation = 24.7 years) with various injuries. In total, 93.3% of cases had survived and 6.7% of cases had not survived. The data were partitioned into calibration (2/3 of the data) and evaluation (1/3 of the data). The trauma parameters used in the study were: age, respiration rate (RR), systolic blood pressure (SBP), pulse (heart) rate (PR) and the values obtained from two trauma scoring systems called Abbreviated Injury Score (AIS) and Glasgow Coma Score (GCS). Intubation and Pre-exiting Medical Condition (PMC) data were also considered.
Initially a detailed statistical exploration of the manner trauma these trauma parameters related to the probability of survival outcomes was carried out and the results were interpreted. The resulting information assisted the development of three methods to predict probability of survival. These were based on Bayesian statistical approach called predictive statistical diagnosis (PSD), a new method called Iterative Random Comparison classification (IRCC) and the third method combined the IRCC with the fuzzy inference system (FIS). The performance of these methods was compared with each other as well as the method of predicating survival used by the TARN called Ps14 (the name refers to probability of survival method reported in 2014).
The study primarily focused on Trauma Brain Injury (TBI) as they represented the majority of the cases. For TBI, the developed IRCC performed best amongst all methods including Ps14. It predicted survivors and not survivors with 97.2% and 75.9% accuracies respectively. In comparison, the predication accuracy for Ps14 for survivors and not survivors were 97.4% and 40.2%.
iv
ACKNOWLEDGMENTS
This study would not have been possible without the kind and continuous
support of my supervisors and collaboration from the Trauma Audit & Research
Network (TARN). I would like to extend my sincere thanks to them all.
I would like to express my great thanks to my director of studies Professor Reza
Saatchi, for his guidance, support, encouragement, valuable suggestions and
comments on various aspects of my PhD study. Special thanks to my PhD
supervisors Professor Derek Burke and Professor Fiona Lecky for their time
and very valuable guidance and assistance throughout the study. The medical
inputs were very important to the developments in this study.
I am grateful to invaluable support provided to this study by the TARN staff: Ms
Maralyn Woodford (executive Director), Ms Antoinette Edwards (Operations
Director & Deputy to the Executive Director), Ms Gemma Reed (Administrator
and Personal Assistant) and Mr Phil Hammond (Data Validation). I am very
grateful to the TARN for agreeing to make their trauma data available to this
research study.
v
Publications
1. Saleh, M., Saatchi, R., & Burke, D. (2017). Analysis of the influence of trauma injury factors on the probability of survival. International Journal of Biology and Biomedical Engineering, vol.11, pp.88-96.
2. Saleh, M., Saatchi, R., Lecky, F., & Burke, D. (2018). Predictive statistical diagnosis to determine the probability of survival in adult subjects with traumatic brain injury. Technologies, vol.6, no.,41, pp.1-16.
3. Saleh, M., Saatchi, R., Lecky, F., & Burke, D. (2017). Fuzzy logic to determine the likelihood of survival for trauma injury patients. In:
Harnessing the power of technology to improve lives. Studies in Health Technology and Informatics, IOS Press, vol. 242, pp.385-388.
4. SALEH, Mohammed, SAATCHI, Reza, LECKY, Fiona and BURKE, D. (2017). Computational analysis of factors affecting the probability of survival in trauma injuries. In: 2017 4th International Conference on Mathematics and Computers in Sciences and in Industry, Corfu, Greece, 24 August 2017 - 27 August 2017. IEEE, 114-118.
5. SALEH, Mohammed, SAATCHI, Reza and BURKE, D. (2017). Fuzzy logic to determine the likelihood of survival for trauma injury patients. In: 14th AAATE 2017 Congress.
vi
Table of contents
ABSTRACT ... iii
ACKNOWLEDGMENTS ... iv
Publications ... v
Table of contents ... vi
List of figures ... ix
List of tables ... xiii
List of acronyms ... xvi
Chapter 1 Introduction ... 1
1.1 Background and Purpose of the Study... 1
1.2 Aim and Objectives ... 4
1.3 Study's Contribution ... 4
1.4 Thesis Outline ... 6
1.5 Chapter Summary ... 7
Chapter 2 Literature Review ... 8
2.1 Introduction ... 8
2.2 Review of Trauma Scoring Systems ... 8
2.2.1 Anatomical Systems ... 9
2.2.2 Physiological Indices ... 12
2.2.3 Combined Anatomical and Physiological Score or Methods to Determine Probability of Survival ... 17
2.2.4 Artificial Intelligence Techniques based on Trauma Scoring Systems ... 21
2.3 Methods to Extract Keywords from Text ... 23
Chapter 3 Techniques Used in the Study ... 25
3.1 Overview ... 25
3.2 Trauma Scoring Systems Operations ... 25
3.2.1 Abbreviated Injury Scale (AIS) ... 25
3.2.2 The Glasgow Coma Scale (GCS) ... 26
3.3 Artificial Intelligence Techniques Operations ... 26
3.3.1 Fuzzy Logic ... 26
3.3.3 Fuzzification ... 28
3.3.3 Rule Base ... 29
3.3.4 Inference Engine ... 30
3.3.5 Defuzzification... 30
vii
3-5 Operation of the Iterative Random Comparison Classification (IRCC) ... 33
Chapter 4 Methodologies ... 38
4.1 Ethics ... 40
4.2 Development of a User Interface to Developed System ... 41
4.3 Artificial Intelligence Methods of Determining Probability of Survival ... 41
4.3.1 Implementation of IRCC and PSD system developed ... 42
4.3.2 Implementation of FIS ... 43
4.3.2.1 Input member functions ... 43
4.4 Chapter summary... 46
Chapter 5 Investigation of interrelation between trauma parameters and survival outcomes ... 47
5.1 Overview ... 47
5.2 Introduction of TARN Database Trauma Characteristics ... 47
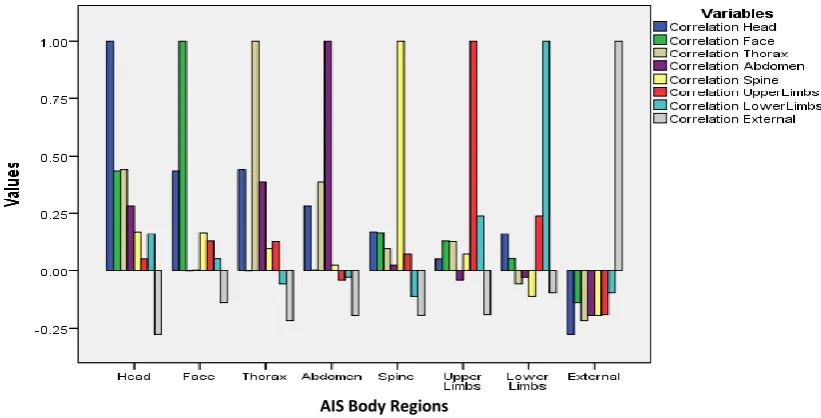
5.3 Investigation of relationships and correlation between AIS body regions and with other factors for non-surviving. ... 53
5.4 Chapter summary... 57
Chapter 6 Trauma Knowledge Representation and Coding ... 58
6.1 Overview ... 58
6.2 Knowledge Representation and Visualisation ... 59
6.3 Description of Data Used as Input to the Models for Predicting Probability of Survival .. 60
6.3.1 Overview ... 60
6.3.2 Analysis of Trauma Parameters ... 62
6.3.3 Relationship between TBI AIS Code and GCS, SBP, RR, RP, Gender and Age for Enhancing IRCC Operation. ... 64
6.3.4 Investigation of the Relationships between AIS and Intubation and PMC for FIS ... 68
6.4 Knowledge Coding ... 71
6.5 Integration of IRCC with FIS ... 73
6.5.1 FIS Development for incorporation to IRCC ... 73
6.6 Chapter summary... 76
Chapter 7 Probability of Survival Estimation Methods ... 77
7.1 Introduction ... 77
7.2 PSD Model ... 77
7.2.1 Results and Discussion of Ps14 Method and PSD Model ... 82
7.3 IRCC Model ... 83
7.3.1 Results of Ps14 Method and IRCC Model ... 86
viii
7.3.3 Comparison of Probability of Survival Predication Capability of Ps14, IRCC and PSD
by Considering Different Body Regions ... 91
7.4 Development of a User Interface for Probability of Survival Predication ... 92
7.4.1 Development of Trauma Scoring System Interface ... 92
7.6 Chapter summary... 95
Chapter 8 Conclusions and Further work ... 96
8.1 Conclusions ... 96
8.2 Summary of models developed and the approach for their evaluation... 96
8.2.1 Analysis of Trauma Cases ... 97
8.2.2 Trauma Knowledge Representation and Coding ... 97
8.2.3 Development of Methods to Predict Probability of Survival ... 98
8.2.4 Graphic User Interface for the IRCC ... 98
8.3 Summary of Original Contributions to Knowledge ... 98
8.3.1 A detailed analysis of trauma parameters ... 98
8.3.2 Proposition of three methods for the effective prediction of probability of survival for TBI ... 99
8.3.3 Critical evaluation of the methods developed ... 99
8.4 Further work ... 99
References ... xviii
Appendix A: Extra Work of Statistical Analysis ... XXVI
Appendix B: SHU Ethics Approval ... XXIX
ix
List of figures
Figure 1-1 Injury severity triangle 2010-11 (Health and Safety Executive 2012) ... 2
Figure 3-1Binary logic versus fuzzy logic. ... 27
Figure 3-2 Block diagram of fuzzy inference system (Jantzen, 1998). ... 27
Figure 3-3Triangular membership (Alonso, 2014). ... 28
Figure 3-4 Trapezoidal membership (Alonso, 2014). ... 28
Figure 3-5 Gaussian memberships (Alonso, 2014). ... 29
Figure 3-6 An example of defuzzification (Yamamoto and Morooka, 2005). ... 31
3-7 Flow chart of the IRCC operation. ... 36
Figure 4-1 The overall methodological framework of the research. ... 39
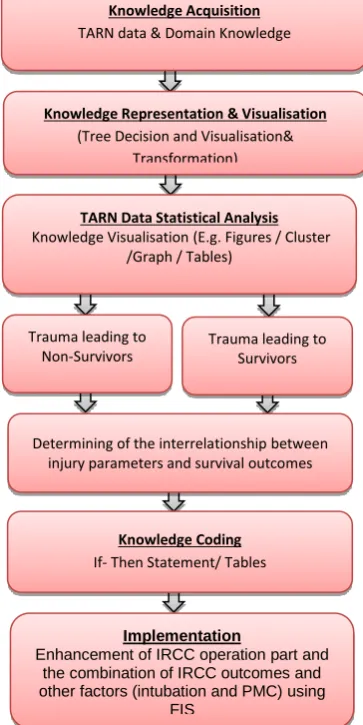
Figure 4-2 The framework for statistical analysis to establish trauma knowledge representation, coding and evaluation. ... 40
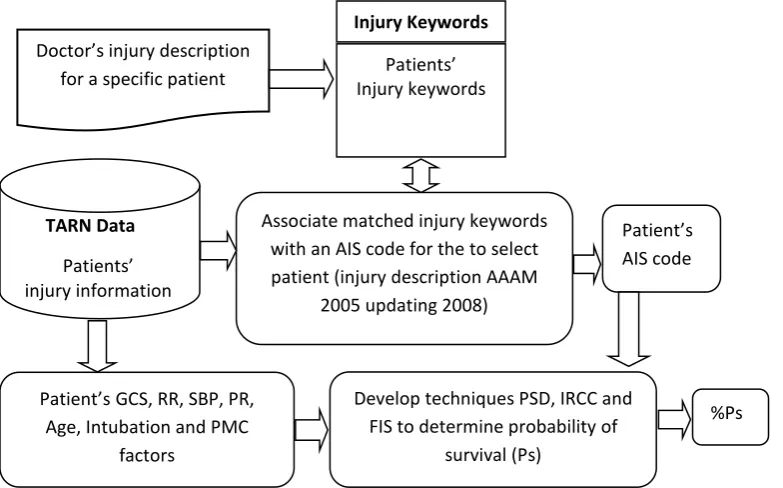
Figure 4-3 Operations to determine AIS code and probability of survival. ... 42
Figure 4-4 Block diagram of IRCC and PSD techniques. ... 43
Figure 4-5 Structure of a fuzzy inference system. ... 44
Figure 4-6 Membership functions for IRCC output. ... 44
Figure 4-7 Membership functions of PMC and intubation. ... 44
Figure 4-8 Typical rules relating the inputs and output of the FIS. ... 44
Figure 4-9 Output membership of probability of survival. ... 45
Figure 4-10 Prototype of DS mechanism when patient has further factors. ... 45
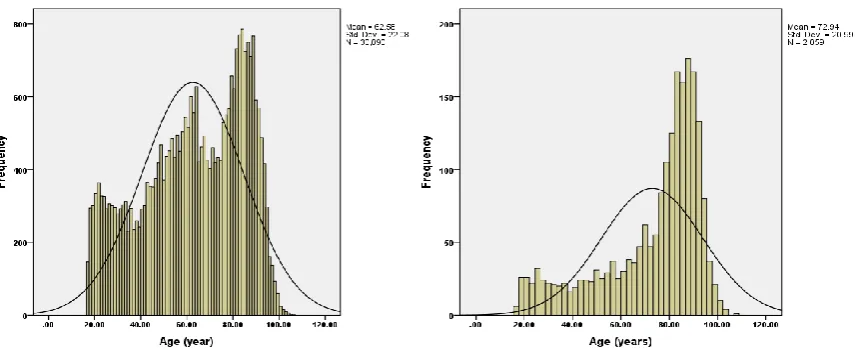
5-1 (a) Age distribution of individuals surviving (left) and (b) those not surviving (right). ... 48
Figure 5-2 Number of trauma cases for different injury mechanisms. ... 48
Figure 5-3: Injury numbers in relation to the AIS defined body regions. ... 48
Figure 5-4 Body region injuries with AIS scores 3-6 and associated number of cases that did not survive. ... 49
Figure 5-5 (a) Distribution of ISS values for (a) those that survived and (b) those that did not survive. ... 49
Figure 5-6 (a) Ps14 values for subject who survived (left) and (b) those did not (right). ... 50
x
Figure 5-8 (a) The effect of pre-existing medical condition on (a) those that survived
and (b) those that did not survive. ... 51
Figure 5-9 (a) Number of cases with normal (12 to 20 breathes per minute) emergency
department respiratory rate (a) those that survived and (b) those that did not survive.
... 51
Figure 5-10 Effect of emergency department pulse (heart) rate on probability of
survival in adults (a) survived cases (b) those that did not survive. ... 52
Figure 5-11 Impact of emergency department systolic blood pressure on probability of
survival in adults (a) survived cases (b) those that did not survive. ... 52
Figure 5-12 Correlation of trauma associated with the AIS defined body regions in
cases that did not survive. ... 53
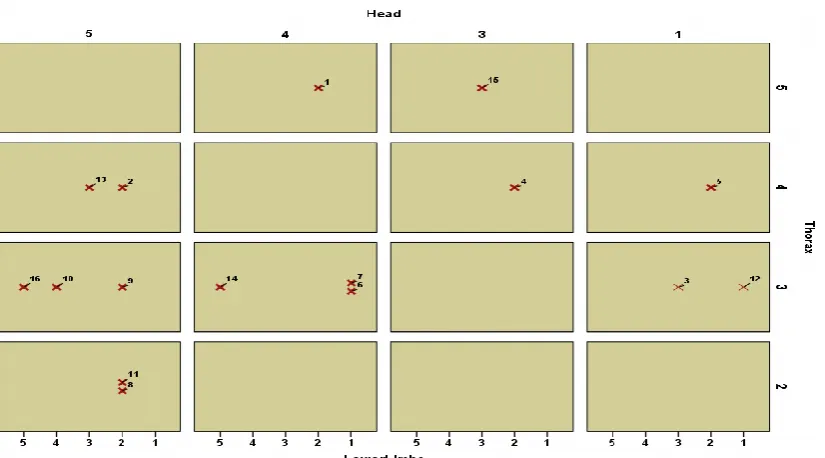
Figure 5-13 The interrelationship between trauma injuries associated with head,
thorax, and lower limb cases that did not survive represented by AIS scores 1-5... 54
Figure 5-14 Box plots indicating the relationship between (a) head only injury and (b)
thorax only injury for those that did not survive. ... 54
Figure 5-15 The interrelationship between GCS and head injuries in cases that did not
survive. ... 55
Figure 5-16 The interrelationship between GCS, head injury and age in cases that did
not survive. ... 55
Figure5-17 Relationship for GCS, PMC, injury mechanisms and head only injuries for
cases that did not survive. ... 56
Figure 5-18 The relationships for intubation, GCS, head and face regions, and GCS in
cases that did not survive. ... 56
Figure 6-1 Planning of Knowledge representation and coding design overview. ... 58
Figure 6-2 Decision tree for the trauma assessment system. ... 59
Figure 6-3 (a) shows the boxplots for the subjects' age divided into survivors and not
survivors. (b) Shows the age distribution of all subjects, (c) the subjects included in the
calibration and (d) those in the validation set. ... 61
Figure 6-4 (a) Age distributions of the subjects in the validation set for (a) survivors and
(b) not survivors. ... 61
Figure 6-5 Relationship between (a) AIS and systolic blood pressure; (b) GCS and
xi
Figure 6-6 The inter-relationships between pulse rate, systolic blood pressure, GCS,
AIS, and respiration rate. ... 65
Figure 6-7 Inter-relations of trauma parameters separated into (a) survivors and (b) not survivors. ... 65
Figure 6-8 The interrelationships between PMC AIS, GCS and average age for TBI not survivors. ... 69
Figure 6-9 Interrelationships between AIS, GCS and intubation. ... 70
Figure 6-10 Demonstration of IRCC outcomes. ... 74
Figure 6-11 IRCC outcomes input membership functions. ... 74
Figure 6-12 Membership functions for intubation and PMC. ... 74
Figure 6-13 FIS output membership functions. ... 75
Figure 7-1 The relationship between the prior probability of not survivors and the associated percentage correct identification for the survivors (blue plot) and not survivors (red plot). ... 78
Figure 7-2 The interrelationships between injury parameters for non-surviving cases. 78 Figure 7-3 Identification results for Ps14 for non-surviving cases in the validation dataset: (a) correctly identified cases (b) misidentified cases. ... 79
Figure7-4. Identification results for PSD for not survivors included in the validation dataset. (a) Correctly identified cases (b) misidentified cases.. ... 81
Figure7-5 The number of cases in the validation set correctly identified by Ps14 and PSD (a) non-surviving cases; (b) surviving cases. The middle bar indicates the overlap in correct identification of cases by both Ps14 and PSD. ... 82
Figure 7-6 The number of IRCC iteration (a) for surviving and non-surviving cases; (b) number of random groups. ... 84
Figure 7-7 The interrelationships between pulse rate, systolic blood pressure, GCS, AIS, and respiration rate information for not survivors... 84
Figure 7-8 Prediction results for IRCC for not survivors cases: (a) correctly identified (b) misidentified ... 85
Figure 7-9 The distribution for IRCC and Ps14 results (a) Ps14 and (b) IRCC. The red line is the boundary for survivors and not survivors considered as 50%. ... 87
xii
Figure 7-11 Regression variable plots for Ps14 and IRCC outcomes for (a) both and (b)
not survived cases (green circles are survival cases and red those are not) considered
as 50%. ... 89
Figure 7-12 Association of AIS and prediction accuracy for (a) Ps14 and (b) IRCC for not survivors considered as 50%. ... 89
Figure 7-13 Association of GCS and prediction accuracy for (a) Ps14 and (b) IRCC for not survivors considered as 50%. ... 90
Figure 7-14 Association of age with probability of survival prediction for IRCC and Ps14 for not survivors. ... 91
Figure 7-15 A section of AIS injury description and associated codes based on AAAM dictionary. ... 93
Figure 7-16 Graphic user interface. ... 93
Figure 7-17 Interface to generate AIS code ... 93
Figure 7-18 Determining probability of survival (Ps) Interface... 94
xiii
List of tables
Table 2-1 Types of trauma scoring systems. ... 9
Table 2-2 Associated Intra-abdominal injuries. ... 12
Table 2-3 Total number of organs injured. ... 12
Table 2-4 Revised trauma score. ... 13
Table 2-5 The TRISS coefficients. ... 18
Table 3-1 AIS code and injury description (AAAM 2005 updating 2008). ... 25
Table 3-2 AIS numeric to specific injury description. ... 25
Table 3-3 AIS severity level code... 26
Table 3-4 The Glasgow Coma Scale (GCS). ... 26
Table 3-5 Average and standard deviation of trauma parameters for head injury, all cases. ... 34
Table 3-6 Average and standard deviation of trauma parameters for head injury for three randomly selected samples.. ... 35
Table 5-1Overview of all injury trauma cases. ... 47
Table 5-2 Overview of injury cases. ... 57
Table 6-1 Information summary for adult TBI cases (total 4124). ... 60
Table 6-2 Age (in years) statistical summary for subjects in the validation set. ... 62
Table 6-3 Categorization of Glasgow coma score (GCS), pulse rate (PR, beats per minute, bpm), respiratory rate (RR, breaths per minute, bpm) and systolic blood pressure. ... 62
xiv
Table 6-5 The mean and standard deviation of AIS and categorized Glasgow Comas
Score GCS, PR, RR and SBP for not surviving cases included in the validation set. ... 63
Table 6-6 Analysis of injury patterns TBI included in the validation set (the patterns
with relatively small number of cases are not shown).. ... 66
Table 6-7 Trauma scenarios and their associated trauma parameters for survivors. .... 67
Table 6-8: Nine significant scenarios from Table 6-6 related to not survivors. ... 68
Table 6-9 PMC information for the cases studied. ... 69
Table 6-10 Number of cases with intubation and their mean age. ... 70
Table 6-11 IF-THEN rules for survivors derived from the information provided in Table
Table 6-12 IF-THEN rules for not survivors derived from the information provided in
Table 6-13 knowledge coding associated with intubation and PMC ... 72
Table 6-14: Setting up of the FIS rules for PMC and intubation for associated with IRCC
output. ... 75
Table 7-1 Analysis of injury patterns for not survivors included in the validation set (the
patterns with relatively small number of cases are not shown). ... 81
Table 7-2: Comparison of PSD and Ps14 to predict probability of survival for cases in
the validation set... 82
Table 7-3 Performance comparison of PSD and Ps14 based on age groups for not
surviving cases in the validation dataset. ... 82
Table 7-4 Illustration of the effect of age, pulse rate (PR), systolic blood pressure (SBP)
and respiratory rate (RR) on PSD performance in identifying surviving and not-surviving
cases included in the validation set. ... 83
Table 7-5 Analysis of IRCC classification for injury patterns for TBI non-surviving cases
included in the validation set (the patterns with relatively small number of cases are
xv
Table 7-6 IRCC results combined with the enhancement IRCC operation part and a
comparison with Ps14. ... 86
Table 7-7 Performance of IRCC based on different random validation cases from the
same data set. ... 87
Table 7-8 provides a summary of a comparison of Ps14, IRCC and PSD for predicting
xvi
List of acronyms
AAAM Association for the Advancement of Automotive Medicine
AI Artificial Intelligence
AIS Abbreviated Injury Scale
AP Anatomic Profile
APACHE Acute Physiology and Chronic Health Evaluation
ASCOT A Severity Characterisation of Trauma
CCI Charlson Comorbidity Index
COPD Chronic Obstructive Pulmonary Disease
CRAMS
Circulation, Respiratory, Abdominal/Thoracic, Motor and Speech Scale
CVA/TIA Cerebrovascular Accident/ Transient Ischemic Attack
DRISS Drug-Rock Injury Severity Score
DS Developed system
ED Emergency Department
ESI Emergency Severity Index
EX Expert System
FIS Fuzzy Inference System
FL Fuzzy Logic
FREC Faculty Research Ethics Committee
GA Genetic Algorithm
GAP Glasgow Coma Scale, Age, and Systolic Blood Pressure
GCS Glasgow Coma Scale
GUI Graphic User Interface
HARM Harborview Assessment for Risk of Mortality
HR Heart Rate
ICISS ICD- 9-CM Injury Severity Score
IRCC Iterative Random Comparison Classification
ISS Injury Severity Score
LOC Standardise assessment of level of consciousness
LOD Logistic Organ Dysfunction Score
MFs Membership Functions
MLP Multilayer Perceptron
MODS Multiple Organ Dysfunction syndrome
MOF Multiple organ failure
NFS No Specific Structure
NN Neural Networks
OIS Organ Injury Scales
PATI Penetrating Abdominal Trauma Index
PEFR Peak Expiratory Flow Rate
PGCS Paediatric Glasgow Coma Scale
PI Prognostic Index
xvii
PR Pulse Rate
PS Probability of Survival
PSD Predictive Statistical Diagnosis
PTS Paediatric Trauma Score
RAPS Rapid Acute Physiology Score
REMS Rapid Emergency Medicine Score
RR Respiratory Rate
RTS Trauma Revised Trauma Score
SAPS Simplified Acute Physiology Score
SBP Systolic Blood Pressure
SCH Sheffield Children Hospital
SHU Sheffield Hallam University
SIRSS Systemic Inflammatory Response Syndrome Score
SOFA Sequential Organ Failure Assessment Score
TARN Trauma Audit and Research Network
TI Trauma Index
TIB Trauma Brine Injury
TMPM Trauma Mortality Prediction Model
TRISS Trauma Score - Injury Severity Score
TS Trauma Score
xviii
List of Symbols
b0 Regression coefficients
Degree of membership in fuzzy logic
e Constant= 2.718282
M Mean value
Г Beta function
1
Chapter 1 Introduction
Injury is a primary cause of death and disability (Mullins 1999), accounting for
10% of global burden of non-surviving cases (Laytin et al., 2017). A number of
scoring systems have been reported to quantify the severity of injury by
considering measurable or observable status of the patient’s medical condition
(Dillon et al, 2006). Trauma scoring systems can be beneficial for a number of
situations (Wisner 1992; Kim 2012). These include (i) triage, a procedure to
assess severity of medical condition for the purpose of setting treatment priority;
(ii) prognostic evaluation, a procedure to support predication and management
of injury outcomes and (iii) research studies to compare patient groups on the
basis of injury outcomes and assessing medical care and treatments. Trauma
scoring systems can be classified into anatomical, physiological and a
combination of both. Anatomical scoring systems quantify the extent of
individual anatomical injuries, taking into account the body injury sites by
appropriate weightings (coefficients) however these weightings are often not
known when the patient visits hospital after a civilian trauma where most injury
mechanisms are blunt (e.g. falls and road traffic collisions) (Fani-Salek et al,
1999). Physiological scoring systems are based on cardiovascular, neurological
and respiratory abnormalities. They provide mechanisms to determine the
likelihood of mortality and inform triage; but can lack precision (Fani-Salek et al,
1999). Combined anatomical and physiological scoring systems integrate the
strengths of the anatomical and physiological scoring systems to improve their
estimation of the probability of survival (Meredith et al, 1995).
Trauma scores together with host factors such as Gender, age and pre-existing
medical condition (PMC) are used in models to determine probability of survival
(Reith et al, 2017; Moon et al, 2013; Chawda et al., 2004; Pike et al, 2017;
Kuwabara et al, 2010).
1.1 Background and Purpose of the Study
Assessing the level of severity of injury in a hospital’s emergency department
(ED) is highly demanding due to diversity of injury types, individual
vulnerabilities (e.g. varied age groups), large number of possible physiological
2
well as complexities in anatomical assessments (e.g. evaluating a head injury).
Early intervention in many medical and traumatic conditions can improve
survival outcome and reduce disabilities.
Injury is the main cause of death and disability (Mullins, 1999) and survival of a
severely injured person depends on the specialized care delivered in a timely
manner. Therefore, a careful assessment of the severity of injuries is essential
to reduce disabilities and mortalities. Trauma scoring systems improve triage
decisions, identify patient unexpected trauma outcomes, generate audit
information and provide objective information for external and internal outcome
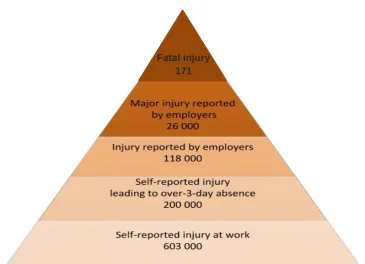
comparisons (Lefering, 2002). Figure 1.1 shows a triangle of work related
injuries in the UK in 2010/ 2011 and their severities reported by (Health and
Safety Executive 2012). However, many injuries occur outside work
[image:21.595.131.497.356.620.2]environment.
Figure 1-1Injury severity triangle 2010-11 (Health and Safety Executive 2012)
The extent of injury severity could be classified as nominal, ordinal or interval
(Health and Safety Executive 2012). Majority of characterizations of injury
severity are in nominal scales where verbal classifications are used to describe
injury. They are valuable in simplifying communication between parties. Ordinal
approaches use a positive entire numbers to provide a score to an injury Fatal injury
3
severity. Several groupings such as fractures and many neurosurgical,
orthopedic and common injury classifications fall into this type. Interval scales
likewise give numbers however there is an implicit probability of some reliability
in the intervals between the numbers (Champion 2002).
A number of injury severity scoring systems were reported in the last decades.
These are intended to accurately and consistently quantify injuries by
considering measurable or observable status of the patient's medical conditions.
The main benefits of trauma scoring systems are (Wisner, 1992): triage which
sets priorities to treat patients; prognostic evaluation which enables the
prediction and management of injury outcomes; and research and evaluation
which compares patient groups on injury outcomes and examines the effects of
treatments.
In order to obtain the anatomical and neurological injury related information, a
number of standard scoring systems are available. A commonly used system
for assessing anatomical injuries is the Abbreviated Injury Scale (AIS)
(Gennarelli et al, 2006). It was introduced in 1971 by the Association of the
Advancement of Automotive Medicine to aid vehicle crash investigators. It has
since been revised to be more relevant to medical audit and research. AIS
classify injuries in all body regions according to their relative importance. In
order to determine an overall trauma injury score for patients with multiple
trauma injuries, the Injury Severity Score (ISS) could be used. This is an
anatomical scoring system with the maximum total score of 75 that selects the
highest AIS values in each body region (Barker et al, 1974). The three most
severely injured regions (corresponding to 3 largest scores) have their scores
squared and then summed to produce the ISS value. However, ISS has a
number of limitations in identifying the implication of the injury sites (Fani-Salek
et al,. 1999). For example, brain traumas have different implications compared
with skin bruising. ISS is nevertheless used for as an anatomical scoring system
in methods such as the TARN Ps14 in order to determine probability of survival.
The TARN is a UK center involved in researching trauma and its team receives
injury information from the UK hospitals code them according to the AIS system.
The TARN has proposed Ps14 (probability of survival prediction proposed in
2014) to predict probability of survival. In this study methods to determine
4 1.2 Aim and Objectives
The primary aim of this research is to develop and evaluate improved methods
of determining probability of survival in traumas. Its objectives are:
i. Analyze the trauma cases from the available TARN data base to ascertain
the interrelationships between trauma parameters such as age, Gender,
respiration rate, systolic blood pressure, pulse rate, abbreviated injury scale
Glasgow coma score, pre-existing medical conditions and intubation with
the probability of survival.
ii. Use analysis information from (i) to develop improved methods of predicting
probability of survival.
iii. A critically evaluate the methods developed in (ii) against each other and
against Ps14 for different traumas but with the main focus of traumatic brain
injury (TBI) were carried out.
iv. Publish findings in peer reviewed journals and conferences.
1.3 Study's Contribution
The study's contributions in relation to its objectives were:
i. A detailed analysis trauma parameters including age, gender, respiration
rate, systolic blood pressure, pulse rate, abbreviated injury scale,
Glasgow coma score, pre-existing medical conditions, intubation and
these are used to the probability of survival in TBI was carried out. It was
found all these parameters are significant in determining probability of
survival. The investigations indicated the manner AIS and GCS values
for different body regions relate to the probability of survival. Matlab© and
SPSS© were used in these analysis to provide visual representation of
the findings in the form of graphs, plots, distributions and clustering.
These packages were also used to complement the visual information
5
included in Chapter 5 but related information also appears in the
following chapters.
ii. Three methods to predict probability of survival for TBI were proposed. One is based on a statistical Bayesian method called predictive statistical
diagnosis (PSD). The second was a novel method referred to as Iterative
random comparison classification (IRCC). IRCC uses a randomly
selected group of cases with predefined group size as part of its
operation and by interactively repeating the process determine the
probability of survival. The third method combined IRCC with fuzzy
inference system (FIS) to accommodate pre-existing medical conditions
(PMC) and intubation information. The use of FIS required careful
knowledge representation and knowledge coding. Fuzzy logic is a
valuable technique to accurately representing complex imprecise
information. More details related to the development of the methods are
included in chapter 3 and 4.
iii. A critically evaluation of the methods developed in (ii) against each other and against Ps14 for different traumas was carried out. A number of
body regions such as head and face etc. were also included in the
evaluation but as the main fatalities in the available database were due
to TBI, the focus of the study was on TBI. The main challenge for all
methods was to improve prediction for not survivors as compared with
the existing Ps14 method as Ps14 already had a high accuracy for the
survivors. The three methods proposed in this study managed to
significantly improve the probability of prediction for not survivors. For
example for TBI, there were 1224 survivors and 224 not survivors. The
predication accuracy for not survivors for Ps14, PSD and IRCC were
40.1%, 50.0% and 75.9%. The predicating accuracies for Ps14, PSD and
IRCC for survivors were 97.3% 90.8% and 97.2%. The details of the
results that also include head and face injury, head and chest injury,
head, face and chest injury are provided in chapters 6 and 7.
iv.
The study has so far resulted in two journal papers, one book chapters and two conferee proceedings. There is scope for at least two further6 1.4 Thesis Outline
Chapter 2 Literature Review
The previous studies associated with determining probability of survival and
technological background for types of trauma scoring systems are explained
and compared.
Chapter 3 Technologies Used in the Study
The theoretical and technological background for medical methods and other
techniques that are used in this study towards achieving the set aims are
described.
Chapter 4 Methodologies
The methodologies to obtain the results included in the thesis are explained.
Chapter 5 Investigation of interrelation between trauma parameters and survival outcomes
A statistical analysis of the subject details and their injuries as well as the
interrelationship between probability of survival and the injuries are carried out
and the results are presented.
Chapter 6 Trauma Knowledge Representation and Coding
The development of the knowledge representation and coding to assist with
determining the probability of survival is explained.
Chapter 7 Probability of Survival Estimation Method
The operations and the results for the three methods of determining probability
of survival are explained and their merits and limitations are analysed against
the exiting Ps14 method.
Chapter 8 Conclusions and Future Work
The study’s conclusions, main findings and suggestions for future work are
7 1.5 Chapter Summary
The study's background, aim and objectives were discussed. The trauma
scoring systems and processing methods and systems developed to predict the
probability of survival were described. An aim of the study was development of
robust probability of survival calculation methods. These will be described in the
8
Chapter 2 Literature Review
2.1 Introduction
Trauma is one of the most important concerns in health care that can lead to
mortality and morbidity. Documentation of trauma data facilitates comparison
between patient care and outcomes from different medical centres. Triage of
trauma is used to assess level for prioritising of injured people for treatment or
transport that depend on their severity of injury. Primary triage is performed at
the scene of an accident and follow up triage at the hospital (Patient 2015).
Trauma scores provides audit and research tools to study the outcomes of
trauma and its care. Many different trauma scoring systems have been
developed; some are based on physiological scores e.g., Glasgow Coma Scale
(GCS), others rely on anatomical descriptors e.g., Abbreviated Injury Scale
(AIS).There are also combinations of both systems. However, there is no single
universally accepted system as each system has its own merits. This chapter is
divided into three main parts are: review of trauma scoring systems, artificial
intelligence techniques based on trauma scoring systems and methods to
extract keywords from Text.
2.2 Review of Trauma Scoring Systems
The trauma scoring systems can be divided into anatomical, physiological and
combined. However, some other artificial intelligence techniques have been
also used to predict probability of survival (Ps). These are summarised in Table
9
Table 2-1Types of trauma scoring systems.
Anatomical Indices Physiological Indices Combined Anatomical/ Physiological Score Artificial Intelligence Techniques base on Trauma Scoring Systems Abbreviated Injury
Scale (AIS) and (MAIS) Injury severity score
(ISS) and (NISS) Anatomic Profile (AP) Trauma mortality
prediction model (TMPM) International
Classification of Diseases-based ISS (ICISS)
Organ Injury Scales(OIS) Penetrating
Abdominal Trauma Index (PATI)
Glasgow coma scale(GCS) Paediatric Glasgow Coma Scale
(PGCS)
Revised Trauma Score(RTS) Trauma Score(TS)
Emergency Severity Index(ESI) Acute Physiology and Chronic Health
Evaluation(APACHE)
Rapid Acute Physiology score(RAMS) Rapid Emergency Medicine Score
(REMS)
Prognostic Index(PI) Sequential Organ Failure
Assessment Score (SOFA) Multiple Organ Dysfunction
syndrome (MODS)
Systemic Inflammatory Response Syndrome Score (SIRSS)
MULTIPLE ORGAN FAILURE (MOF) Circulation, Respiratory,
Abdominal/Thoracic, Motor and Speech Scale(CRAMS) Glasgow Coma Scale, Age, and
Systolic Blood Pressure (GAP) Logistic Organ Dysfunction
Score(LOD)
Simplified Acute Physiology Score(SAPS)
Trauma Score-Injury Severity Score Methodology (TRISS) The trauma audit and
research network ( TARN Ps14)
Harborview assessment for risk of mortality (HARM)
A Severity Characterization of Trauma (ASCOT) Drug-Rock Injury Severity
Score(DRISS) Trauma Index (TI) Pediatric Trauma Score
(PTS)
Neural Network(NN) Fuzzy Logic(FL) Genetic
Algorithm(GA) Expert System(ES) Artificial
Intelligent Virtual Reality (AIVR) Machine Learning
(ML) Deep learning
(DL)
2.2.1 Anatomical Systems
Abbreviated Injury Scale (AIS) is an anatomical trauma scoring system. It was
introduced in 1971 by the Association for the Advancement of Automotive
Medicine (AAAM). This association was founded in 1957 and is a professional
multidisciplinary organisation for reducing vehicle crash injuries.
AIS describes injuries in nine body parts, head, neck, face, thorax, spine,
abdomen, upper limbs, lower limbs, and external (Kim 2012). Maximum AIS
(MAIS) is used to express total severity. MAIS does not linearly increase and
decrease by varying likelihood of mortal. To provide solution for these
limitations, the injury severity score (ISS) was presented (Stevenson et al.
2001). ISS was introduced in 1974 to determine the overall injury assessed by
AIS. ISS is an ordinal scale and anatomically constructed that is between 1 and
10
ability to engage anatomic parts of injury in formulating an expectation of
outcomes (Chawda et al., 2004). However, it has some limitations that it could
expect less accurate in the case of multi-injuries in the same body region.
Another drawback of the ISS is that all injuries are given an equal AIS score
irrespective of body region where is injured. The last revision of the ISS is
known as the New Injury Severity Score (NISS). The NISS is computed as the
sum of squares of the three most significant (severe) AIS (1990 revision)
injuries and it has improved the forecast of survival and enhanced routine,
statistically, than the ISS (Stevenson et al. 2001). (Osler et al., 1997) NISS was
tested as modification of the ISS; it is the sum of the squares of the AIS scores
of a patient's three most severe injuries, irrespective of body parts.
Anatomic Profile (AP) trauma scoring system has some similarities to ISS,
however it has limitations (Champion 2002). These limitations are based on the
use of a one-dimensional score to represent the spectrum of injured body
regions and severities and from the ISS definition that excludes all but the most
serious injury in any body parts. Therefore, AP routines use four factors to
calculate injured patient: A, B, and C for severe injuries (AIS >= 3) which are
head and neck, thorax, and other defined body parts separately, and D defines
any region of body which is not serious injury. It combines the parts using the
taking the square root of the sum of the squares (Champion 2002)
√ 2-1
Likewise, Trauma Mortality Prediction Model (TMPM-ICD9) is the an
injury-severity assessment system that uses empirical valuation from ICD-9-CM codes
(Glance et al., 2009). TMPM-ICD9 is useful method for risk-adjustment model
once injuries are verified using ICD-9-CM coding. It probably to be used to
risk-adjust result assessment for trauma report cards at hospital (Glance el at.,
2009). It is also provided result that it expresses a probability of non-surviving
depends on the most five severe ICD-9-CM-coded injuries. Empiric scales of
injury severity for each of the trauma ICD-9-CM codes were assessed using a
regression-based method, and then used as the source for a new Trauma
Mortality Prediction Model (TMPM-ICD9). TMPM-ICD9 was compared with
11
findings showed TMPM-ICD9 demonstrates a greater model performance
(Glance el at. 2009).
ICISS is also an anatomical injury system that uses ICD-9 codes. It was
introduced in 1996 to address the limitations of the ISS (Chawda et al., 2004).
This method is termed the ICD-9 Injury Severity Score (ICISS) and uses
survival risk ratios (SRRs) calculated for each ICD-9 discharge diagnosis. SRRs
are derived by dividing the number of survivors in each ICD-9 code by the total
number of patients with the same ICD-9 code. The ICISS is calculated as the simple product of the SRRs for each of the patient’s injuries. The ICISS has
some advantages over the ISS because it permits all the injuries to contribute to
the prediction, and multi injuries are more accurately demonstrated. Moreover, it uses information about all the injuries, composed with the patient’s three severe
injuries. Nevertheless, it is hard to compare the performance of clinics (Chawda
et al.,2004). The routine of the ICISS seemed to be unstable because its
performance could be altered by the type of formula and SRRs used (Tohira et
al., 2012).
In 1987 Organ Injury Scaling (OIS) was introduced by the Committee of
American Association for the Surgery of Trauma (A.A.S.T.) (Moore el at., 1989).
This is used to devise injury severity scores for separate organs to enable
clinical research. OIS uses the body organs: spleen, liver and kidney. The
subsequent classification system is basically an anatomic description,
measured from 1 to 5, expressing the minimum to the greatest severe injury.
Penetrating Abdominal Trauma Index (PATI) was developed in 1981.This
method is used to predict trauma patients at risk of postoperative difficulties
(Chappuis et al., 1991). It also provides an effective way to examine and help
as a tool in the decision-making procedure once dealing penetrating abdominal
trauma. For instance, in this study there are 56 patients and 28 of them were
randomised into individually group. Data were concurrently composed and
difficulties and outcome recorded. The majority of cases in each group were
young men. The typical age for the primary repair group was 26 years (range,
17 to 58 years). There were 27 males and 1 female in the primary repair group
and 25 males and 3 Female in the diversion group and for the diversion group,
12
the injury, 2- resection of the injury with exteriorization of either exteriorization
and proximal segment or 3- debridement, if specified, and simple closure of
holes with formation of a loop or end stoma proximal to the injury). Primary
repair is demarcated as (1- debridement, if designated, with simple closure of
the holes or 2- resection of a segment of large bowel containing perforations
monitored by anastomosis). The small bowel was the additional organ injured
most routinely (Table 2-2). Injury number, involving colon injury, was similar in
both groups (Table 2-3).
Table 2-2 Associated Intra-abdominal injuries.
Table 2-3 Total number of organs injured.
Number Primary
Repair Diversion
1 2 3
2-3 19 19
>4 6 7
2.2.2 Physiological Indices
There are a number of physiological trauma scoring systems, e.g. Glasgow
Coma Scale (GCS). GCS was introduced in 1974 to standardise assessment of
level of consciousness (LOC). It is also relatively simple to apply and is used in
a variety of medical assessment cases. For instance it is used to determine the
urgency of care and for neurological examinations (Fani-Salek et al., 1999).
Children who are two years and younger, they are assessed by its revised
version called Paediatric Glasgow Coma Scale (PGCS). The main reason for
using PGCS instead of GCS is that many of the assessments for adult patients
Organs Primary Repair Diversion
Small bowel 15 21
Duodenum 7 4
Stomach 6 4
Liver 6 4
Major vascular 5 4
Kidney 4 3
Pancreas 2 2
Ureter 1 3
Diaphragm 2 -
Gallbladder 1 -
13
are not be suitable for children. The PGCS comprises three assessments:
verbal, eye and motor responses. Three values are considered individually as
well as their sum (Holmes et al., 2005).
Another physiological trauma assessment system is called Revised Trauma
Score (RTS). It incorporates the GCS, systolic blood pressure and respiratory
rate as shown in Table 2-4. This index is determined by adding up the results
from the values of the three components and multiplying them by their
corresponding weights (Champion et al. 1989).
Table 2-4 Revised trauma score.
Code Glasgow Coma Scale
Systolic Blood Pressure (mmHg)
Respiratory Rate
(Breaths per Minute)
4 13–15 >89 10–29
3 9–12 76–89 >29
2 6–8 50–75 6–9
1 4–5 1–49 1–5
0 3 - -
Another physiological method is Trauma Score (TS). It was introduced to alter
the Triage Index in order to use systolic blood pressure and respiratory rate and
the GCS to calculate the degree of coma. TS Score is between 1 (worst
prognosis) and 16 (best prognosis) and can be calculated by sum of scores
which are given to the component variables (Champion 2002).
Another technique is Emergency Severity Index (ESI) has applications to
provide a reliable evaluation of injury severity and likely prediction of patient
disposition (Tanabe et al., 2004). It uses a five-level algorithm this algorithm
uses respiratory rate (RR), heart rate (HR), pulse oximetry (SpO2),
temperature (T), and peak expiratory flow rate (PEFR) (Wuerz et al., 2001).
This mothed can provide clinically related stratification of patients into five
groups according to a range of urgency. This means that it depends on patient
case severity and supply that needs (Gilboy el al 2011).
Acute Physiology and Chronic Health Evaluation (APACHE) was implemented
to predict hospital mortality between critical adult patients (Zimmerman et al.,
2006).
Rapid Acute Physiology Score (RAPS) was developed and verified for practice
as a severity scale in serious care transports. RAPS is also an abbreviated
14
use only variables regularly available on all patients which are transported.
Therefore, it uses four parameters which are (respiratory rate, blood pressure,
pulse, and Glasgow Coma Scale). In terms of range, it is from 0 (normal) to 16
(worst) (Rhee et al., 1987). There is similar short form name called Rapid
Emergency Medicine Score (REMS). REMS is an abbreviated version of
APACHE II. It has earlier been specially calculated as a predictor of in-hospital
mortality for nonsurgical patients presenting to the ED. REMS is determined
that REMS has predictive accuracy comparable to the well-known but more
complicated APACHE II (Rhee et al., 1987).
The prognostic index(PI) was established in 1980 and it was derived to enable
complete separation of fatal and nonfatal cases and when consequently used in
a nine index cases and properly forecasted the outcome (Walter et al., 2001).
This method could reflect the ability of the prognostic index to distinguish
among patients at low and high risk of death.
The Emergency Severity Index (ESI) uses a reliable severity evaluation and
likely forecast patient disposition (Tanabe et al., 2004). It has five-level ESI
algorithm which was presented to triage nurses at two university hospital EDs,
and executed into training with reinforcement and adaptation management
plans. This method has it owns components that can enable it to predict the
resource consumption. ESI uses RR = respiratory rate; HR = heart rate; SpO2 =
pulse oximetry; T = temperature; PEFR = peak expiratory flow rate (Wuerz et
al., 2001) . This method can provide clinically related stratification of patients
into five groups according to a range of urgency. This means that it depends on
patient case severity and supply that needs.(Gilboy el al 2011).
Sequential Organ Failure Assessment (SOFA) was introduced by European
Society of Intensive Care and Emergency Medicine during a consensus
conference (Cabré et al .,2005). According to this conference, initially called the “sepsis-related” organ failure assessment, SOFA can be useful equally to all
ICU patients. Moreover, SOFA score is composed scores from six organ
systems, classified from 0 to 4 according to the degree of dysfunction/failure.
Organ systems also measured in the SOFA score are: respiratory (PO22/FIO2),
15
count), renal (diuresis and creatinine), liver (bilirubin) and neurological (Glasgow
Coma Score).But some of medical practitioners are not familiar with SOFA
score while decisions on limiting life support were made (Cabré et al., 2005).
Multiple Organ Dysfunction syndromes (MODS) is used to develop clinical
syndrome triggered by several motivations that it is the main reason of mortality
and morbidity in patients who admitted to intensive care units. It routines for cardiovascular assessment which is based on the so-called “pressure-adjusted heart rate” (PAR), defined as the product of the heart rate (HR) multiplied by the
ratio of the right atrial pressure (RAP) to the mean arterial pressure (MAP)
(Cabré et al .,2005).
Systemic Inflammatory Response Syndrome Score (SIRSS) is one of the
clinical expressions which deals with the action of difficult intrinsic mediators of
the severe stage reaction (Nyström 1998). This method can be triggered by
measurement of pancreatitis, trauma, infection, and surgery. Moreover, it can
also compromise the function of several organ systems causing in Multiple
Organ Dysfunction Syndrome (MODS). Therefore, the MODS and SIRSS are
classified expressions of the inflammation related to serious patient (Nyström et
al., 1998). In this study the SIRSS was expressed by two or more of the
following conditions: "temperature 38°C or 36°C; heart rate 90 beats/min;
respiratory rate 20 breaths/min or PaCO2 32 torr ( 4.3 kPa); WBC 12,000
cells/mm3, 4000 cells/mm3 or 10% immature (band) forms". But in finding, the
SIRSS for other signs as an example, the appearance of C-reactive protein are
better designated as the severe stage reaction. In addition, several patients with
SIRSS showed different degrees of organ dysfunction whereas some
developments to progress multiple organ failure.
Multiple organ failure (MOF) is influenced epidemic parts in several intensive
care units (ICU). It uses to predict non-surviving case in the surgical ICU (Deitch
et at. 1992). MOF score deals with four organs (lungs, kidneys, liver and heart)
are regularly measured for dysfunction and scored from 0 (no dysfunction) to 3
(severe dysfunction)(Zallen et al .,1999). This method was examined in sepsis
and the severity of bacterial sepsis and was assessed reflectively in 37
intra-abdominal-sepsis and 55 trauma patients with MOF. Finally, the severity of
16
sequence, severity, and mortality of organ failures. There is no difference was
initiated between groups in severity, sequence, or mortality of organ failures
(Goris et at. 1985).
Circulation, Respiratory, Abdominal-Thoracic, Motor and Speech Scale
(CRAMS). This method is commonly appropriate physiological trauma scoring.
CRAMS works based on five parameters (respiration, circulation, trauma to the trunk, speech and motor) on a 0–2 scale. A score of 0 shows severe injury or
absence of the factor; a score of it > 2 signify no deficit (Fani-Salek el at., 1999).
Therefore, the overall likely score ranges from 0 which for a corpse to 10 for an
uninjured patient. Including zero as the score for death which makes this
method is more effective than the GCS. Where even a corpse could take more
than 3 scales and when CRAMS score is <=8 that means critical trauma, while
a score of 9 or 10 designates mild trauma. It discriminates between mild and
critical trauma levels and it can be useful to avoid over-triage to trauma middles
and even though dependable for triage part. Nevertheless, it may not be
constantly validated on repeating scrutiny. Even though, reliable for triage part,
CRAMS is incomplete in its capability to predict the need for operation
(Fani-Salek el at., 1999).
Glasgow Coma Scale, Age, and Systolic Blood Pressure (GAP). GAP is one of
the trauma scoring systems that could be used to perfectly forecast in-hospital
mortality and it's also more practical than many other trauma scoring systems
those are used in the emergency department (Kondo et al., 2011). For example,
in this study, GAP was assessed based on the records of 13,463 trauma cases
in a derivation data set defined by using via logistic regression. Some scoring
systems that are Revised Trauma Score, Trauma and Injury Severity Score
were compared with GAP. The calculation of GAP scores included GCS score
that was from 3 to 50 points, patients age were less than 60 years (three points)
and SBP (> 120 mmHg, six points; 60 to 120 mmHg, four points). The
c-statistics is a measure of goodness of fit for binary outcomes in a logistic
regression model. In this study c-statistics uses for the GAP scores (0.965 for
short-term mortality and 0.933 for long-term mortality) were superior than or
17
existing instruments, its results show that the GAP scoring system reclassified
all cases but one in the correct direction (Kondo et al., 2011).
Logistic Organ Dysfunction Score (LOD) was developed to support an impartial
tool for measuring severity classifications for organ dysfunction in the ICU and
likelihood of mortality (Le Gall et al., 1996). In this study, LOD scores classified
from 1 to 3 points of organ dysfunction for 6 organ measures: hepatic,
hematologic, renal, cardiovascular, neurologic and pulmonary. This is from 1 to
5 LOD points allocated to the stages of severity (Timsit et al., 2002) .Its scores
were also affected in measuring severity during the first day in ICU.
Simplified Acute Physiology Score (SAPS) is one of trauma scoring systems it
is widely known in many hospitals (Le Gall et al., 1993). This technique uses for
universal severity of disease and outcome prediction .It assesses acute age,
pathophysiology, pre- and comorbidity, state at admission, and underlying
disease. The underlying disease classification has a self-determining role for
outcome of hospital dealing with severe patients (Schuster et al,. 1997). This
technique is initially point for future assessment of the productivity of intensive
care units (Le Gall et al., 1993).
2.2.3 Combined Anatomical and Physiological Score or Methods to Determine Probability of Survival
There were a number of proposed methods to determine probability of survival
(Ps). A number of trauma injury severity scoring systems were reported that are
intend to accurately and consistently quantify injuries by considering
measurable or observable status of the patient's medical conditions. The main
benefits of determining or scoring of Ps are (Fani-Salek et al., 1999):
Triage: This sets priorities to treat patients.
Prognostic evaluation: This enables predication and management of injury
outcomes.
Research and audit management: These compare patient groups on injury
outcomes and examine the effects of treatments.
Trauma and Injury Severity Score (TRISS) is a method that uses anatomical
18
injuries from blunt and penetrating mechanisms (Schluter 2011). It is estimated
by
2-2
, , ,
i AGE i RTS i ISS i
b RTS ISS
where i = 1 is for blunt mechanism and i=2 is for penetrating mechanism, i is a constant for mechanism i, AGE,i is the coefficient associated with AGE and
mechanism i, RTS,i is the coefficient associated with RTS and mechanism i,
i ISS,
and is the coefficient associated with ISS and mechanism i. RTS is
obtained by
GCS SBP
RR
RTSRR SBP GCS 2-3
where
RR is the coefficient associated with respiration rate (RR),
SBP is thecoefficient associated with systolic blood pressure (SBP), and
GCS is thecoefficient associated with GCS. TRISS however has a number of
shortcomings as explained in (Siritongtaworn et al., 2009). The parameter Age
Score =0 if age <55 years and 1 if age > 55 years. The coefficients b0 to b3 depend on the type of trauma as indicated in Table 2-5.
Table 2-5 The TRISS coefficients.
Coefficient Blunt Trauma or
Age < 15 years Penetrating Trauma
b0 -1.247 -0.6029
b1 0.9544 1.1430
b2 -0.0768 -0.1516
b3 -1.9052 -2.6676
TRISS has been criticised because of
It incorporates the problems associated with ISS.
19
It does not account for mix of patients and thus making comparisons between trauma centers difficult (Siritongtaworn et al., 2009).
In 2004 Trauma Audit and Research Network (TARN) (Trauma Audit and
Research Network 2017) proposed a Probability of Survival model called Ps04.
This model uses age, gender, Injury Severity Score (ISS) and Glasgow Coma
Score (GCS) and intubation. In 2014, Ps14 model was introduced by
incorporating Charlson Comorbidity Index (CCI) to the assess Pre-Existing
Medical Conditions (PMC). To predict probability of survival in Ps14, age,
gender, GCS and intubation and PMC parameters are required. It determines
the percentage of probability of survival by performing retrospective measure of
a new patient with same profile on TARN database. For example, if Ps = 53%,
then 53 out of every 100 people have profiles that survived and 47 people died
based on formula.
2-4
Where e=2.718282 and b is defined as the linear combination of the regression coefficients and the values of the corresponding patient’s characteristics (ISS,
GCS, modified CCI, age and gender).
Harborview Assessment for Risk of Mortality (HARM) is an effective tool for a
predictive likelihood of in-hospital mortality for trauma patients. This technique
has consistently outperformed both ICD- 9-CM Injury Severity Score (ICISS)
and the Trauma and Injury Severity Score (TRISS) methods (Al west et al.,
2000). It is also valuable for both calibration and discrimination using
information that is readily accessible from hospital discharge coding, and
without requiring ED physiologic records (Al west et al., 2000).
Severity Characterisation of Trauma (ASCOT) was introduced in 1990
(Champion et al., 2002). It is used to improve Trauma Score-Injury Severity
Score (TRISS). It relates emergency department admission parameters of GCS,
systolic blood pressure, respiratory rate, age of patient, and AIS-85 anatomic
20
The Drug-Rock Injury Severity Score (DRISS) was introduced by emergency
physicians and illustrates exactly how trauma severity scores can be advanced
or adapted for new, specific situations (Fani-Salek et al., 1999). The DRISS is
also one of a new combined trauma scoring system which has developed
particularly to be more accurately and powerfully triage injured patients at rock
concerts. The method efficiently compares medical resource which use unlike
measures. It uses values for intoxicants as a result of the high rate of
drug/alcohol practise at rock concerts. While not yet validated, DRISS can be
beneficial for categorising who are injured into the groups of those needing
more care, those who are carefully cured and released (Fani-Salek et al., 1999).
The Trauma Index (IT) is usually used to rapidly assess patients with severe
trauma. It has assignment for injury severity which are (minimal injury= 1,
moderate injury= 3 or 4 and severe injury= 6) and parameters are based on
(regions, type of injury, cardiovascular status, central nervous system status
and respiratory status). Trauma index = (points for region + points for type of
injury + points for cardiovascular status+ points for CNS (centre nervous
system) status + points for respiratory status). Interpretation minimum score
with trauma: 2, maximum score: 30 and scores >7 need admission to the
hospital. The method has limitation as the trauma index is not intended for burn
patients (Medal Military Medicine 2010).
A Paediatric Trauma Score (PTS) is introduced as a combined method of a
triage means and PTS was developed as a way of helping rapid precise
assessment of the children who is injured in a routine that it can protect
inclusive initial assessment. It is also a scoring system that it assesses based
on six common determinants of clinical condition in the injured child. Each of the
six factors is assigned a scoring containment that -1 (major or immediate
life-threatening injury), + 1 (minor or potentially major injury) or finally +2 (minimal
or no injury). The arrangement of this method uses manner well-matched with
typical advanced trauma life support procedure. Suitable diagnoses of multiply
injured child not only requires precise initial assessment, but also a relies on the
variances in paediatric physiology affecting potential morbidity (Tepas et al.,
21
2.2.4 Artificial Intelligence Techniques based on Trauma Scoring Systems
Artificial Intelligence techniques such as fuzzy logic (FL), neural networks (NN),
expert systems and genetic algorithm (GA) were successfully used to solve
several medical problems.
Fuzzy logic (FL) is a computational model that for processing information in way
that it is similar to human communication and intellectual processes (Allen and
Smith 2001; Güler and Barisci 2002 ; Elkfafi et al., 1997). It has been used in
defining and forecasting some cardiac diseases and depth of anaesthesia.
FL was used in a new diagnostic system for classifying the severity of 26
traumatic brain injuries. Trauma, Glasgow coma scores and
electroencephalography were used for assessing the system (Güler et al.,
2008). They found a reasonable agreement between the results of neurologists
and systems outputs for normal, serious and maximum electroencephalogram
data. Therefore, FL can be a potential tool for determining the severity of
trauma (Güler et al., 2008).
Artificial neural networks (neural computing) are highly simplified models of
human brain. They are generally complex, nonlinear and parallel structures that
can learn to perform tasks that are difficult to solve through conventional
sequential programming (like C) or by mathematical formulae (Haykin 2009).
Artificial Neural Network (ANN) was also used to compare with standard
outcome predictors to determine physiological indices and probability of survival
(Pearl et al., 2008). As result of this ANN was shown to be able to predict
mortality better tha