Volatility estimation for Bitcoin: A comparison of GARCH
models
KATSIAMPA, Paraskevi <http://orcid.org/0000-0003-0477-6503>
Available from Sheffield Hallam University Research Archive (SHURA) at:
http://shura.shu.ac.uk/16526/
This document is the author deposited version. You are advised to consult the publisher's version if you wish to cite from it.
Published version
KATSIAMPA, Paraskevi (2017). Volatility estimation for Bitcoin: A comparison of GARCH models. Economics Letters, 158, 3-6.
Copyright and re-use policy
See http://shura.shu.ac.uk/information.html
Volatility estimation for Bitcoin: A comparison of GARCH models
Paraskevi Katsiampa1
Sheffield Business School, Sheffield Hallam University, Sheffield, S1 1WB, UK
Abstract:
Bitcoin is undoubtedly the most popular cryptocurrency. Earlier studies have found that Bitcoin is
mainly used as an asset, and hence analysing its volatility is of great importance. In this article, we
explore the optimal conditional heteroskedasticity model with regards to goodness-of-fit to the data. It
is found that the best conditional heteroskedasticity model is the AR-CGARCH model, highlighting
the significance of including both a short-run and a long-run component of the conditional variance.
Keywords: Bitcoin, Cryptocurrency, GARCH, Volatility
JEL classification: C22, C5, G1
1. Introduction
The analysis of Bitcoin has recently received much attention. This can be attributed to its innovative features, simplicity, transparency and its increasing popularity (Urquhart 2016), while since its introduction it has posed great challenges and opportunities for policy makers, economists, entrepreneurs, and consumers (Dyhrberg 2016b). Bitcoin is probably the most successful – and probably most controversial – virtual currency scheme to date (ECB 2012, p. 21), representing about 66.8% of the total estimated cryptocurrency capitalisation at present.
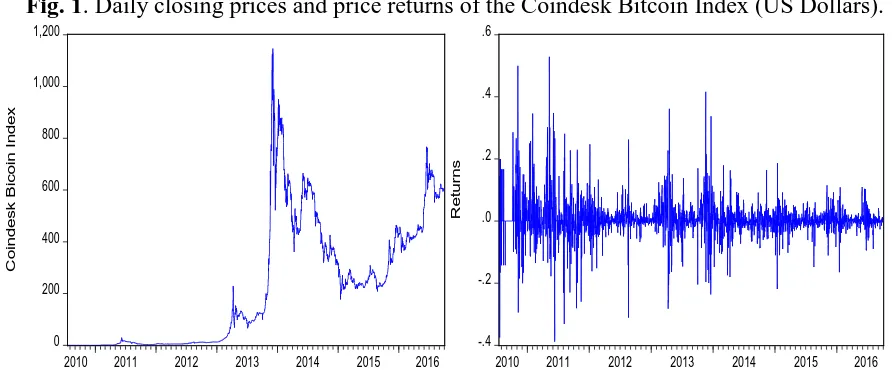
However, recent fluctuations in Bitcoin prices (see Figure 1) have resulted in periods of high volatility. In fact, as Bitcoin is mainly used as an asset rather than a currency (Glaser et al. 2014; Baek and Elbeck 2015; Dyhrberg 2016a), the Bitcoin market is currently highly speculative, and more volatile and susceptible to speculative bubbles than other currencies (Grinberg 2011; Cheah and Fry 2015). Bitcoin has therefore a place in the financial markets and in portfolio management (Dyhrberg 2016a), and examining its volatility is crucial.
Paraskevi Katsiampa
Moreover, the presence of long memory and persistent volatility (Bariviera et al. 2017) justifies the application of GARCH-type models.
Earlier studies have employed various GARCH-type models, such as the linear GARCH (Glaser et al. 2014; Gronwald 2014), the Threshold GARCH (TGARCH) (Dyhrberg 2016b; Bouoiyour and Selmi 2015, 2016; Bouri et al. 2017), the Exponential GARCH (EGARCH) (Dyhrberg 2016a; Bouoiyour and Selmi 2015, 2016), and the Component with Multiple Threshold-GARCH (CMT-GARCH) (Bouoiyour and Selmi 2015, 2016). However, as most of the previous studies of the Bitcoin price volatility have used a single conditional heteroskedasticity model, a question that remains unanswered is which conditional heteroskedasticity model can better explain the Bitcoin data. Only the studies of Bouoiyour and Selmi (2015, 2016) considered comparing some of the GARCH-type models. Nevertheless, their sample was split into sub-periods without examining volatility estimation throughout the whole interval since the introduction of Bitcoin. Hence, the aim of this study is to investigate which conditional heteroskedasticity model can describe the Bitcoin price volatility better over the whole period since its introduction.
The paper is organised as follows. Section 2 discusses the data and methodology employed. Section 3 discusses empirical results. Section 4 concludes.
2. Data and methodology
The data used are the daily closing prices for the Bitcoin Coindesk Index from 18th July 2010 (as the earliest date available) to 1st October 2016, which corresponds to a total of 2267 observations. The data are publicly available online at http://www.coindesk.com/price.
The returns are calculated by taking the natural logarithm of the ratio of two consecutive prices. Figure 1 illustrates both the Bitcoin prices and price returns.
The models used in this research consist of an Autoregressive model for the conditional mean and a first-order GARCH-type model for the conditional variance2, as follows
2
t s
i i t i
t c r u
r = +
∑
+=1 −
φ ,
t t t hz
u = , zt ~i.i.d.(0,1),
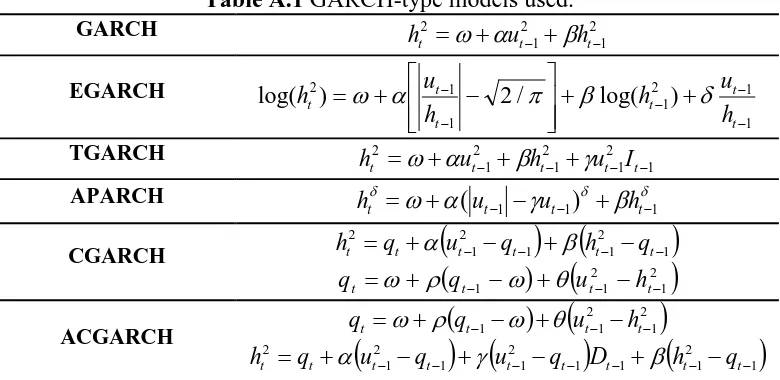
where rt is the Bitcoin price return on day t, ut is the error term, zt is a white noise process, and ht is the conditional standard deviation. Table A.1 (Appendices) presents the different GARCH-type models used in this research, namely GARCH, EGARCH, TGARCH, Asymmetric Power ARCH (APARCH), Component GARCH (CGARCH) and Asymmetric Component GARCH (ACGARCH).
The optimal model is chosen according to three information criteria, namely Akaike (AIC), Bayesian (BIC) and Hannan-Quinn (HQ), all of which consider both how good the fitting of the model is and the number of parameters in the model, rewarding a better fitting and penalising an increased number of parameters for given data sets. The selected model is the one with the minimum criteria values.
Fig. 1. Daily closing prices and price returns of the Coindesk Bitcoin Index (US Dollars).
3. Empirical results
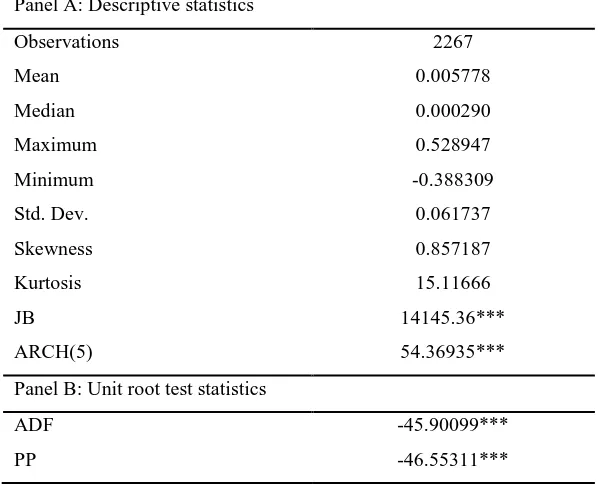
Table 1 presents the summary statistics for the daily closing returns of the Bitcoin price index. As can be easily seen, the daily average return is equal to 0.5778% with a standard deviation of 0.0617. The returns are positively skewed, while the excess kurtosis suggests
0 200 400 600 800 1,000 1,200
2010 2011 2012 2013 2014 2015 2016
C
o
in
d
e
s
k
B
ic
o
in
I
n
d
e
x
-.4 -.2 .0 .2 .4 .6
2010 2011 2012 2013 2014 2015 2016
R
e
tu
rn
[image:4.595.70.516.448.643.2]leptokurtic behaviour. The value of the Jarque-Bera (JB) statistic indicates the departure from normality, while the value of the ARCH(5) test for conditional heteroskedasticity confirms that there exist ARCH effects in the returns of the Bitcoin price index, suggesting that the Autoregressive model for the conditional mean needs to be expanded to include an Autoregressive Conditional Heteroskedasticity model for the conditional variance. For a more detailed investigation of the statistical properties of the Bitcoin market, see Bariviera et al. (2017). In addition, according to the results of both the Augmented Dickey-Fuller (ADF) and Phillips-Perron (PP) unit-root tests we fail to accept the null hypothesis of a unit root for the returns, and, hence, stationarity is guaranteed.
Table 1. Descriptive statistics and unit roots tests. Panel A: Descriptive statistics
Observations 2267
Mean 0.005778
Median 0.000290
Maximum 0.528947
Minimum -0.388309
Std. Dev. 0.061737
Skewness 0.857187
Kurtosis 15.11666
JB 14145.36***
ARCH(5) 54.36935***
Panel B: Unit root test statistics
ADF -45.90099***
PP -46.55311***
Note: *** indicates the rejection of the null hypotheses at the 1% level.
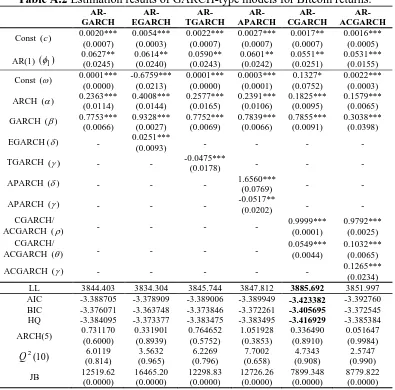
Table A.2 (Appendices) shows the estimation results of the GARCH-type models. It can be noticed that the log-likelihood value is maximised under the AR(1)-CGARCH(1,1) model. Interestingly, all the three information criteria also select the AR(1)-CGARCH(1,1) model. Moreover, all the parameter estimates are statistically significant for the AR(1)-CGARCH(1,1) model, while the results of the ARCH(5) and 2(10)
residuals of the AR(1)-CGARCH(1,1) model still depart from normality, the value of the Jarque-Bera test has considerably decreased compared with the corresponding value for the returns.
All in all, the AR-CGARCH model appears to be an appropriate tool to describe the volatility of the Bitcoin price returns. This finding seems to be consistent with the study of Bouoiyour and Selmi (2016) which showed that the optimal model for the period between December 2010 and December 2014 is the CMT-GARCH model, which also consists of both a transitory and a permanent component.
4. Conclusion
Cryptocurrencies are a globally spreading phenomenon that is frequently and also prominently addressed by media, venture capitalists, financial and governmental institutions alike (Glaser et al. 2014). The Bitcoin market in particular has recently seen huge growth. As Bitcoin is mainly used for investment purposes, examining its volatility is of high importance. This paper investigated the ability of several competing GARCH-type models to explain the Bitcoin price volatility. We found evidence that the optimal model in terms of goodness-of-fit to the data is the AR-CGARCH, a result which suggests the importance of having both a short-run and a long-run component of conditional variance.
Bitcoin is different from any other asset on the financial market and thereby creates new possibilities for stakeholders with regards to risk management, portfolio analysis and consumer sentiment analysis (Dyhrberg 2016b). Hence, it can be a useful tool for portfolio and risk management, and our results can help investors make more informed decisions.
Acknowledgements
The author gratefully acknowledges helpful suggestions from an anonymous referee.
References
Bariviera, A. F., Basgall, M. J., Hasperué, W., & Naiouf, M. (2017). Some stylized facts of the Bitcoin market. Physica A: Statistical Mechanics and its Applications,484, 82-90.
Bouoiyour, J., & Selmi, R. (2015). Bitcoin price: Is it really that new round of volatility can be on way? (No. 65580). University Library of Munich, Germany.
Bouoiyour, J., & Selmi, R. (2016). Bitcoin: A beginning of a new phase?. Economics Bulletin, 36(3), 1430-1440.
Bouri, E., Azzi, G., & Dyhrberg, A. H. (2017). On the return-volatility relationship in the Bitcoin market around the price crash of 2013. Economics: The Open-Access, Open-Assessment E-Journal, 11 (2), 1-16.
Cheah, E. T., & Fry, J. (2015). Speculative bubbles in Bitcoin markets? An empirical investigation into the fundamental value of Bitcoin. Economics Letters, 130, 32-36.
Dyhrberg, A. H. (2016a). Bitcoin, gold and the dollar–A GARCH volatility analysis. Finance Research Letters, 16, 85-92.
Dyhrberg, A. H. (2016b). Hedging capabilities of bitcoin. Is it the virtual gold?. Finance Research Letters, 16, 139-144.
European Central Bank (ECB) (2012), Virtual Currency Schemes, http://www.ecb.int/pub/pdf/other/virtualcurrencyschemes201210en.pdf
Glaser, F., Haferhorn, M., Weber, M. C., Zimmarmann, K., & Siering, M. (2014). Bitcoin – Asset or currency? Revealing users’ hidden intentions. ECIS 2014 (Tel Aviv).
Grinberg, R. (2011). Bitcoin: An innovative alternative digital currency. Hastings Science & Technology Law Journal, 4, 160-211.
Gronwald, M. (2014). The Economics of Bitcoins-Market characteristics and price jumps (No. 5121). CESifo Group Munich.
Urquhart, A. (2016). The inefficiency of Bitcoin. Economics Letters, 148, 80-82.
[image:7.595.103.493.575.765.2]Appendices
Table A.1 GARCH-type models used.
GARCH 2
1 2 1 2 − − + +
= t t
t u h
h ω α β
EGARCH 1 1 2 1 1 1 2 ) log( / 2 ) log( − − − − − + + − + = t t t t t t h u h h u
h ω α π β δ
TGARCH 1 2 1 2 1 2 1 2 − − − − + + +
= t t t t
t u h u I
h ω α β γ
APARCH δ ω α γ δ β δ
1 1
1 )
( − − − + −
+
= t t t
t u u h
h
CGARCH
(
) (
1)
2 1 1 2 1 2 − − − − − + − +
= t t t t t
t q u q h q
h α β
(
)
(
2)
1 2
1
1 − −
− − + −
+
= t t t
t q u h
q ω ρ ω q
ACGARCH
(
)
(
)
2 1 2
1
1 − −
− − + −
+
= t t t
t q u h
q ω ρ ω q
(
) (
)
(
1)
2 1 1 1 2 1 1 2 1 2 − − − − − − − − + − + − +
= t t t t t t t t
t q u q u q D h q
Table A.2 Estimation results of GARCH-type models for Bitcoin returns. AR-GARCH AR-EGARCH AR-TGARCH AR-APARCH AR-CGARCH AR-ACGARCH
Const (c ) 0.0020***
(0.0007) 0.0054*** (0.0003) 0.0022*** (0.0007) 0.0027*** (0.0007) 0.0017** (0.0007) 0.0016*** (0.0005)
AR(1) (φ1) 0.0627** (0.0245) 0.0614** (0.0240) 0.0590** (0.0243) 0.0601** (0.0242) 0.0551** (0.0251) 0.0531*** (0.0155)
Const (ω) 0.0001***
(0.0000) -0.6759*** (0.0213) 0.0001*** (0.0000) 0.0003*** (0.0001) 0.1327* (0.0752) 0.0022*** (0.0003)
ARCH (α) 0.2363***
(0.0114) 0.4008*** (0.0144) 0.2577*** (0.0165) 0.2391*** (0.0106) 0.1825*** (0.0095) 0.1579*** (0.0065)
GARCH (β) 0.7753***
(0.0066) 0.9328*** (0.0027) 0.7752*** (0.0069) 0.7839*** (0.0066) 0.7855*** (0.0091) 0.3038*** (0.0398)
EGARCH(δ) - 0.0251***
(0.0093) - - - -
TGARCH (γ) - - -0.0475***
(0.0178) - - -
APARCH (δ) - - - 1.6560***
(0.0769) - -
APARCH (γ) - - - -0.0517**
(0.0202) - -
CGARCH/
ACGARCH (ρ) - - - -
0.9999*** (0.0001)
0.9792*** (0.0025) CGARCH/
ACGARCH (q) - - - -
0.0549*** (0.0044)
0.1032*** (0.0065)
ACGARCH (γ) - - - 0.1265***
(0.0234)
LL 3844.403 3834.304 3845.744 3847.812 3885.692 3851.997
AIC -3.388705 -3.378909 -3.389006 -3.389949 -3.423382 -3.392760
BIC -3.376071 -3.363748 -3.373846 -3.372261 -3.405695 -3.372545
HQ -3.384095 -3.373377 -3.383475 -3.383495 -3.416929 -3.385384
ARCH(5) 0.731170
(0.6000) 0.331901 (0.8939) 0.764652 (0.5752) 1.051928 (0.3853) 0.336490 (0.8910) 0.051647 (0.9984) ) 10 ( 2
Q (0.814) 6.0119 (0.965) 3.5632 (0.796) 6.2269 (0.658) 7.7002 (0.908) 4.7343 (0.990) 2.5747
JB 12519.62
(0.0000) 16465.20 (0.0000) 12298.83 (0.0000) 12726.26 (0.0000) 7899.348 (0.0000) 8779.822 (0.0000)
Note: Standard errors of estimates are reported in parentheses. The p-values associated with the statistical