The influence of patellar tendon and muscle-tendon unit
stiffness on quadriceps explosive strength in man
MASSEY, Garry J., BALSHAW, Thomas G., MADEN-WILKINSON, Tom
<http://orcid.org/0000-0002-6191-045X>, TILLIN, Neale A. and FOLLAND,
Jonathan P.
Available from Sheffield Hallam University Research Archive (SHURA) at:
http://shura.shu.ac.uk/16030/
This document is the author deposited version. You are advised to consult the
publisher's version if you wish to cite from it.
Published version
MASSEY, Garry J., BALSHAW, Thomas G., MADEN-WILKINSON, Tom, TILLIN,
Neale A. and FOLLAND, Jonathan P. (2017). The influence of patellar tendon and
muscle-tendon unit stiffness on quadriceps explosive strength in man. Experimental
Physiology, 102 (4), 448-461.
Copyright and re-use policy
See http://shura.shu.ac.uk/information.html
Experimental Physiology
https://ep.msubmit.net
EP-RP-2016-086190R1
Title:
The influence of patellar tendon and muscle-tendon unit stiffness on
quadriceps explosive strength in man
Authors:
Garry Massey
Thomas Balshaw
Thomas Maden-Wilkinson
Neale Anthony Tillin
Jonathon Folland
Author Conflict:
No competing interests declared
Running Title:
rate of torque development and tissue stiffness
Abstract:
The influence of musculotendinous tissue stiffness on contractile rate of
torque development (RTD) remains opaque. This study examined the relationships
between both patellar tendon (PT) and vastus lateralis (VL) muscle-tendon unit
(MTU) stiffness, and voluntary and evoked knee extension RTD. Fifty-two healthy
untrained males completed duplicate laboratory ses-sions. Absolute and relative RTD
was measured at 50 Nm/25%MVT increments from onset and sequentially during
explosive voluntary and evoked octet (supramaximal stimulation: [8 pulses at
300Hz]) isometric contractions. Isometric maximum voluntary torque (MVT) was also
assessed. PT and MTU stiffness were derived from simultaneous force and
ultrasound recordings of the PT and VL aponeurosis during constant RTD ramp
contractions. Absolute and relative (to MVT and resting tissue length) stiffness (k)
was measured over identical torque increments as RTD. Pearson's correlations tested
equivalent voluntary or evoked RTD (r=0.020.255, P=0.069-0.891). Absolute MTU k
was unrelated to voluntary or evoked RTD (r{less than or equal to}0.191, P{greater
than or equal to}0.184), however some measures of relative MTU k were related to
relative voluntary/evoked RTD (e.g. RTD25-50%MVT r=0.374/0.353, P=0.007/0.014).
In conclusion, relative MTU k explained a small proportion of the variance in relative
voluntary and evoked RTD (both {less than or equal to}19%), despite no association
of absolute MTU k or absolute/relative PT k with equivalent RTD measures.
Therefore the muscle-aponeurosis component, but not free tendon was associated
with rela-tive RTD, although it seems an overriding influence of MVT negated any
relationship of ab-solute MTU k and absolute RTD.
New Findings:
What is the central question of this study? • Do tendon and/or
muscle-tendon unit stiffness influence rate of torque development. What is the main
finding and its importance? • Under our experimental conditions, some measures of
relative (to maximum voluntary torque and tissue length) muscle-tendon unit
stiffness had small correlations to volun-tary/evoked rate of torque development
over matching torque increments. However, abso-lute and relative tendon stiffness
were unrelated to voluntary and evoked rate of torque development. Therefore, the
muscle-aponeurosis, but not free-tendon influences relative rate of torque
development. Other factors more strongly determine rate of torque devel-opment
than tissue
Dual Publication:
No
The influence of patellar tendon and muscle-tendon unit stiffness on quadriceps explosive strength in man
Garry J. Massey1,2, Thomas G. Balshaw1,2, Thomas M. Maden-Wilkinson2, Neale A.Tillin3,
and Jonathan P. Folland1,2
1Arthritis Research UK Centre for Sport, Exercise and Osteoarthritis, Loughborough
University, Leicestershire, UK.
2School of Sport, Exercise, and Health Sciences, Loughborough University, Leicestershire,
UK
3Department of Life Sciences, University of Roehampton, London, UK.
Corresponding author:
Garry J. Massey, School of Sport, Exercise, and Health Sciences, Loughborough University, Ashby Road, Leicestershire, LE11 3TU, UK.
E-mail: [email protected]. Telephone: +44 (0) 1509 226302
Running Title: rate of torque development and tissue stiffness
Key Words: rate of torque development, muscle-tendon unit stiffness, quadriceps Subject Area: Muscle
Total Words: 6259 References: 40
New Findings (limit 100 words)
What is the central question of this study?
• Do tendon and/or muscle-tendon unit stiffness influence rate of torque development.
What is the main finding and its importance?
ABSTRACT
The influence of musculotendinous tissue stiffness on contractile rate of torque development (RTD) remains opaque. This study examined the relationships between both patellar tendon (PT) and vastus lateralis (VL) muscle-tendon unit (MTU) stiffness, and voluntary and evoked knee extension RTD. Fifty-two healthy untrained males completed duplicate laboratory ses-sions. Absolute and relative RTD was measured at 50 Nm/25%MVT increments from onset and sequentially during explosive voluntary and evoked octet (supramaximal stimulation: [8 pulses at 300Hz]) isometric contractions. Isometric maximum voluntary torque (MVT) was also assessed. PT and MTU stiffness were derived from simultaneous force and ultrasound recordings of the PT and VL aponeurosis during constant RTD ramp contractions. Absolute and relative (to MVT and resting tissue length) stiffness (k) was measured over identical torque increments as RTD. Pearson’s correlations tested relationships between stiffness and RTD measurements over matching absolute/relative torque increments. Absolute and relative PT k was unrelated to equivalent voluntary or evoked RTD (r=0.020.255, P=0.069-0.891). Absolute MTU k was unrelated to voluntary or evoked RTD (r≤0.191, P≥0.184), however some measures of relative MTU k were related to relative voluntary/evoked RTD (e.g. RTD25-50%MVT r=0.374/0.353, P=0.007/0.014). In conclusion, relative MTU k explained a
INTRODUCTION
Explosive strength is the ability to increase torque from low or resting levels as quickly as possible (Maffiuletti et al. 2016). It is commonly examined under isometric conditions and expressed as the rate of torque development (RTD) derived from the rising phase (i.e. slope) of the contractile torque-time curve. Explosive strength is considered important in situations where the time to develop torque is limited: for instance in athletic activities such as sprinting and jumping (Tillin et al. 2013a); and in injury-related situations such as maintaining balance (Izquierdo et al. 1999, Robinovitch et al. 2002) or stabilizing joints (e.g. anterior cruciate lig-ament tears [ACL] in ≤50ms: Krosshaug et al. 2007; Koga et al. 2010) following mechanical perturbation. Further, RTD deficits have a deleterious impact on physical function in muscu-loskeletal patients (e.g. osteoarthritis: Maffiuletti et al. 2010; Winters & Rudolph, 2014). De-veloping a greater understanding of the determinants of RTD could therefore have potentially widespread functional and clinical implications.
During isometric contractions, the rate of skeletal muscle contractile force production is slowed by the necessity of the muscle to shorten in order to stretch the elastic components that transmit muscle force (Hill, 1951; Edman & Josephson, 2007). The mechanical stiffness (resistance to elongation) of the muscle-tendon unit (MTU) and particularly its tendinous tis-sue components (external ‘free’ tendon and aponeurosis) are therefore widely hypothesised to influence in vivo RTD (Wilson et al. 1994; Kubo et al. 2001; Reeves et al. 2003). Stiffer tis-sues are thought to provide greater mechanical resistance that can constrain muscle shorten-ing durshorten-ing the initial stages of contraction thereby permittshorten-ing muscle fibers to operate in the higher force region of the force-velocity relationship (Wilson et al. 1994). Moreover, the force transmission time of stiffer tissues is theoretically shorter (Waugh et al. 2013) and thus stiffer tissues may exert a substantial influence on explosive strength. In contrast, tissue elon-gation during the rising torque-time curve maybe sufficiently negligible and the duration of force transmission through connective tissues of such brevity (Nordez et al. 2009; DeWall et al. 2014), that the inter-individual differences in tendon/MTU stiffness could be practically irrelevant to the inter-individual variation in RTD.
al. 2013; Hannah & Folland, 2015), and a recent review highlighted the need for more rigor-ous investigations (Maffiuletti et al. 2016). Studies of musculotendinrigor-ous tissue stiffness are mired by methodological shortcomings (Seynnes et al. 2015). In particular, the loading-rate sensitivity of stiffness measurements (i.e. faster rate yields greater stiffness: Lieber et al. 2000; Pearson et al. 2007; Theis et al. 2012; Kösters et al. 2014) necessitates a constant RTD during the ramp contractions used to measure stiffness. Nonetheless previous studies have invariably standardised contraction duration (Bojsen-Møller et al. 2005; Wang et al. 2012; Waugh et al. 2013; Hannah & Folland, 2015), which leads to different loading rates according to each in-dividual’s maximum voluntary torque (MVT) and may bias stiffness measurements to stronger individuals contracting at higher loading rates (Bojsen-Møller et al. 2005; Wang et al. 2012; Waugh et al. 2013; Hannah & Folland, 2015). This may explain why the relationship of MTU stiffness and explosive strength has been found to be dependent on the influence of MVT on both variables, with no independent relationship of RTD and MTU stiffness (Han-nah & Folland, 2015). However the relationship between constant loading rate measurements of stiffness, either MTU or tendon, and RTD has not been investigated.
Any influence of tissue stiffness on explosive strength might be expected to be more pro-nounced for evoked contractions that drive the muscle at its maximum possible RTD (Deu-tekom et al. 2000; de Ruiter et al. 2004; Folland et al. 2014) and depend entirely on the char-acteristics of the MTU rather than the voluntary nervous system. The influence of tendon stiffness on evoked RTD has not been investigated and only Hannah & Folland (2015) have examined the relationship between MTU stiffness and evoked explosive strength, finding a stronger correlation for evoked than voluntary RTD.
The present study aimed to comprehensively examine the relationship between both tendon and MTU stiffness, with voluntary and evoked RTD measurements of explosive strength. All relationships between stiffness and RTD variables were examined over the same torque in-crement for both variables and in a large cohort of healthy young men, with duplicate meas-urement sessions that assessed stiffness with constant loading rate measmeas-urements. In addition to evaluating the relationship of absolute measures of stiffness and RTD, the association of relative measures was examined to remove any influence of maximum strength.
METHODS Ethical Approval
The experimental testing procedures were explained to each participant and all participants provided written informed consent before their involvement in this study, which was ap-proved by the Loughborough University Ethical advisory committee, and was conducted in accordance with the principles of the Declaration of Helsinki.
Participants
Fifty-two young men (age 25 ± 2 years, height 176 ± 7 cm, weight 72 ± 9 kg) who were healthy, free from musculoskeletal injury, and recreationally active (2160 ± 1309 MET minutes per week, International Physical Activity Questionnaire short format), but not in-volved in any form of systematic training in the prior 18 months were included in this study.
Experimental Design
the knee extensors of the dominant (preferred kicking) leg in the following order: maximum voluntary (MVCs) and explosive voluntary contractions, electrically evoked octet contrac-tions (second measurement session only) and voluntary ramp contraccontrac-tions. Finally, knee flexor MVCs were also completed. Knee joint torque was recorded throughout contractions, and knee flexor surface electromyography (EMG) was recorded during knee flexor MVCs and knee extensor ramp contractions (to enable correction of knee extensor torque for antag-onist activation). MVT was determined from MVCs, while voluntary and evoked RTD meas-urements of explosive strength were determined from explosive voluntary and evoked octet contractions, respectively. Ramp contractions were performed to permit tissue stiffness measurements from simultaneous torque and elongation, via ultrasound imaging, recordings. Measurement sessions with each individual were performed at a consistent time of the day, and all sessions started between 12:00-19:00 hours. Participants were instructed not to partic-ipate in strenuous physical activity or consume alcohol for 36 hours, and refrain from caf-feine consumption for 6 hours, before measurement sessions. On a separate occasion, sagittal plane MRI images of the knee joint were acquired to measure patellar tendon (PT) moment arm in order to convert external torques to tendon force.
Torque Measurement
Participants were positioned in an isometric strength-testing chair with knee and hip angles of 115° and 126° (180° = full extension), respectively. Adjustable straps were tightly fastened across the pelvis and shoulders to prevent extraneous movement. An ankle strap (35 mm width reinforced canvas webbing) was placed ~15% of tibial length (distance from lateral malleolus to knee joint space) above the medial malleolus, and positioned perpendicular to the tibia and in series with a calibrated S-Beam strain gauge (Force Logic, Berkshire, UK). The analogue force signal was amplified (x370; A50 amplifier, Force Logic UK) and sam-pled at 2,000 Hz using an A/D converter (Micro 1401; CED, Cambridge, UK) and recorded with Spike 2 computer software (CED). In offline analysis, force signals were low-pass fil-tered at 500 Hz using a fourth order zero-lag Butterworth filter, gravity corrected by subtract-ing baseline force, and multiplied by lever length, the distance from the knee joint space to the center of the ankle strap, to calculate torque.
Knee Flexor Electromyography (EMG)
knee extensor ramp contractions. Following preparation of the skin (shaving, abrading and cleansing with alcohol) single differential Trigno standard EMG sensors (1 cm inter-electrode distance; Delsys Inc, Boston, MA) were attached over each muscle using adhesive interfaces. Sensors were positioned parallel to the presumed frontal plane orientation of the underlying muscle fibers at 45% of thigh length (distance from the greater trochanter to the lateral knee joint space) measured from the popliteal crease. EMG signals were amplified at source (x300; 20-450 Hz bandwidth) before further amplification (overall effective gain x909) and sampled at 2000 Hz via the same A/D converter and computer software as the force signal, to enable data synchronization. In offline analysis, EMG signals were corrected for the 48 ms delay inherent to the Trigno EMG system.
Knee Extension and Flexion Maximum Voluntary Contractions
Following a brief warm-up (3 s contractions at 50% [x3], 75% [x3] and 90% [x1] of per-ceived maximum), participants performed 3-4 MVCs and were instructed to either ‘push as hard as possible’ (knee extension) or ‘pull as hard as possible’ (knee flexion) for 3-5 s and rest ≥ 30 s. A horizontal cursor indicating the greatest torque obtained within the session was displayed for biofeedback and verbal encouragement was provided during all MVCs. The highest instantaneous torque recorded during any MVC was defined as MVT. During knee flexor MVCs EMG amplitude was calculated as the root mean square (RMS) of the filtered EMG signal of the BF and ST over a 500 ms epoch at knee flexion MVT (250 ms either side) and averaged across the two muscles to give EMGMAX.
Explosive Voluntary Contractions
pre-tension, change in baseline force <0.34 Nm in the preceding 300 ms) were analysed in detail. Contraction torque onset was defined as the last trough before the torque signal per-manently deflected away from the envelope of the baseline noise; identified via manual in-spection using a systematic standard method by the same trained investigator, in accordance with previously published methods (Tillin et al. 2010). Manual onset detection is considered to provide greater accuracy and reliability than an automatic approach (Tillin et al. 2013b). The torque signal was initially viewed with y and x-axis scales of 0.68 Nm and 300 ms re-spectively and a vertical cursor placed on torque onset. Accurate placement of the cursor was verified by viewing the signal with a higher resolution. RTD (ΔTorque or Δ%MVT /ΔTime) measurements of explosive strength were calculated from the time taken between contraction onset and absolute (50, 100 and 150 Nm [Vol RTD0-50Nm, Vol RTD0-100Nm, Vol RTD0-150Nm)
and relative (25, 50 and 75%MVT [Vol RTD0-25%MVT, Vol RTD0-50%MVT, Vol RTD0-75%MVT])
torques, as well as RTD between sequential torque levels (absolute 50-100 and 100-150 Nm [Vol RTD50-100Nm and Vol RTD100-150Nm]; relative 25-50 and 50-75%MVT [Vol RTD25-50%MVT,
Vol RTD50-75%MVT]). Values recorded from each of the three analysed (best) contractions
were averaged.
Evoked Octet Contractions
(120% maximal current) octet contractions were elicited. Absolute and relative RTD (ΔTorque or Δ%MVT/ΔTime) measurements of evoked explosive strength were calculated from the time taken between contraction onset and absolute (50 and 100 Nm [Oct RTD0-50Nm
and Oct RTD0-100Nm) and relative (25 and 50%MVT [Oct RTD0-25%MVT and Oct RTD0-50%MVT])
torques, as well as RTD between sequential torques (absolute 50-100Nm [Oct RTD50-100Nm];
relative 25-50%MVT [Oct RTD25-50%MVT]). Values recorded from each of the three
supra-maximal contractions were averaged. Evoked measures were not acquired for three partici-pants who did not tolerate the discomfort associated with the octet stimulation.
Ramp Contractions for Determination of Tissue Stiffness
Tissue stiffness was derived from synchronous recordings of torque and tissue elongation (corrected for passive tissue displacement via video recording of knee joint changes) during isometric knee extension ramp contractions. Participants completed two sub-maximum prac-tice ramp contractions prior to five (obtaining reliable measures of tissue stiffness requires numerous efforts [Schulze et al. 2012]) maximum attempts with 90 s rest between contrac-tions. Prior to each ramp contraction participants were shown a target torque-time trace on a computer monitor that increased at a constant gradient (50 Nm.s-1 loading rate) from zero up to MVT. They were instructed to match the target trace as closely as possible for as long as possible (i.e. up to MVT), and real-time torque was displayed over the target torque-time trace for feedback. The preceding knee extensor MVCs and sub-maximum contractions were considered sufficient to elicit tissue preconditioning, The three most suitable ramp contrac-tions, according to highest peak torque, the closeness to the target loading rate and ultrasound image clarity, were analysed and measurements averaged across these three contractions.
Measurement of Tissue Elongation
An-other ultrasound probe (5-10 MHz linear array transducer, B-mode, scanning width 92 mm and depth 65 mm, EUP-L53L; Hitachi EUB-8500) was fitted into a custom made high-density foam cast that was held firmly over the anterior aspect of the knee with the probe aligned longitudinal to the patellar tendon such that the patellar apex and insertion of the pos-terior tendon fibers at the tibia could be visualized at rest and throughout the contraction. The ultrasound machines were interfaced with the computer collecting torque data in Spike 2 and the video feeds were recorded synchronously with torque using Spike 2 video capture at 25 Hz. To circumvent the difficulty of judging the consistency of grey-scale ultrasound patterns for the points of interest and possible experimenter bias in tissue elongation measurements, some degree of automated analysis is recommended (Seynnes et al. 2015). During off-line analysis tissue elongation was tracked frame-by-frame using public-domain semi-automatic video analysis software: Tracker, version 4.86 (www.cabrillo.edu/~dbrown/tracker). VL fas-cicle deep aponeurosis cross point displacement relative to the skin marker provided a meas-ure of muscle-tendon unit (MTU) elongation. Patellar tendon elongation was determined by the longitudinal displacement of the patella apex and the tendon tibial insertion. To enable correction of tissue displacement due to joint angle changes during ramp contractions indi-vidual ratios of tissue displacement relative to joint angular displacement (mm/°) were ob-tained from passive movements (i.e. plotting the tissue displacement-knee joint angle rela-tionship). This ratio was used to determine tissue displacement resulting from knee angle change during ramp contractions, which was subsequently subtracted from total measured displacement. Corrections were only applied to aponeurosis displacement. Tendon elongation under passive conditions was deemed negligible. Passive movements were conducted prior to the ramp contractions. Participants were instructed to completely relax as their knee was moved through 90 to 130°. During passive movements and ramp contractions, knee joint an-gle (anan-gle between visible markers placed on the greater trochanter, lateral knee joint space and lateral malleolus) was derived from sagittal plane video recorded using a camera mount-ed on a tripod positionmount-ed (1.5 m) perpendicular to the strength-testing chair. The video cam-era was interfaced with a computer and recorded using spike 2 video-capture at 25 Hz (simul-taneously with force, EMG, and ultrasound images during the ramp contractions) and ana-lysed via Tracker software.
Calculation of Tendon Force
(1.5T Signa HDxt, GE) images (2 mm thickness, 0 mm gap) as the perpendicular distance from the PT line of action to the tibio-femoral contact point, which was the midpoint of the contact distance between the tibia and femur. Due to constraints in the size of the knee coil, sagittal images were acquired in an extended knee position (~163°). Moment arm length for any specific knee angle measured at rest or during ramp contraction was estimated from pre-viously published data fitted with a quadratic function (Kellis and Baltzopoulos, 1999), scaled to each participant’s measured moment arm length at 163°. Absolute internal knee ex-tensor torque was given by summing net knee extension torque and the estimated knee flexor co-contraction torque. Antagonist knee flexor torque was estimated by expressing the average knee flexor EMG amplitude (RMS 50 ms moving window) during ramp contractions relative to the knee flexor EMGMAX and multiplying by the knee flexor MVT (assuming a linear
rela-tionship between EMG amplitude and torque). During analysis, torque and EMG amplitude were down-sampled to 25 Hz to match the ultrasound video frequency.
Calculation of Muscle-Tendon Unit and Patellar Tendon Stiffness
MTU (corrected for passive tissue displacement) and PT elongation were plotted (for each ramp contraction analysed) against tendon force. Tendon force-elongation plots were fitted with a second-order polynomial forced through zero. Using the associated quadratic equa-tions MTU and PT elongation was determined at specific absolute (50, 100 and 150 Nm) and individual relative knee extension torques (25, 50 and 75% MVT). Absolute stiffness (Δ ten-don force [N]/Δ elongation [mm]; N.mm-1) was calculated over 0-50, 0-100 and 0-150 Nm torque increments (MTU/PT k0-50Nm, MTU/PT k0-100Nm, MTU/PT k0-150Nm) and sequential
torque increments of 50-100 and 100-150 Nm (MTU/PT k50-100Nm and MTU/PT k100-150Nm).
MTU and PT elongation at relative torques were converted to strain (ε, %; ratio of Δ tissue length to resting tissue length). Relative stiffness (Δ%MVT/Δε [%MVT.ε-1]) was calculated over relative 0-25, 0-50, 0-75%MVT increments (MTU/PT k0-25%MVT, MTU/PT k0-50%MVT,
MTU/PT k0-75%MVT) and sequential increments 25-50 and 50-75%MVT (MTU/PT k25-50%MVT
and MTU/PT k25-75%MVT). The stiffness measures derived from each of the three ramp
Statistical Analysis
MVT, RTD and tissue stiffness (k) measures from duplicate measurement sessions were av-eraged for criterion measures used in statistical tests. Using SPSS Version 20.0 (IBM Corp., Armonk, NY), Pearson’s product moment bivariate correlations were performed to examine the relationships between absolute or relative RTD (voluntary or evoked) vs. tissue stiffness variables (MTU or PT) measured over equivalent torque increments; e.g. absolute PT k0-100Nm
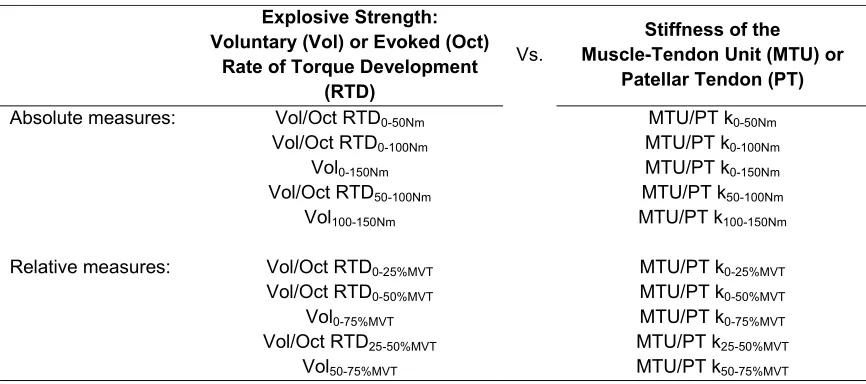
vs. Vol RTD0-100Nm, relative MTU k0-50%MVT vs. Vol RTD0-50%MVT (Table 1). Absolute
stiff-ness measures were also correlated against MVT. Additional (a posteriori) correlations were performed between matched relative torque increment voluntary/evoked octet RTD and MTU stiffness over 5% increments from contraction onset (e.g. Vol RTD50-55%MVT [%MVT.s-1] vs.
MTU k50-55%MVT [%MVT.ε-1]), to more specifically characterise the relationships found
be-tween the relative RTD and relative MTU stiffness. Statistical significance level was P<0.05. Descriptive data are presented as mean ± standard deviation (SD). To provide an index of measurement reliability average within participant coefficient of variation (CVw, %) was cal-culated between the two measurement sessions, although it is worth noting that the criterion values (averaged across two sessions) will have higher reliability than each individual session. Inter-individual variability is reported as between participant coefficient of variation (CVb, %) of criterion measures.
RESULTS
Measurement Reliability
Within-participant test-retest reliability was excellent for MVT (CVw 3.0%), and good for voluntary RTD (CVw ≤ 8.6% for absolute and relative measures). Matched MTU and PT k measures were not as reliable, but improved at higher torque increments: MTU k and relative MTU k, CVw 15.4 to 9.7% and 14.1 to 11.0%; PT k and relative PT k, CVw 13.9 to 8.8% and 13.6 to 8.1%.
Inter-individual Variability
octet RTD varied much less than voluntary RTD0-50Nm and 0-25%MVT. Octet sequential
RTD/relative RTD was highly variable (CVb was 37.4 and 45.3%).
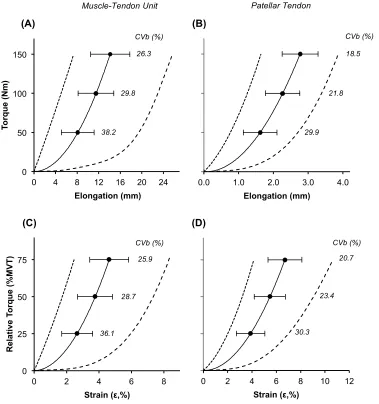
There was large inter-individual variability in external torque-elongation relationships for both the MTU and PT as shown in Figure 2 A and B. The variability in elongation was great-est at the initial torque increment (50 Nm: MTU 7.6-fold range; PT 3.7-fold range) and pro-gressively reduced at higher torque increments and sequential torques (e.g. 100-150 Nm: MTU 3.2-fold range; PT 2.4-fold range). Similarly, relative knee extensor torque-MTU/PT strain curves (Figure 2 C/D) showed tissue strain to be most variable at the initial relative torque level (25%MVT: MTU 6.6-fold range; PT 3.5-fold range), with less inter-individual variability at higher and sequential relative torques (e.g. 50-75%MVT: MTU 3.2-fold range; PT 2.4-fold range). PT elongation was ~20% of MTU elongation at all torque increments. Alternatively, PT strain was 1.5-fold greater than MTU strain. For clarity, whilst the external torque-elongation/strain relationships are shown for illustrative purposes, individual stiffness values were derived from tendon force-elongation/strain relationships.
Bivariate Correlations of PT Stiffness and Explosive Strength
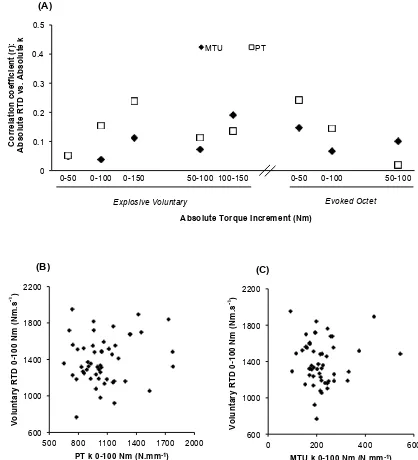
Voluntary and evoked RTD were unrelated to PT k measured over matching torque incre-ment (r = 0.02 to 0.242, P ≥ 0.094 [Figure 3 A]; e.g. scatterplots in Figure 3 B). Likewise, relative voluntary and evoked RTD were also unrelated to relative PT k (r = 0.048 to 0.255, P = 0.069 to 0.736; Figure 4 A). PT k measures were also unrelated to MVT (r = 0.094 to 0.127, all P ≥ 0.371).
Bivariate Correlations of MTU Stiffness and Explosive Strength
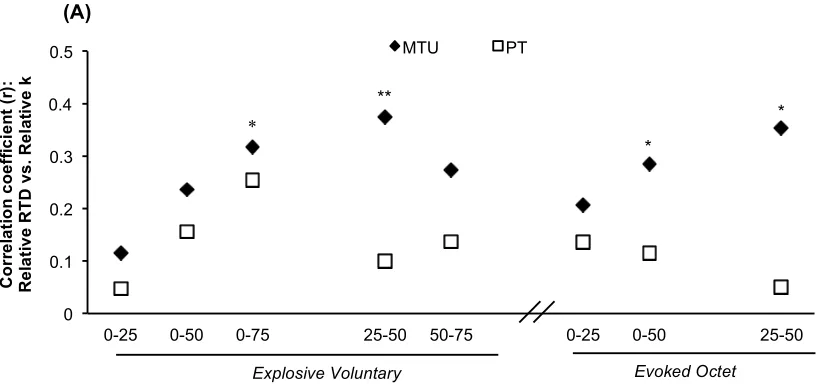
Voluntary and evoked RTD were unrelated to MTU k measured over the same torque incre-ments (r = 0.038 to 0.191, P ≥ 0.184 [Figure 3 A]; e.g. scatterplot in Figure 3 C). In contrast, some voluntary and evoked relative RTD measures were positively associated with relative MTU k (Figure 4 A) e.g. relative Vol RTD25-50%MVT r = 0.374, P = 0.007 (Figure 4 B) and
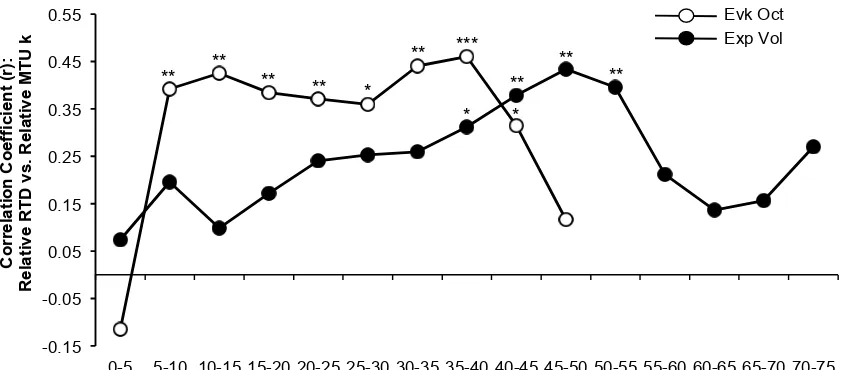
Oct RTD25-50%MVT r = 0.353, P = 0.014 (Figure 4 C). Following these associations a more
5-45%MVT (r = 0.315 to 0.461, P ≤ 0.029; Figure 5). Finally MTU k measures were unrelated to MVT (MTU, r = -0.124 to -0.09, all P ≥ 0.388).
DISCUSSION
The present study carefully investigated whether both PT and MTU stiffness (k) were related to voluntary and evoked explosive muscle strength in vivo, with both variables assessed over the same torque increment, and expressed in absolute and relative terms. Bivariate correla-tions revealed no relacorrela-tionships between absolute PT and MTU k and voluntary and evoked RTD. Likewise relative PT k was unrelated to relative voluntary or evoked RTD. However, relative MTU k had modest positive relationships to some measures of relative RTD during explosive voluntary (Vol RTD0-75%MVT, R2 = 0.101; Vol RTD25-50%MVT, R2= 0.140), and
evoked octet (Oct RTD0-50%MVT, R2= 0.081; Oct RTD25-50%MVT, R2= 0.125) contractions.
Subsequent correlations between relative RTD and MTU k in 5%MVT increments showed relative MTU k contributes to explaining voluntary relative RTD between 35-55%MVT (R2= 0.097 – 0.188), and relative RTD throughout evoked octet contraction (5-45%MVT; R2= 0.099 – 0.194).
values for the higher loading rates of stronger individuals (Pearson et al. 2007; Theis et al. 2012; Kösters et al. 2014).
In contrast, stiffness measurements in the present study were more thorough: duplicate meas-urement sessions each involving multiple, standardised loading ramp contractions, measure-ments of stiffness and RTD over the same torque increment for all individuals, and use of a large cohort of exclusively young males with similar physical activity status. Nevertheless this approach revealed wide inter-individual variability in MTU k, yet such differences did not manifest into a noticeable association with absolute RTD. Seemingly the lack of relation-ship between absolute MTU k and RTD could be ascribed to our avoidance of a specious as-sociation mediated by the confounding influence of maximum strength.
Some measures of relative MTU k and relative RTD were significantly associated. Specifi-cally, during the initial analysis relative MTU k was related to Vol RTD0-75%MVT and relative
Vol RTD25-50%MVT, and during the secondary analysis of 5% torque increments relative MTU
k and relative RTD were associated during the between 35-55%MVT. This contrasts with the results of a previous study that found no relationship between relative MTU k and relative RTD (Hannah & Folland, 2015). However, this previous study involved ramp contractions with a constant duration and thus variable loading rates that may introduce a bias as well as males and females that exhibit a number of distinct differences that might confound the rela-tionship. In the current study the consistent significant relationship between relative MTU k and voluntary relative RTD from 35-55%MVT suggest a genuine systematic relationship, although the explained variance was small (≤18.8%). The logical explanation for these voli-tional relationships was via an effect of relative MTU k on the contractile capability for rela-tive RTD as shown by the finding that relarela-tive MTU k was also significantly related to octet relative RTD; specifically octet RTD0-50%MVT, octet RTD25-50%MVT and subsequently from the
octet RTD by relative MTU k (≤19.4%) indicates that contractile RTD is largely determined by other factors; such as activation kinetics (Edman and Josephson, 2007), contractile protein composition (Harridge et al. 1996) and muscle fascicle length (Blazevich et al. 2009).
The present study was the first attempt to investigate if there is a relationship between in vivo free tendon k and RTD. We found PT k was not related to voluntary or evoked knee extensor RTD. The PT exhibited minimal elongation (~3 mm) that seems unlikely to appreciably in-fluence muscle length changes and thus force-generating potential. Also, the rate of force transmission through tendons is exceptionally rapid (Nordez et al. 2009; DeWall et al. 2014) especially for short tendons such as the PT (length ~45-50 mm), and likely explains the lack of a relationship between PT k and RTD. Furthermore PT k was unrelated to MVT and it is notable that we found no relation between relative PT k and voluntary/evoked relative RTD measures. Research with isolated muscles has found the force rise time under isometric con-ditions of fixed sarcomere length was not appreciably faster than during muscle-tendon unit fixed-end contractions, indicating a negligible impact of tendon compliance on isometric rate of force development (Haugen & Sten-Knudsen, 1987). Similarly, Kawakami and Lieber (2000) showed that the internal sarcomere shortening during fixed-end contractions of an iso-lated MTU was unchanged once the proximal and distal ends of the aponeurosis where clamped, indicating that the tendon did not impact muscle internal shortening during isomet-ric force production. Whether our results can be generalised to other MTU’s where the ten-don may contribute more significantly to the overall MTU stiffness is uncertain and requires further research.
In the current study stiffness was measured during constant-RTD ramp contractions that were necessarily performed at a lower RTD than the explosive contractions; in order to capture the tissue elongation with fixed frame rate of 25 Hz ultrasound. An underlying assumption of the study was that the measured stiffness values, during the ramp contractions, are relevant to higher strain rates of explosive contractions. However we know that stiffness exhibits strain rate sensitivity (Lieber et al. 2000; Pearson et al. 2007; Theis et al. 2012; Kösters et al. 2014) and thus tendinous tissues will behave in a stiffer manner during the explosive contractions than the ramp contractions, and that this discrepancy will be most pronounced for individuals with a high RTD (upto 3-fold higher than participants with the lowest RTD). Although the measures of stiffness in the current study discriminated between individuals with extensive inter-individual variability (2 to 8-fold variability in PT/MTU elongation at the same torque), it is conceivable that our measures of stiffness did not fully reflect stiffness during the explo-sive contractile conditions relevant to RTD, and could potentially have underestimated the strength of the relationships between stiffness and RTD. Future work could employ high frame rate ultrasound (4000 Hz, Nordez et al. 2009) to evaluate stiffness during explosive contractions i.e. simultaneous to RTD measures, to investigate if this changes the nature of the relationships we have documented.
In conclusion, absolute MTU and PT k were not associated with voluntary or evoked RTD, and this was also the case for relative PT k and relative RTD. However greater relative MTU k was related to higher relative voluntary and evoked RTD. These results suggest a differen-tial influence of MTU tissue components (muscle-aponeurosis vs. tendon) on relative RTD. An overriding influence of maximum strength is presumed to negate any relationship be-tween absolute MTU k and RTD.
REFERENCES
Andersen LL & Aagaard P (2006). Influence of maximal muscle strength and intrinsic con-tractile properties on concon-tractile rate of force development. Eur J Appl Physiol 96, 44–52.
Bojsen-Møller J, Magnusson SP, Rasmussen LR, Kjaer M & Aagaard P (2005). Muscle per-formance during maximal isometric and dynamic contractions is influenced by the stiffness of the tendinous structures. J Appl Physiol 99, 986–994.
de Ruiter CJ, Kooistra RD, Paalman MI & de Haan A (2004). Initial phase of maximal volun-tary and electrically stimulated knee extension torque development at different knee angles. J Appl Physiol 97, 1693–1701.
Deutekom M, Beltman JGM, de Ruiter CJ, de Koning JJ & de Haan A (2000). No acute ef-fects of short-term creatine supplementation on muscle properties and sprint performance. Eur J Appl Physiol 82, 223–229.
Dewall RJ, Slane LC, Lee KS & Thelen DG (2014). Spatial variations in Achilles tendon shear wave speed. J Biomech 47, 2685–2692.
Edman KA & Josephson RK (2007). Determinants of force rise time during isometric con-traction of frog muscle fibres. J Physiol 580, 1007–1019.
Folland JP, Buckthorpe MW & Hannah R (2014). Human capacity for explosive force pro-duction: Neural and contractile determinants. Scand J Med Sci Sports 24, 894–906.
Hannah R & Folland JP (2015) Muscle-tendon unit stiffness does not independently affect voluntary explosive force production or muscle intrinsic contractile properties. Appl Physiol Nutr Metab 40, 87–95.
Harridge SD, Bottinelli R, Canepari M, Pellegrino MA, Reggiani C, Esbjornsson M & Saltin B (1996). Whole-muscle and single-fibre contractile properties and myosin heavy chain isoforms in humans. Pflugers Arch 432, 913–920.
Haugen P & Sten-Knudsen O (1987). The time course of the contractile force measured dur-ing a twitch under fixed sarcomere length. J Muscle Res Cell Motil 8, 173–187.
Izquierdo M, Aguado X, Gonzalez R, López JL & Häkkinen K (1999). Maximal and explo-sive force production capacity and balance performance in men of different ages. Eur J Appl Physiol Occup Physiol 9, 260–267.
Kawakami Y & Lieber RL (2000). Interaction between series compliance and sarcomere ki-netics determines internal sarcomere shortening during fixed-end contraction. J Biomech 33, 1249–1255.
Kellis E & Baltzopoulos V (1999). In vivo determination of the patella tendon and ham-strings moment arms in adult males using videofluoroscopy during submaximal knee exten-sion. Clin Biomech (Bristol, Avon) 14, 118–124.
Koga H, Nakamae A, Shima Y, Iwasa J, Myklebust G, Engebretsen L, Bahr R & Krosshaug T (2010).Mechanisms for noncontact anterior cruciate ligament injuries: knee joint kinemat-ics in 10 injury situations from female team handball and basketball. Am J Sports Med 38, 2218–2225.
Kösters A, Wiesinger H, Bojsen-Møller J, Müller E & Seynnes OR (2014). Influence of load-ing rate on patellar tendon mechanical properties in vivo. Clin Biomech (Bristol, Avon) 29, 323–329.
Krosshaug T, Nakamae A, Boden BP, Engebretsen L, Smith G, Slauterbeck JR, Hewett TE & Bahr R (2007). Mechanisms of anterior cruciate ligament injury in basketball: video analysis of 39 cases. Am J Sports Med 35, 359–367.
Kubo K, Kanehisa H & Fukunaga T (2001). Effect of different duration isometric contrac-tions on tendon elasticity in human quadriceps muscles. J Physiol 536, 639–655.
Maffiuletti N, Aagaard P, Blazevich A, Folland J, Tillin N & Duchateau J (2016). Rate of force development: physiological and methodological considerations. Eur J Appl Physiol 116, 1091–1116.
Maffiuletti N, Bizzini M, Widler K & Munzinger U (2010). Asymmetry in quadriceps rate of force development as a functional outcome measure in TKA. Clin Orthop Relat Res 468, 191–198.
Maganaris CN & Paul JP (1999). In vivo human tendon mechanical properties. J Physiol 521(Pt1), 307–313.
Maganaris CN & Paul JP (2002). Tensile properties of the in vivo human gastrocnemius ten-don. J Biomech 35, 1639–1646.
Nordez A, Gallot T, Catheline S, Guevel A, Cornu C & Hug F (2009). Electromechanical de-lay revisited using very high frame rate ultrasound. J Appl Physiol 106, 1970–1975.
Pearson SJ, Burgess K & Onambélé GN (2007). Creep and the in vivo assessment of human patellar tendon mechanical properties. Clin Biomech (Bristol, Avon) 22, 712–717.
Rahemi H, Nigam N & Wakeling J (2014). Regionalizing muscle activity causes changes to the magnitude and direction of the force from whole muscles – a modeling study. Front Phys-iol 5, 298.
Reeves ND, Maganaris CN & Narici MV (2003). Effect of strength training on human patella tendon mechanical properties of older individuals. J Physiol 548, 971–981.
Rehorn M & Blemker S (2010). The effects of aponeurosis geometry on strain injury suscep-tibility explored with a 3D muscle model. J Biomech 43, 2574–2581.
Schulze F, Mersmann F, Bohm S & Arampatzis A (2012). A wide number of trials is re-quired to achieve acceptable reliability for measurement patellar tendon elongation in vivo. Gait Posture 35, 334–348.
Seynnes OR, Bojsen-Møller J, Albracht K, Arndt A, Cronin NJ, Finni T & Magnusson SP (2015). Ultrasound-based testing of tendon mechanical properties: a critical evaluation. J Appl Physiol 118, 133–141.
Theis N, Mohagheghi AA & Korff T (2012). Method and strain rate dependence of Achilles tendon stiffness. J Electromyogr Kinesiol 22, 947–953.
Tillin NA, Jimenez-Reyes P, Pain MT & Folland JP (2010). Neuromuscular performance of explosive power athletes versus untrained individuals. Med Sci Sports Exerc 42, 781–790.
Tillin NA, Pain MT & Folland JP (2013a). Explosive force production during isometric squats correlated with athletic performance in rugby union players. J Sports Sci 31, 66–76.
Tillin NA, Pain MT & Folland JP (2013b). Identification of contraction onset during explo-sive contractions. Response to Thompson et al. “Consistency of rapid muscle force character-istics: Influence of muscle contraction onset detection methodology” [J Electromyogr Kine-siol 2012;22(6):893–900]. J Electromyogr KineKine-siol 23, 991–994.
Wang HK, Lin KH, Su SC, Shih TT & Huang YC (2012) Effects of tendon viscoelasticity in Achilles tendinosis on explosive performance and clinical severity in athletes. Scand J Med Sci Sports 22, e147–e155.
Waugh CM, Korff T, Fath F & Blazevich AJ (2013). Rapid force production in children and adults: mechanical land neural contributions. Med Sci Sports Exerc 45, 762–771.
Wilson GJ, Murphy AJ & Pryor JF (1994). Musculotendinous stiffness: its relationship to eccentric, isometric, and concentric performance. J Appl Physiol 76, 2714–2719.
COMPETING INTEREST None declared.
AUHTOR CONTRIBUTIONS
All experiments for this study was conducted in the muscle function laboratory of the School of Sport, Exercise and Health Sciences at Loughborough University, UK.
Conception and design of the experiments: G.J.M, T.G.B, T.M.M-W, N.A.T, J.P.F.
Collection, analysis and interpretation of data: G.J.M, T.G.B, T.M.M-W, N.A.T, J.P.F.
Drafting the article or revising it critically for important intellectual content: G.J.M, T.G.B, T.M.M-W, N.A.T, J.P.F.
All authors approved the manuscript and agree to be accountable for all aspects of the work. All persons designated as authors qualify for authorship, and all those who qualify for author-ship are listed
FUNDING
This study was financially supported by a grant (reference 20194) from the Arthritis Research UK Centre for Sport, Exercise, and Osteoarthritis.
TABLES
Table 1. Matched explosive strength and tissue stiffness variables measured over the same absolute
or relative torque increments
Explosive Strength: Voluntary (Vol) or Evoked (Oct)
Rate of Torque Development (RTD)
Vs.
Stiffness of the Muscle-Tendon Unit (MTU) or
Patellar Tendon (PT)
Absolute measures: Vol/Oct RTD0-50Nm MTU/PT k0-50Nm
Vol/Oct RTD0-100Nm MTU/PT k0-100Nm
Vol0-150Nm MTU/PT k0-150Nm
Vol/Oct RTD50-100Nm MTU/PT k50-100Nm
Vol100-150Nm MTU/PT k100-150Nm
Relative measures: Vol/Oct RTD0-25%MVT MTU/PT k0-25%MVT
Vol/Oct RTD0-50%MVT MTU/PT k0-50%MVT
Vol0-75%MVT MTU/PT k0-75%MVT
Vol/Oct RTD25-50%MVT MTU/PT k25-50%MVT
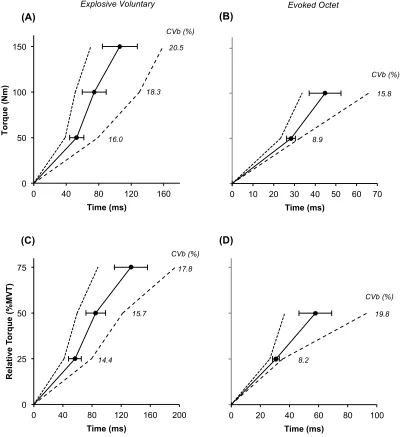
Rate of Torque Development Variability
Figure. 1. Inter-individual variability of torque-time curves during explosive voluntary (A, C; n=52) and evoked octet (B, D, n=49) contractions of the knee extensors expressed in absolute (Nm; A, B) and relative (% maximum voluntary torque, MVT; C, D) terms. Black line and circles (bars) are mean (SD) and the dotted and dashed lines depict the minimum and maximum torque values respectively. Italic numbers give the between participant coefficient of variation (CVb %) for the rate of torque development (absolute, ΔTorque/ΔTime [A and B]; relative, Δ%MVT/ΔTime [C and D]) calculated from 0 to the specified torque increment.
Explosive Voluntary Evoked Octet
0 50 100 150
0 10 20 30 40 50 60 70
Time (ms) (B) 8.9 CVb (%) 15.8 0 25 50 75
0 40 80 120 160 200
R e la ti v e T o rq u e (% MVT ) Time (ms) (C) 14.4 17.8 15.7 CVb (%) (D) 0 25 50 75
0 20 40 60 80 100
Time (ms) 8.2 19.8 CVb (%) 0 50 100 150
0 40 80 120 160
0 500 1000 1500 2000 2500 3000 3500 4000 4500 5000 0 25 50 75
0 2 4 6 8
T en d on F or ce (N ) R e la ti v e T o rq u e (% MVT )
Strain (ε,%) (C) 36.1 28.7 25.9 CVb (%) 0 500 1000 1500 2000 2500 3000 3500 4000 4500 5000 0 25 50 75
0 2 4 6 8 10 12
T or q u e (%M V T)
Strain (ε,%) (D) 30.3 23.4 20.7 CVb (%) 0 500 1000 1500 2000 2500 3000 3500 0 50 100 150
0 4 8 12 16 20 24
T en d on F or ce (N ) T o rq u e (N m ) Elongation (mm) (A) 38.2 29.8 26.3 CVb (%) Muscle-Tendon Unit 0 50 100 150
0.0 1.0 2.0 3.0 4.0
T or q u e (N m) Elongation (mm) (B) 29.9 21.8 18.5 CVb (%) Patellar Tendon
Tissue Stiffness Variability
[image:28.612.113.492.260.664.2]Relationships between Absolute Rate of Torque Development and Absolute Stiffness
Figure 3. (A) Pearson’s product moment correlation coefficients between absolute
measures of rate of torque development (RTD, Nm.s-1) during explosive voluntary or
evoked octet contractions and stiffness (k; N.mm-1) of the muscle-tendon unit (MTU,
black diamonds) or patellar tendon (PT, white squares), both measured over the same torque increment. (B & C) Example scatterplots of the bivariate relationships between RTD during explosive voluntary (n=51) contractions and patellar tendon (PT, B) and muscle-tendon unit (MTU, C) k measured over 0-100 Nm.
600 1000 1400 1800 2200
500 800 1100 1400 1700 2000 PT k 0-100 Nm (N.mm-1)
(B) Vo lu n ta ry R T D 0 -100 N m ( N m .s -1 ) 600 1000 1400 1800 2200
0 200 400 600
MTU k 0-100 Nm (N.mm-1)
Vo lu n ta ry R T D 0 -100 N m ( N m .s -1 ) (C)
Explosive Voluntary Evoked Octet
Absolute Torque Increment (Nm) 0 0.1 0.2 0.3 0.4 0.5
0-50 0-100 0-150 50-100 100-150 0-50 0-100 50-100
MTU PT
[image:29.612.95.513.250.710.2]Relationships between Relative Rate of Torque Development and Relative Stiffness
Figure. 4. (A) Pearson’s product moment correlation coefficients between the relative
rate of torque development (RTD, %MVT.s-1) during explosive voluntary and evoked
octet contractions and the muscle-tendon unit (MTU) and patellar tendon (PT) relative stiffness (k; %MVT.ε-1) determined for the same relative torque increment.
**P<0.01, *P<0.05. (B & C) Example scatterplots of the bivariate relationships between relative RTD during explosive voluntary (Vol; B [n=51]) and evoked octet (Oct; C [n=48]) contractions and relative MTU k measured over 25-50%MVT.
(A) 0 0.1 0.2 0.3 0.4 0.5
0-25 0-50 0-75 25-50 50-75 0-25 0-50 25-50
MTU PT
* * ** * Co rr e la ti o n c o e ff ic ie n t (r ): Re la ti v e RT D v s . Re la ti v e k
Explosive Voluntary Evoked Octet
Relative Torque Increment (%MVT)
0 500 1000 1500 2000 2500 3000
10 20 30 40
(C)
r = 0.353, R2= 0.125, P = 0.039
Oc te t R T D 2 5 -50% M V T ( % M V T .s -1 )
MTU k 25-50% MVT (%MVT.ε-1)
0 500 1000 1500 2000
10 20 30 40
(B)
r = 0.374, R2= 0.140, P = 0.007
MTU k 25-50% MVT (%MVT.ε-1)
[image:30.612.100.508.262.454.2]-0.15 -0.05 0.05 0.15 0.25 0.35 0.45 0.55
0-5 5-10 10-15 15-20 20-25 25-30 30-35 35-40 40-45 45-50 50-55 55-60 60-65 65-70 70-75
Relative Torque Increment (%MVT) ** ** ** ** ** * ** *** * * ** ** Evk Oct Exp Vol Co rr e la ti o n C o e ff ic ie n t (r ): Re la ti v e RT D v s . Re la ti v e MT U k
[image:31.612.96.518.207.392.2]Relationships between Relative Rate of Torque Development and Relative Muscle-Tendon Unit Stiffness
Figure. 5. Bivariate correlations between relative RTD (%MVT.s-1) and relative MTU
k (%MVT/ε-1) for the same torque increment. Correlations performed with n=51 for