Warm Homes Oldham evaluation : final report
BASHIR, Nadia <http://orcid.org/0000-0002-1384-4849>, EADSON, William
<http://orcid.org/0000-0002-2158-7205> and PATTISON, Ben
<http://orcid.org/0000-0002-3672-0849>
Available from Sheffield Hallam University Research Archive (SHURA) at:
http://shura.shu.ac.uk/15738/
This document is the author deposited version. You are advised to consult the
publisher's version if you wish to cite from it.
Published version
BASHIR, Nadia, EADSON, William and PATTISON, Ben (2016). Warm Homes
Oldham evaluation : final report. Project Report. Sheffield, Sheffield Hallam
University.
Copyright and re-use policy
See
http://shura.shu.ac.uk/information.html
Sheffield Hallam University Research Archive
Warm Homes Oldham evaluation:
final report
Author(s):
Nadia Bashir
Will Eadson
Ben Pattison
Acknowledgements
Contents
Executive Summary ... i
1. Introduction ... 1
1.1. Introduction ... 1
1.2. Background to the project ... 1
1.3. Methodology ... 2
2. Existing evidence on the impacts of fuel poverty interventions ... 5
3. Respondent characteristics ... 7
3.1. The overall sample ... 7
3.2. Sample demography ... 7
3.3. Economic characteristics ... 9
3.4. Intervention types ... 10
4. Headline findings ... 11
4.1. Introduction ... 11
4.2. Health and wellbeing outcomes ... 11
4.3. Life satisfaction ... 14
4.4. Satisfaction with home ... 15
4.5. Fuel poverty ... 16
4.6. Ability to heat home and pay bills ... 16
5. Subgroup analysis ... 18
5.1. Intervention type ... 18
5.2. Tenure ... 20
5.3. Income ... 20
5.4. Key illness or disability ... 20
5.5. Age and gender ... 21
5.6. Ethnicity ... 21
6. Qualitative findings ... 23
6.1. Introduction ... 23
6.2. Experiences of the service ... 23
6.4. Conclusion ... 26
7. Valuing outcomes ... 27
7.1. Introduction ... 27
7.2. Estimating and Valuing Improvement in Quality of Life as a Result of Increased Length of Life... 27
7.3. Estimating and Valuing Improvement in Quality of Life from Improved General Wellbeing ... 29
7.4. Findings ... 30
7.5. Conclusion ... 30
8. Conclusions ... 32
8.1. Introduction ... 32
8.2. Successes ... 32
8.3. Learning points ... 33
Appendix 1: Confidence intervals ... 35
Appendix 2: General Health Questionnaire ... 36
Executive Summary
The Warm Homes Oldham scheme is a project delivering home energy improvements and advice to people at risk of fuel poverty, with a particular focus on people at risk of poor health as a result of fuel poverty.
This report focuses on three activities:
analysis of monitoring and survey data collected by Keepmoat, the lead contractor in the Warm Homes Oldham scheme
analysis of qualitative interview data collected by the evaluation team
valuation of impacts of improvement to wellbeing to assess economic benefits.
Monitoring and survey data
Keepmoat collected monitoring data about participating residents, their homes and the works and advice they received as part of the project, as well as asking a series of questions pre- and post-intervention about their health, wellbeing and energy use. 427 respondents took part in both waves of the survey (176 households): around a third of project participants. From analysis of this dataset, the general picture is one of statistically significant change in almost all key change variables, including improvements in fuel poverty, general health and wellbeing, life satisfaction, and condition of homes. Key findings include the following:
it was predicted that three-quarters of participants would move out of fuel poverty as a result of the initiative
60 per cent of respondents with a physical health problem felt that the initiative had a positive impact on their health
four-fifths reported that the project had a positive impact on their general health and wellbeing
almost all (48 out of 50) of those who self-reported as being at 'high risk' of mental illness on completion of the General Health Questionnaire moved to 'low risk' following the initiative
96 per cent of respondents agreed that their home was easier to heat as a result of their involvement in the project; and 84 per cent agreed that they now spend less on their heating.
Qualitative data
The evaluation team conducted interviews with 25 residents who had received support through the scheme. Respondents were largely very positive about the ‘journey’ from contacting WHO to the point at which works were completed.
Most respondents reported an improved ability to control the warmth of their home Some respondents felt that the support received by WHO had led to reduced fuel bills, although others thought that it was too early to tell, or that it was difficult to disentangle other factors such as time of year, new tariffs and changes in income from the impact of WHO on their energy use.
Around a third of respondents said that WHO had made a big difference to their ability to socialise. For instance, one older respondent had not felt able to invite people into her house during winter prior to receiving support from the Warm Homes Service. The Service had made a big difference. Most importantly she was now able to have her grandchildren to visit. The most common health impacts experienced by respondents were reduced stress levels and improved emotional wellbeing. In some cases this was also linked to improved physical health. Although a small number of respondents thought that they were visiting their GP less frequently, improvements largely related to perceived quality of life rather than any definite link to reduced use of health and social care services.
Valuing the benefits
Finally, using modelling conducted by the evaluation team and data on mental health within the pre- and post-interventions surveys, we estimated the impact on Quality Adjusted Life Years (QALYs), from which we produced a monetary valuation for individuals (the perceived benefit of increased QALYs) and for savings to the NHS and exchequer. Depending on the method used, the monetary valuation for individuals was calculated as between £399,000 and £793,000. Using NHS and NICE guidelines for cost-benefit analysis, these figures suggest that the £250,000 per year investment from Oldham CCG is cost effective. These were based on an assumption that the impact of energy efficiency interventions are fully realised immediately and last for one year. This led on to an assessment of the NHS savings from impact on numbers of individuals with a Common Mental Disorder (CMD), estimated at 128 adults within the sample of 885 adults. These were:
£2,500 of reduced medication costs £21,600 of reduced counselling costs £11,000 of reduced GP costs
£2,800 of reduced outpatient costs £7,100 of reduced inpatient costs.
The combined impact of savings in these areas was £45,000 across the 885 adults in the evaluation sample.
The employment, output and fiscal savings from impact on numbers of individuals with a CMD was also calculated. This led to:
£178,000 of extra GDP due to higher employment rates £37,700 of extra GDP due to reductions in sickness absence
1
1.
Introduction
1.1.
Introduction
This report is the final report of the Warm Homes Oldham (WHO) evaluation, which focused on the first year of the Warm Homes Oldham scheme. The evaluation focused on understanding the impacts of the scheme, with a particular emphasis on health and wellbeing. The report pulls together findings from three sets of activities: analysis of monitoring and survey data collected by the WHO delivery contractor; qualitative interviews with recipients of support through the scheme; and valuation of the scheme’s impact on participant’s general wellbeing. Please note that the figures included in this report are subject to some important caveats (see Section 1.3, below, and Section 2).
1.2.
Background to the project
The Warm Homes Oldham scheme is a project delivering home energy improvements and advice to people at risk of fuel poverty, with a particular focus on people at risk of poor health as a result of fuel poverty.
The initiative delivered three forms of support aimed at alleviating fuel poverty:
Physical energy efficiency improvements using Energy Company Obligation (ECO) grant funding plus ‘top-up’ funding from the NHS, in particular:
- loft and cavity wall insulation - solid wall insulation
- new boilers and heating controls
Energy use advice, helping residents to use heating and appliances more efficiently in the home
Income maximisation, including:
- relieving fuel debt (by applying for trust fund grants) - help with bills/tariff switches
The project was jointly funded by Oldham Clinical Commissioning Group (CCG), Oldham Council and Oldham Housing Investment Partnership (OHIP), with the aim of generating demonstrable cost savings for the partners involved. As a community investment partnership between the NHS and other partners aimed at generating savings for services it was the first project of this kind in England. In the first year (the focus of this evaluation), the project aimed to lift 1,000 people out of fuel poverty. The intervention was targeted in two ways:
It was area-based: a mapping exercise was conducted to identify clusters of households most at risk of fuel poverty.
Households were screened to ensure that they met income-based (household income of under £40,000) and health-based criteria. In terms of the latter, one person in the household had to meet one of the following criteria to qualify: - were aged under 16 or over 50 years old
- were pregnant
- suffered from a physical disability - suffered from a physical illness - suffered from anxiety or depression
- presented symptoms of an illness or disability exacerbated by the cold. The scheme was launched in August 2013 and the first year of delivery was completed in March 2014. The scheme continues to this day with continued support from the funding partners and a target of 1000 people out of fuel poverty during 2016-17.
1.3.
Methodology
The research approach was intended to include five key activities:
Analysis of monitoring data collected by Keepmoat on behalf of the funding partners.
Analysis of pre- and post-intervention survey data collected by Keepmoat on behalf of the Oldham Partners.
Qualitative interviews with project participants.
Analysis of pre- and post-intervention health and social care data for project participation.
Valuation of project impacts on health and social care expenditure.
However, unfortunately the funding partners were unable to gain access to healthcare data within the evaluation timeframe following changes to eligibility introduced by NHS Digital after the scheme was underway. As such, analysis of healthcare data was not possible. Steps to mitigate for this are outlined below (see 1.3.3)
Monitoring and survey data
The quantitative data in this report were collected by Keepmoat on behalf of the Oldham Partners. These data included the following elements:
Monitoring data consisting of:
- data relating to the type and physical condition of dwellings
- fuel use and cost data (with fuel poverty calculated based on the cost of heating the homes to a 'comfortable' temperature of 21 degrees)
- an action plan for physical improvements, behaviour change advice and income maximisation, including the predicted impact on fuel poverty.
A questionnaire administered before the intervention took place, and again after a period of time post-intervention, which asked a range of questions relating to: - subjective health and wellbeing, including use of the standardised General
Health Questionnaire 12 (GHQ-12) - condition and repair of the home - ability to heat the home
- ability to pay bills.
These data were then analysed by the evaluation team to explore the impact of the scheme, using SPSS data analysis software to test for significant levels of change over time. A table outlining confidence intervals for the different datasets used to assess outcomes can be found in Appendix 1; and the General Health Questionnaire is included in Appendix 2.
It is important, however, to outline a number of caveats. The post-intervention questionnaire was administered between three and nine months following the intervention, in May/June 2014. For a more robust set of results, the baseline questionnaire would have been administered in winter pre-intervention, and then the post-intervention questionnaire administered the following winter. The timescales of the project precluded this option. It is important to note two points arising from this: respondents were reflecting on health, wellbeing and fuel use in late spring/early summer and as a result there might be seasonal impacts that cannot be accounted for here. These might include impacts on general wellbeing, houses feeling warmer as a result of warmer temperatures outside (and therefore being easier to heat), and lower energy use. Combined, these cloud the extent to which we can make conclusions based on the survey data alone.
Qualitative interviews
Qualitative interviews with project participants were utilised to generate deeper understanding of participants’ experiences of the scheme and develop a more nuanced understanding of their perceptions of project impacts – for instance by prompting reflection on the way in which the support they received had impacted on their daily lives, including any psychosocial benefits that are not easily picked up through quantitative metrics.
Twenty-five participants were interviewed for the evaluation, with the following characteristics:
12 male and 13 female respondents.
13 respondents over the age of 65; four aged between 25 and 34; and eight aged 45-65. Six households contained children under the age of 16.
17 respondents owned their own home; seven lived in privately rented properties; and one in a social rented property.
exploring the benefits of support in a range of domains, including control, finances, social connection and health and wellbeing.
Valuation of outcomes
As noted, the evaluation intended to value the impact of Warm Homes Oldham on health and social care services using data on participants’ health and social care use, but it was not possible to access these data within the timeframe of the evaluation. As a result it was not possible to directly assess impact of the project on health and social care costs.
2
2.
Existing evidence on the
impacts of fuel poverty
interventions
1
It is now well established that fuel poverty and cold homes negatively impact physical and mental health in adults and children. In the starkest terms, between 10 and 25 per cent (Marmot Review 2011) of the 43,900 excess winter deaths (EWDs) in England and Wales in 2014/15 were attributable to fuel poverty and cold homes. Cold fuel poor homes also have a significant effect on the mental health of adults (Green and Gilbertson, 20082; Gilbertson et al, 20123) and of young people, on children's respiratory health, infant weight gain and susceptibility to illness (Liddell and Morris, 2010).4 For people with long term conditions and older people cold homes exacerbate existing medical conditions, increase hospital admissions and may slow down recovery following discharge from hospital. Roche (2010) estimates for every EWD there are eight hospital admissions and 100 GP consultations. The poor health outcomes associated with cold conditions and fuel poverty also impact on longer term health outcomes and contribute to wider social and health inequalities. There are estimates of the costs to the NHS of treating illness which are either caused or exacerbated by cold homes. For instance Age UK5 estimated that costs were around £1.36 billion per year. The Building Research Establishment (BRE)6 has calculated that reducing hazards in housing including cold could deliver £600 million of savings per annum for the NHS. It has also been estimated that for every £1 spent on fuel poverty prevention there is a 42 pence saving in NHS health costs (Liddell, 2008).
1 For a more in-depth review of the evidence on cold homes see Bennett E, Dayson C, Eadson W and Gilberton J (2016) Warm, safe and well: The Evaluation of the Warm at Home Programme CRESR: Sheffield Hallam University
2
Green, G. and Gilbertson, J. (2008) Warm Front: Better Health. The Health Impact Evaluation of the Warm Front Scheme. Sheffield: CRESR, Sheffield Hallam University.
3
Gilbertson, J. et al(2012) Psychosocial Routes from Housing Investment to Health: Evidence from England’s Home Energy Efficiency Scheme. Energy Policy, 49, pp. 122-133.
4
Liddell, C. and Morris, C. (2010) Fuel Poverty and Human Health: A Review of Recent Evidence. Energy Policy, 38, pp. 2987-2997.
5 Age UK (2012) The Cost of Cold: Why We Need to Protect the Health of Older People in Winter, Age UK: London
Recognition of the impacts of cold homes on health is increasingly reflected in government and NHS policy. For instance the latest UK Fuel Poverty Strategy emphasises the need for partnership work to include the NHS, local authorities, industry, local community energy groups and the third sector. NICE has developed guidelines on action to tackle cold homes7and the Department of Health’s Cold Weather Plan8 includes a focus on tackling fuel poverty.
As interest grows in the effects of cold homes, so does interest in measuring the impact of programmes that seek to improve homes. There is a growing evidence base linking warmth interventions and energy efficiency improvements to health (Thomson et al, 20139; Maidment et al, 201410). It is widely acknowledged that energy efficiency improvements can reduce cold related illness and associated stress by making it easier for residents to heat their homes. However, overall evidence on the effectiveness of different interventions for reducing cold home related ill health is less well developed. In turn, there is limited evidence on the cost effectiveness of interventions that address the adverse health outcomes of fuel poverty and cold homes. Although there are estimates of the costs linked to cold homes (see above), the economic analysis of the cost savings to the NHS and beyond from alleviating fuel poverty and cold homes through measures such as energy efficiency improvements is much more difficult to calculate. Much of this difficulty comes down to the complexities of economic modelling and the difficulties associated with data collection.11
7 NICE (2015) Nice Guideline 6: Excess winter deaths and illness and the health risks associated with cold homes https://www.nice.org.uk/guidance/ng6/
8 Department of Health (2011) Cold Weather Plan for England: protecting health and reducing harm from severe
cold. London: Department of Health. 9
Thomson H et al (2013) Housing improvements for Health and Associated Socio-Economic Outcomes, Cochrane Database of Systematic Reviews, Issue 2. Art. No.: CD008657. DOI: 10.1002/14651858.CD008657.pub2
10
Maidment C et al (2014) The Impact of Household Energy Efficiency Measures on Health: A Meta-Analysis.
Energy Policy, 65,pp. 583-593.
3
3.
Respondent characteristics
3.1.
The overall sample
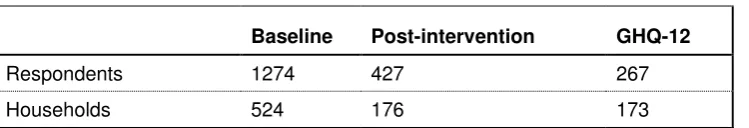
[image:15.595.110.485.373.437.2]This section briefly outlines the characteristics of the sample, and of respondents to the survey. 1,274 participants responded to the baseline questionnaire, accounting for 524 households. There was a fairly large drop-off for the post-intervention questionnaire, which covered 427 people (176 households). The effective sample of individual questions varied, particularly for those where only participants aged 16 or over were asked to respond. These included all health-related questions. This is summarised in Table 3.1, below, using the GHQ-12 sample as a guide for all health-related questions.
Table 3.1: Overall sample
Baseline Post-intervention GHQ-12
Respondents 1274 427 267
Households 524 176 173
The confidence intervals of the results therefore vary according to the questions under consideration (see Appendix 1 for a brief overview of the confidence intervals). The characteristics of each of these samples are explored in Section 3.2 below, with reference to the Oldham population where appropriate.
3.2.
Sample demography
The results of analysis of the characteristics of the sample are discussed below. These cover a range of demographic, socio-economic and intervention-based characteristics, including age, gender, ethnicity, disability, income and type of intervention received.
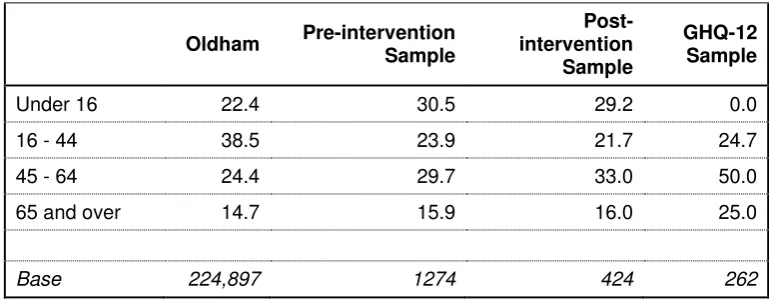
3.2.1. Age
Table 3.2: Age distribution of sample
Oldham Pre-intervention
Sample
Post-intervention
Sample
GHQ-12 Sample
Under 16 22.4 30.5 29.2 0.0
16 - 44 38.5 23.9 21.7 24.7
45 - 64 24.4 29.7 33.0 50.0
65 and over 14.7 15.9 16.0 25.0
Base 224,897 1274 424 262
3.2.2. Ethnicity
The project engaged a range of ethnic groups in line with the overall population of Oldham. The ‘White Other’ group was slightly less well represented. This group – particularly A8 migrants – can be challenging to engage with in general, and, if recent migrants, there might also be additional language barriers. The overall ethnic distribution of the sample is shown in Table 3.3 below.
Table 3.3: Respondents’ ethnicity
Oldham
Pre-intervention sample
Post-intervention
sample
GHQ-12 sample
White British 77.5 67.1 67.5 74.3
White Other 5.1 1.4 0.5 0.8
Asian or Asian
British 17.4 29.3 30.6 24.2
Chinese <1.0 0.3 0.0 0.0
Black or Black
British <1.0 1.1 1.0 0.4
Mixed <1.0 0.7 0.5 0.4
Base 224,897 1257.0 421.0 265.0
3.2.3. Gender
[image:16.595.109.514.349.561.2]Table 3.4: Gender distribution of sample
Oldham Pre-intervention
sample
Post-intervention
sample
GHQ-12 sample
Male 49 44.1 43.7 38.1
Female 51 55.9 56.3 61.9
Base 224,897 1253 419 260
3.2.4. Key illness
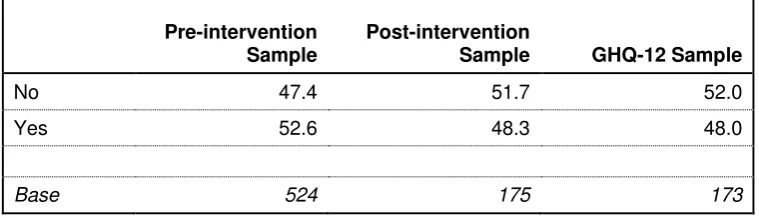
The survey asked respondents if they or anyone in their household suffered from a number of illnesses or disabilities with which there was a link to living in cold or damp homes. Around half of the households fell into this category.
Table 3.5: Households with one or members suffering from illness/disability linked to cold or damp homes
Pre-intervention
Sample
Post-intervention
Sample GHQ-12 Sample
No 47.4 51.7 52.0
Yes 52.6 48.3 48.0
Base 524 175 173
3.3.
Economic characteristics
3.3.1. Household tenure
Social rented housing was significantly under-represented within the sample. This is to be expected: social housing was not eligible for physical improvements and it is more likely in any case for social housing within the target areas to have undergone prior modernisation and therefore not require the works provided through the Warm Homes programme.
Table 3.6: Sample size by tenure
Oldham Baseline
sample
Post-intervention
sample
GHQ-12 sample
Owner-occupier 65.3 69.5 77.1 76.7
Private rented 12.2 24.9 22.3 22.7
Social rented 21.1 5.6 0.6 0.6
[image:17.595.106.486.308.417.2] [image:17.595.105.531.575.709.2]3.3.2. Household Income
[image:18.595.104.458.196.350.2]The post-2011 fuel poverty indicator adopted by the UK government includes a ‘low income’ variable, with the upper limit set at £16,000. This was used to assess the extent to which the programme was reaching those at risk within this fuel poverty definition. Around two-thirds of the sample met this criterion, with a median income of £14,500, suggesting that the project was successful in engaging those that needed it most in income terms. In addition, 82 per cent of the sample that answered all questions were in receipt of means-tested benefits.
Table 3.7: Household income
Pre-intervention
Sample
Post-intervention
Sample GHQ-12 Sample
< £16,000 64.5 65.9 66.5
>£16,000 35.5 35.1 33.5
Mean £15,575 £15,023 £14,963
Median £14,500 £14,500 £14,500
Base 524 175 173
3.4.
Intervention types
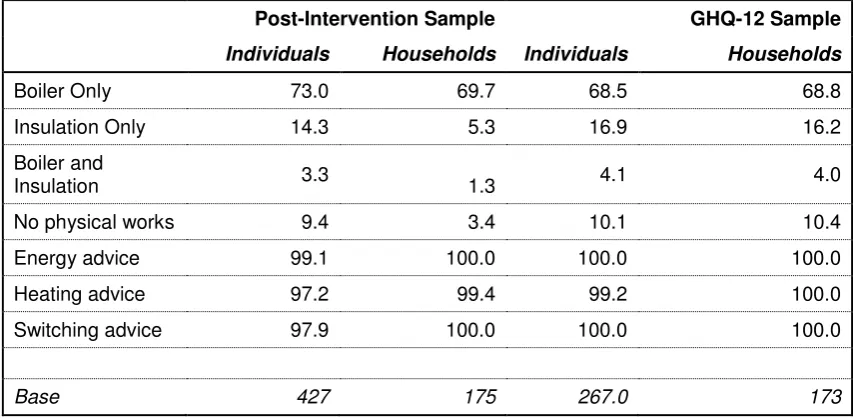
By far the most common physical intervention was the installation of a new boiler. Around three-quarters of individuals and households received a new boiler, with a smaller number receiving just insulation. With very few exceptions, all households received advice on energy use, heating controls and switching energy supplier.
Table 3.8: Intervention types
Post-Intervention Sample GHQ-12 Sample
Individuals Households Individuals Households
Boiler Only 73.0 69.7 68.5 68.8
Insulation Only 14.3 5.3 16.9 16.2
Boiler and
Insulation 3.3 1.3 4.1 4.0
No physical works 9.4 3.4 10.1 10.4
Energy advice 99.1 100.0 100.0 100.0
Heating advice 97.2 99.4 99.2 100.0
Switching advice 97.9 100.0 100.0 100.0
[image:18.595.106.533.471.680.2]4
4.
Headline findings
4.1.
Introduction
This section explores the headline findings from the baseline and post-intervention surveys: that is, the overall project outcomes. The general picture is one of statistically significant change in almost all key change variables.
4.2.
Health and wellbeing outcomes
Respondents were asked a variety of subjective health and wellbeing questions designed to elicit an understanding of change over the period between the baseline questionnaire and the post-intervention questionnaire. These covered the following aspects:
General Health Questionnaire questions: the ‘GHQ-12’ indicator is a set of 12 questions used to ascertain the risk of suffering from mental health problems Satisfaction with life in general
Pre-existing health conditions.
There was evidence of significant change across each of these aspects.
4.2.1. General Health Questionnaire
Respondents were asked 12 questions relating to their general mental wellbeing, with responses on a four point scale from ‘not at all’ to ‘much more than usual’ (see Appendix 2 for the list of GHQ-12 questions). The responses were then scored according to whether they provided a negative or positive response. For instance, Question 4 asked “To what extent have you recently been able to enjoy day to day
activities?” A response of ‘much more than usual’ or ‘same as usual’ scored 0 (no indication of potential mental health problems), and those that responded ‘less than usual’ or ‘not at all’ scored 1 (indication of potential for increased risk). The combined score across all 12 questions was then calculated: a score of 0-3 suggesting low risk of psychological distress and a score of 4 or greater suggesting higher risk.12
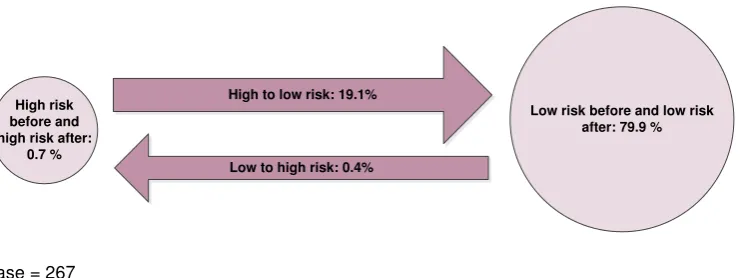
Figure 4.1, below, shows change in GHQ-12 scores across the sample. It shows those respondents that began as ‘higher risk’ and remained ‘higher risk’; those that moved between ‘higher’ and ‘lower risk’ (and vice-versa); and those that remained lower risk both before and after the intervention. The vast majority (80 per cent) of those that responded to both the pre- and post-intervention questionnaires were in
12 See Knott, C. (2012) General Mental and Physical Health, in HSE 2012: Vol .1, HSCIC, London.
the ‘lower risk’ category in both instances.13 Of the 51 (20 per cent of the sample) respondents that were identified as ‘higher risk’ before receiving improvements to their home, only two remained within this group. This is a statistically significant change (at the 95 per cent level).
Figure 4.1: Change in GHQ-12 scores
High risk before and high risk after:
0.7 %
Low risk before and low risk after: 79.9 %
Low to high risk: 0.4% High to low risk: 19.1%
Base = 267
This suggests a very strong initial impact of the programme on a key success indicator, but it is important nonetheless to bear in mind the caveats discussed above regarding the impact of immediacy (and potential drop-off over time) and seasonality. Given that the baseline dataset gave figures only slightly higher than estimated levels of 'high risk' for the UK (see reference above), it would be unlikely for one set of interventions focused on energy savings to be responsible for single-handedly reducing this level to just one per cent. Although the project may have had positive impacts on mental wellbeing, the causes of mental distress are complex and not reducible to cost of fuel/warmth in the home. However, notwithstanding this caveat, we proceed on the assumption that this data is accurate in our further modelling below.
4.2.2. Pre-existing health conditions
The responses to other questions gave results more within the range that might be expected. 53 per cent of households in the overall sample said that someone in their household had a pre-existing health condition for which there was an established link to a cold or damp home. Individuals were then asked in the follow-up questionnaire whether they felt that their condition had improved as a result of the improvements made on their home. Figure 4.2, below, illustrates that 60 per cent of respondents with a pre-existing health condition felt that it had improved as a result of the intervention.
Figure 4.2: Do you feel any of your health conditions have improved as a result of your involvement with the project
Base = 227
4.2.3. General physical and mental wellbeing
As part of the post-intervention questionnaire, respondents were asked two questions about the impact of home improvements and energy advice on their overall physical and mental wellbeing. Half of respondents reported an improvement in their physical health as a result of the programme, while nearly four-fifths (79 per cent) felt that their general wellbeing had improved (that is, they felt less stressed, happier, or more satisfied with life)
Figure 4.3: Extent to which respondents agreed that their physical health and general wellbeing had improved as a result of their involvement in the programme
Base = 300
60%
40%
0.00% 10.00% 20.00% 30.00% 40.00% 50.00% 60.00% 70.00%
[image:21.595.110.471.508.727.2]4.3.
Life satisfaction
Respondents were asked two questions about life satisfaction. First, they were asked, on a scale of one to ten, how satisfied they were with their life, overall. The mean score pre-intervention was 6.3, which increased to 6.9 post-intervention. This change is significant at the 95 per cent level.
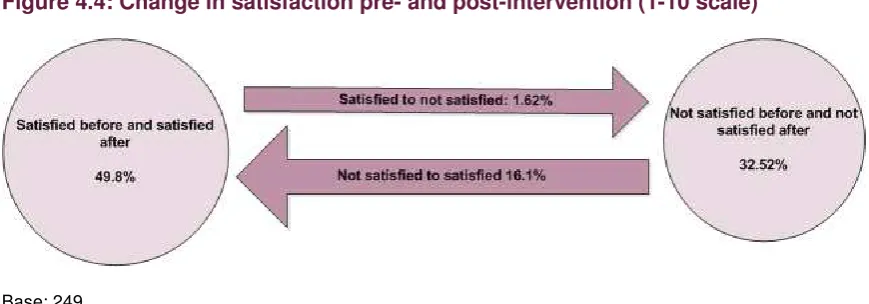
[image:22.595.108.543.252.404.2]The national average score is 7.13. In analysis undertaken by National Statistics, anybody scoring below seven is considered to have ‘low’ life satisfaction. This was used to analyse results from the Warm Homes survey. Figure 4.4, below, shows change across the group using an ‘unsatisfied’ and ‘satisfied’ distinction according to respondents’ scores. The table shows that 16 per cent of respondents moved from unsatisfied pre-intervention to satisfied post-intervention. This is a statistically significant shift.
Figure 4.4: Change in satisfaction pre- and post-intervention (1-10 scale)
Base: 249
The same question was asked later on in the questionnaire, but this time on a scale of ‘very satisfied’ to ‘very dissatisfied’. 84 per cent of respondents were either ‘very satisfied’ or ‘satisfied’ prior to taking part in the programme, which increased to 98 per cent after taking part. This is a significant level of change (95 per cent level) in itself, but the key point of change here is the extent to which those who were dissatisfied moved to satisfied after receiving home improvements and/or energy advice. 95 per cent of those that were dissatisfied prior to taking part in the programme reported themselves to be satisfied with life post-intervention. This is also significant at the 95 per cent level. However, this question was asked following on from the GHQ-12 questionnaire, the results of which are discussed above. Again, the numbers of respondents reporting that they were 'satisfied' with life seems out of step with what might normally be within the 'expected' range of results.
Figure 4.5: Change in life satisfaction pre- and post- intervention (5 category scale)
Satisfied before and satisfied after: 83.1%
Not satisfied to satisfied: 15%
Satisfied to not satisfied: 1.1% Not satisfied before and not
satisfied after: 0.8 %
[image:22.595.113.542.625.766.2]4.4.
Satisfaction with home
Satisfaction with home, although not a direct measure of health and wellbeing, provides a good indicator for the broader effectiveness of the programme. Respondents were asked about their home’s state of repair, as well as how satisfied they were with different aspects of their home on a range of issues relating to warmth and ventilation.
[image:23.595.101.519.304.565.2]The results of the survey are summarised in Figure 4.5, below. In all, there was a statistically significant positive shift in respondents’ views on the overall state of repair of their home. 65 per cent of respondents were satisfied prior to taking part in the programme, compared to 95 per cent afterwards. There were also statistically significant changes in satisfaction with indoor temperature, humidity, freshness of air, effectiveness of heating and insulation/draught-proofing. Incidence of condensation, damp or mould had reduced but not significantly so. However, 74 per cent of respondents did think that the level of condensation, damp or mould in their home had reduced as a result of the intervention.
Figure 4.6: Levels of satisfaction with state of repair of home
4.5.
Fuel poverty
Impacts on fuel poverty as a result of the intervention were calculated by the lead contractor, Keepmoat. These are reported in Oldham Council’s own evaluation report14, but for completeness, we repeat the key points here. In doing so, we use Keepmoat’s calculations. This includes accepting Keepmoat’s estimates of energy advice uptake – these were further explored in the qualitative interviews.15 The key findings here are:
75 per cent of households (391 households; 994 individuals) were taken out of fuel poverty16
The median reduction in proportion of income spent on fuel was five percentage points.
The median saving per household including physical works, Warm Homes Discount and potential savings from behaviour change was £678 (based on predicted pre- and post-intervention bills: the actual savings may be smaller owing to under-heating of homes). The median predicted savings for different types of intervention are as follows:
- £256 from physical works (522 households) - £252 from behaviour change (519 households) - £135 from Warm Homes Discount (293 households) - £175 from tariff switching (131 households).17
In addition, 16 households were recorded as receiving income maximisation support: these included relatively large sums, with a median increase in household income of £1,123.
4.6.
Ability to heat home and pay bills
Estimates of fuel poverty are a useful indicator of the financial impacts of the intervention. However, self-reporting on the ability to heat homes and pay bills provides an important complement to this. Survey respondents were asked a number of questions about their ability to heat their home and to pay fuel bills. As a headline finding, participants in the programme reported that their home was both easier to heat (96 per cent) and that they spent less money on heating (85 per cent) as a result of the improvements to their home (see Figure 4.7, below).
14
www.warmhomesoldham.org
15 Keepmoat calculated behaviour change savings on the basis that 50% of potential savings were realised for all households: it might be that a higher proportion of residents did not act on the advice given, did not continue to act on the advice over a prolonged period of time, or only partially acted on the advice.
16
The figures shown here differ slightly from those reported in other literature relating to WHO, which uses the numbers of households and residents that met a payment by results calculation: as well as those that were taken out of fuel poverty by the initiative, it also included households for whom the level of fuel poverty in a home was reduced by over a third and the revised predicted fuel bill to heat the home properly is within 10% of the current bill as a result of the action plan proposed and enacted for that property.
Figure 4.7: Change in use of energy for heating
Base: 299
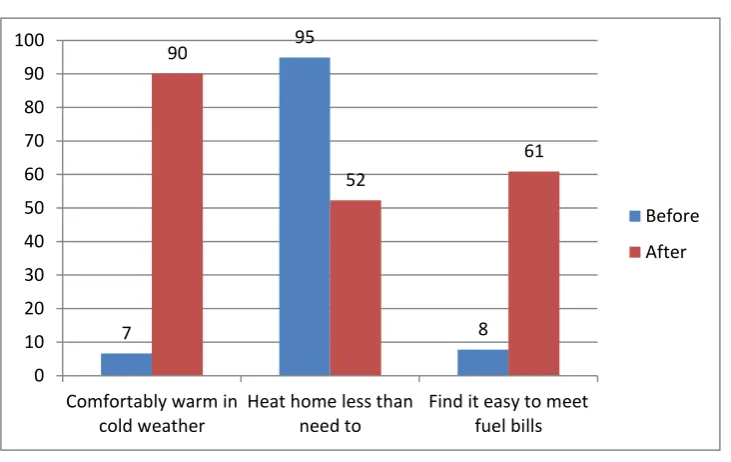
Similarly, there were statistically significant changes in two key variables:
Ability to keep the home comfortably warm in cold weather (increase by 83 percentage points).
Heating the home less than residents need to (reduction from almost all respondents – 95 per cent – to just over half: 52 per cent).
This is shown in Figure 4.8, below.
Figure 4.8: Ability to heat home and meet fuel bills
Base: 411 - 424
However, the number of people in fuel debt increased over the period under consideration from 11 per cent to 16 per cent. This is statistically significant at the 95 per cent level. This is most likely owing to the time period under consideration: the winter months are the period in which fuel bills will be highest for most, if not all, homes. Similarly, fuel bills are often paid in arrears and as such may reflect fuel use prior to the initiative taking place.
62 51.5 34.1 43.2 0 20 40 60 80 100 120
Your Home is easier to heat Now spend less on heating
Agree Strongly Agree 7 95 8 90 52 61 0 10 20 30 40 50 60 70 80 90 100
Comfortably warm in cold weather
Heat home less than need to
Find it easy to meet fuel bills
Before
[image:25.595.107.473.442.673.2]5
5.
Subgroup analysis
This section looks at the extent to which reported outcomes differed depending on various respondent characteristics. Here we consider the following characteristics: intervention type
tenure income age gender ethnicity.
Analysis was conducted across the variables discussed in Section 3, above. The discussion below does not detail all of the analysis; rather it highlights particular points of interest within the results.
It is worth reiterating here that positive outcomes were reported regardless of respondent characteristic, although there were some differences in the extent of those outcomes. In most cases differences were not significant, however, and this is largely owing to the large levels of positive change reported among all groups.
5.1.
Intervention type
First we consider the effects of receiving different forms of intervention. The following groups were considered:
whether or not participants received a physical intervention whether or not participants had a new boiler installed whether or not participants had external insulation installed
whether or not participants received Warm Homes Discount as a result of the programme.
The monitoring data suggest that all but a very small number of participants received energy advice, which meant there was no effective 'comparator' group.
ability to keep the house comfortably warm in cold weather how easy it was to pay bills
being lifted out of fuel poverty.
In all other cases, the relationship was either negative or not significant. This should not be taken to read that the programme was not effective, however. Rather, it suggests that the comparator group were not sufficiently ‘independent’ of the intervention groups.
It is important to note that in each of the cases where a negative relationship was found the baseline position was 'worse' (for instance, more people scoring highly in the GHQ-12 score) for the 'control' group than for the group receiving the intervention. As a result there was greater scope for improvement. And, in the case of the GHQ-12 scores, the numbers of post-intervention high-risk participants were so low that any small fluctuation could disproportionately affect the outcome of significance testing. Finally, the majority of those who had not yet had works completed had been recommended for works: it might be that works were in progress or were due to start soon. This could potentially have a psychological impact on respondents even if they had not yet felt the material benefits of the intervention.
When considering the ‘additionality’ questions asked following the intervention, clearer differences emerge. Respondents were asked, whether, as result of their involvement with the Warm Homes project, they agreed that their life or home had improved in different ways. Figure 5.1 shows the differences between those that received a boiler and those that did not as part of the project.
Figure 5.1: Subjective impact of involvement in project on health and heating spend
Base = 300
The difference in scores for physical health and general wellbeing are significant, suggesting that those that received a new boiler did feel that it made a difference to their overall health. There was less of an impact on the perceptions of heating expenditure. This could be owing to a number of factors, including the short time period under consideration, and also the fact that residents tend to ‘take-back’ savings in heating through heating homes to a warmer temperature. In addition, those who did not receive a boiler did also receive energy savings advice, including
64.7 80 94.2 35.5 46.1 96.1 0 20 40 60 80 100 120 Physical health improved General well-being improved
Spend less on heating
Boiler
[image:27.595.107.469.429.651.2]potentially switching tariffs and Warm Homes Discount. These positive differences were not found for external wall insulation, suggesting that boilers have a more immediate impact on participants’ perceptions.
5.2.
Tenure
[image:28.595.109.470.257.487.2]Moving on to housing tenure, differences in change between owner-occupiers and those living in the rented accommodation were tested. This derived no significant difference to the indicators measured at pre- and post-intervention, nor to the subjective post-intervention measures regarding the difference that the project had made. However, those in private rented accommodation were slightly more likely to be taken out of fuel poverty by the initiative (significant at 95 per cent level), as is shown in Figure 5.2, below.
Figure 5.2: Change in fuel poverty levels across tenure
Base = 994
5.3.
Income
The same variables were analysed for different impacts according to household income. In this instance, those with low incomes were found to have greater positive change in GHQ-12 scores, and the ability with which they were able to keep their home comfortably warm. There were no significant differences in changes between low and non-low income groups in terms of ability to pay bills or overall life satisfaction.
5.4.
Key illness or disability
There were significant differences (95 per cent level) in the extent to which those with a ‘key’ illness or disability (that is, those associated with cold or damp homes) reported changes to their mental wellbeing, as show in Table 5.1, below.
91.6
82.8 83.2
8.4 6.3 10.1
0 10 20 30 40 50 60 70 80 90 100
PRS Social Rented Owner Occupier
Fuel Poverty before
Table 5.1: Differences in selected variables: those with a ‘key’ illness or disability against those without
Key illness or disability No illness/disability
Before After Before After
GHQ-12 'High Risk' 31.9 1.7 10.6 0 Significant difference
Satisfied with life overall 75 98.2 90.9 100.0 Significant difference
Bills are easy to pay 11.7 66.7 6.2 58.6 Not significant
Able to keep home
comfortably warm 9.6 84.8 5.4 87.0 Not significant
As Table 5.1 shows, both those with and without a key illness experienced positive change, and this was the case across all variables. In some instances, the extent of these changes differed across the two groups. Those with a key illness or disability were significantly more likely to have a moved from ‘higher’ to ‘lower’ risk on the GHQ scale; and were also significantly more likely to have moved from ‘unsatisfied’ to ‘satisfied’ with life in general. There were small differences in change on the ease with which people were able to pay their bills and also their ability to keep comfortably warm, but these were not statistically significant: that is, the change lay within the expected range of differences between any two groups.
5.5.
Age and gender
The highest proportion of those in fuel poverty pre-intervention was the 65 and over group (95 per cent in fuel poverty compared to 84 per cent across the rest of the sample). However, there were no significant differences in change across different age groups on fuel poverty, nor other measures. Similarly, although women were slightly more likely than men to have a high GHQ-12 score, this did not translate into significant levels of change across this or other variables.
5.6.
Ethnicity
In order to ensure that the samples contained sufficient numbers, ethnicity was coded into a binary variable of 'White British' and ‘other ethnicity’ (see Section 2, above, for the proportions of different ethnicities within the sample). Analysis across the key variable found some differences between White British respondents and those of other ethnicities. These were:
impact on fuel poverty
ability to keep the home comfortably warm in winter.
In terms of fuel poverty, White British and non-White British respondents began from a similar baseline: 85 per cent of White British and 86 per cent of non-white British respondents were in fuel poverty prior to participating in the project. However, non-White British respondents were slightly more likely to move out of fuel poverty following involvement in the project (significant at the 95 per cent level). Table 5.2, below, details these changes.
[image:29.595.92.571.89.209.2]Table 5.2: Changes in fuel poverty and comfort by ethnicity
White British Other Ethnicity
Before After Before After
Fuel Poverty 85.4 11.4 86.4 6.1 Significant change
Able to keep comfortably
6
6.
Qualitative findings
6.1.
Introduction
This section reports on data collected through qualitative interviews with 25 residents who received support through the Warm Homes Oldham scheme. Respondents were very positive about the service, and the benefits it brought to their household. Psychosocial benefits such as reduced stress and social isolation were pronounced, particularly in relation to financial concerns. Most residents were positive about the process of receiving support, although less than half could recall receiving advice about energy behaviour despite almost 100 per cent of participants having been recorded as receiving advice in project monitoring data.
6.2.
Experiences of the service
Almost all of the respondents referred to problems with the ability to keep their home warm alongside difficulties with being able to afford to pay their bills. Many respondents also suffered from health problems that were exacerbated by living in a cold home. In most cases these issues had been on-going for a number of years, and some residents had been trying to seek support to improve energy efficiency in their home for a similar length of time.
A small number of respondents did report a more negative experience, however. One respondent reported that the loft insulation they received was not properly installed - “I think they just thrown it in the loft - I looked in the loft, it was rolled up in the corner” – and another did not have any works carried out after a difficult encounter with a Keepmoat assessor: the respondent claimed that the assessor had a very abrupt manner and would not discuss the detail of the works with the respondent. In all they felt “like I’ve had a lucky escape from it” (Single, 53, Owner-occupier).
Very few respondents recalled receiving any behavioural advice, and of those that could recall receiving advice, only one reported having acted on it. Others claimed that they were already carrying out the actions suggested.
6.3.
Perceived benefits of the service
Respondents were asked what they thought was the best thing about the help received from the Warm Homes Service. Responses split fairly evenly between those that focused on the quality of the work and those that talked about the effect of a new boiler on the warmth of their home. Of those in the latter category, respondents referred to the following key improvements:
improve ability to control the warmth of their home reduced cost of heating the home
reduced social isolation
reduced stress as a result of the above improvements, particularly reductions in the cost of heating.
Most respondents reported an improved ability to control the warmth of their home, in the majority of cases the result of simply being able to heat their home to an adequate level of warmth:
“We keep our boiler basically on all the time now, and our house you can basically walk round now without having to put a cardigan on… it's just so
comfortable now … One time we were confined to downstairs, where it were warmer, now I can go an watch TV in bedroom if I want to.” (Family with one child, 50, Owner-occupier)
Others talked about the value of installing thermostats and thermostatic radiator valves (TRVs), which meant that they were able to control the temperature of different rooms:
'We could control room by room temperature and we set up the times on the boiler to come on when and where we wanted and stuff, and we could set up day-by-day….it was quite handy.' (Couple, 29, Private Rented Sector)
'Because I've got the new better boiler, I can have different heating in different rooms. I've got a thing that I can control it from my couch, so it's brilliant.' (Lone parent, 32, Private Rented Sector)
'there's a little bit extra there in the pot to maybe do something for me, even if it's just going out for a meal with friends.' (Single, 70+, Owner-occupier)
Those respondents that had noticed a change talked about how important this was to them. One respondent had previously had to ask relatives for financial help, which had “knocked my confidence”. This was no longer necessary. Another worried much less about their fuel bills as a result of the intervention:
'We're only on minimum wage and all that. We were panicking about how much we put in, especially on the gas, and now our worries are very low now, because we know we can put £10 a week on, run that gas boiler 24/7 and not have to worry about topping it up.' (Family with one child, 50, Owner-occupier)
A number of others also reported experiencing lower stress levels and better mental wellbeing more generally.
'I was always a quarter behind (in gas bills)….yes it does make me feel less anxious about that because once the money's there for the direct debit you can pretty much forget about it ... When I was basically living in a garden shed - that's how it felt. Obviously, I would feel very very low at those periods, you
know, when you can't warm up…I felt particularly low during those periods, so clearly as I feel warmer, more comfortable around the property because of the work that's been done, that doesn't trigger those particular episodes [of depression].' (Single, 55, Owner-occupier)
'I don't have to sit there all the time and worry about whether my son is going to be cold because what I would do is have the heating on all the time whilst he was awake, once he was in bed turned it off, so you sat in cold and it's just
miserable' … 'It's just improved the quality of life, so you're not feeling so low, cos money always plays a massive part in how you feel, and if you can't pop out because you haven't got the money to, but then when you're having to stay in and it's freezing, it just wears away.' (Lone parent, 32, Private Rented Sector)
Interviews also explored the difference that WHO had made to their ability to socialise. Around a third of respondents said that it had made a big difference in this regard. One older respondent had not felt able to invite people into her house during winter prior to receiving support from the Warm Homes Service. The Service had made a big difference:
'Before I couldn’t really have other people. im a very outgoing person and I like to have my friends over for Sunday dinners and my grandchildren, but I couldn't do that. It was awful. But I can do that now.' (Single, 70+, Owner-occupier)
Health and wellbeing Impacts
The most common impacts experienced by respondents were reduced stress levels and improved emotional wellbeing. In some cases this was also linked to improved physical health. One respondent, for example, had previously felt very isolated and prone to episodes of depression. Having a warmer home had improved her mobility, which in turn made her feel “a lot better within myself”. In this instance, the respondent thought that they were visiting their GP less frequently. Another talked about feeling much better general health.
On the whole, however, improvements largely related to perceived quality of life rather than any definite link to reduced use of health and social care services.
6.4.
Conclusion
7
7.
Valuing outcomes
7.1.
Introduction
[image:35.595.106.493.466.603.2]A key objective of the evaluation was to calculate the monetary value of the Warm Homes service, with emphasis on health and social care cost savings. While direct calculation of savings was not possible (as noted above), it is possible to develop statistical models that provide an monetary value for some impacts of energy efficiency improvements in homes. In this evaluation we use two models that allow us to produce an economic valuation of the impacts of the Warm Homes Scheme. This approach mirrors that of Threlfall in his work to value the impacts of the Greater Manchester AWARM programme18, which is summarised in Figure 7.1, below. This involves approximating improvements in quality of life based on life years gained as a result of improved physical health; then modelling improvements in quality of life as a result of improved mental wellbeing. Our approach uses a different method for ascertaining improved mental wellbeing, but uses the same method for calculating the quality of life gains for improved physical health. However, we have not combined the two figures derived from these separate sets of modelling as we feel there may well be significant overlap between the two.
Figure 7.1: A pragmatic approach to economic valuation
Source: Threlfall (2011)
7.2.
Estimating and Valuing Improvement in Quality of Life as a Result of
Increased Length of Life
This section provides an estimate of the extension to life for participants in the Warm Homes scheme as a result of physical improvements to their home. The model here is the same as that used by Thelfall (2011), and is based on CRESR's evaluation of
18 Threlfall, D (2011) Understanding the costs and benefits of fuel poverty interventions: A pragmatic economic
the Warm Front programme, a national domestic energy efficiency programme funded by the UK government that ran from 2000 to 2013.
[image:36.595.100.528.214.311.2]The evaluation findings included a calculation for the extension to life for participants in Warm Front.19 Like Threlfall, we then applied these figures to the Warm Homes scheme. The calculations are shown in Table 7.1, below. This model makes a wide range of assumptions, and the impact on an individual will be determined by a number of factors, including the length of time they live in their home following intervention and their age when receiving the intervention. However, it does give some indication of the impact that might be found.
Table 7.1: Extended life as a result of physical interventions
Intervention
Individuals (adults)
Life extenstion
(months) per person Total life extension
(months)
Total life extension (years)
Boiler only 665 0.51 339 28
Insulation only 155 0.26 40 3
Both 35 0.56 20 2
In total then, using this model the Warm Homes scheme is estimated to have 'saved' 33 life years for the adults receiving a physical intervention. We cannot necessarily say this will save the public purse, as an increase in life could of course also lead to increased costs to the NHS, and social security depending on the health and economic circumstances of the individual. And modelling on the cost savings to the public purse of physical health interventions is not yet publicly available.
However, Threlfall does attempt to monetise the value of extended life years by estimating the improved quality of life as a result of increased life. This was achieved by converting the extended life years figure into quality adjusted life year (QALY). A QALY is a measure of the quality and the quantity of life lived by an individual. One QALY is equivalent to one year of perfect health. Any fall in health leads to a reduction in QALYs accrued per year to a level below one. Zero QALYs are accrued for a person who is dead.
Threlfall applies an arbitrary figure of 0.6 QALYs for each additional year of life, based on the fact that the years gained will be at the end of life. This seems generally to be a reasonably logical assumption although there is no clear evidence to support this. However, we have adopted it here as a pragmatic means of deriving a valuation figure, and it also has the benefit of allowing some comparability to the AWARM results should future policy actors or researchers look to do so.
Carrying out this calculation derives a value of 19.9 QALYs. NICE guidance values a QALY at between £20,000 and £30,000. Using the lower value (to avoid overestimation) gives a total monetary value of £399,000 for the extension to life as a result of the scheme (or £466 per adult in the sample). It should be noted however that this monetary value is an economic measure based on 'willingness to pay' of individuals for health improvements, to be used as a barometer for Cost-Benefit Analysis rather than an estimation of any savings or measurable financial benefits to participants.
19
7.3.
Estimating and Valuing Improvement in Quality of Life from Improved
General Wellbeing
This section provides an estimate of the excess risk of common mental disorder (CMD) as a result of the energy efficiency intervention.
Unlike the estimation of extended life years, this methodology also provides an estimate of savings for the NHS and the Exchequer based in changes in mental health. Mental health is measured using the 12-item General Health Questionnaire (GHQ-12) with morbidity measured by quality-adjusted life year (QALYs).
There were three steps in the analysis:
Assess the change in the proportion of respondents reporting a GHQ-12 score of 4 or more before and after the intervention
Calculate the impact of the change in GHQ-12 on QALYs
Calculate the impact of the change in GHQ-12 on savings to the NHS and Exchequer.
Some of the key assumptions underpinning the analysis were that:
That the reductions in CMD risk measured through the survey (a) an accurate reflection of change over the period of a year and (b) are attributable to the scheme and not to other phenomena.
The impact of the energy efficiency intervention are fully realised immediately and last for one year.
Impacts would be commensurate with the best available evidence. For example, unit costs for services were based on standard measures from the Cost of Health and Social Care 2015.20
The model is based on the effect of measured temperature on CMD. This is a relatively conservative assumption and the wider impact on mental health is likely to be greater.
Appendix 3 provides more detail on the model and the assumptions behind this approach, but it is important to note two key limitations to the model:
1. It does not take into account potential direct benefits to physical health: a central basis for the funding for the Warm Homes scheme
2. Figures are based on data relating purely to the impacts of increased household temperature and does not take into account the likely larger impacts of reduced stress and improved finances as a result of reductions in heating costs
Estimates from this model are likely therefore to underestimate improvements in quality of life.
20 Curtis, L. and Burns, A. (2015) Cost of Health and Social Care 2015
7.4.
Findings
Key findings from the initial analysis were that:
The estimated reduction in the number of people with a CMD was 128. Of these 85 were of working age and 43 were of pensionable age.
The total QALY gain was 26.4 years
This led to £793,000 per year of monetary value from QALY gained.
This led on to an assessment of the NHS savings from impact on numbers of individuals with a CMD. These were:
£2,500 of reduced medication costs £21,600 of reduced counselling costs £11,000 of reduced GP costs
£2,800 of reduced outpatient costs £7,100 of reduced inpatient costs.
The combined impact of savings in these areas was £45,000 per year. This equates to £51 per adult included in the sample of 885, or £86 per household. It is important to note again that this relates only to the impacts of mental health change and not overall improvements in health.
Finally the employment, output and fiscal savings from impact on numbers of individuals with a CMD was calculated. This led to:
£178,000 of extra GDP due to higher employment rates (£140 per individual; £340 per household).
£37,700 of extra GDP due to reductions in sickness absence (£30 per individual; £72 per household).
£137,300 of fiscal savings to the Exchequer due to reductions in benefit claims (£108 per individual; £262 per household).
Nb. We have not combined the findings from this model with that for extended life years because we feel there is likely to be overlap between the two.
7.5.
Conclusion
Table 7.2: summary of financial valuation for the Warm Homes service
Valuation Method Value (for
1 year)
Direct financial gains for participants
Energy savings for participants (physical works)
Warm Homes Service delivery partner modelling
£133,632
Cost savings for participants (Warm Homes Discount)
Project monitoring data (actual benefits)
£18,225
Cost savings for participants (Tariff Switching) Project monitoring data (estimated benefits)
£22,925
Benefit maximisation Project monitoring data (actual benefits)
£17,968
Total direct financial gain for participants £192,750
Modelled valuations
Extended Life Years Threlfall (2013) pragmatic
economic valuation model
£399,000
General Wellbeing improvement (QALYs) Estimation of QALYs, valuation modelled using CRESR valuation model
£793,000
General Wellbeing improvement (NHS savings)
Estimation of QALYs, valuation modelled using CRESR valuation model (based only on change to temperature and not other potential impacts of warmer homes)
£45,000
General Wellbeing improvement (Exchequer savings)
Estimation of QALYs, valuation modelled using CRESR valuation model
£137,300
General Wellbeing improvement (GDP uplift) Estimation of QALYs, valuation modelled using CRESR valuation model
8
8.
Conclusions
8.1.
Introduction
Warm Homes Oldham is an innovative project bringing together funding from the CCG, council and housing partners, using a payment-by-results model to deliver the project. In theory this ensured that costs to the Oldham Partners were only incurred on the basis of households being lifted out of fuel poverty.
This report provided findings regarding the extent and nature of outcomes derived from the project. The overall picture is of a positive impact on fuel poverty and health and wellbeing across all demography and socio-economic groups. However, some of these results - notably the changes in GHQ-12 scores and an associated question on life satisfaction - are beyond what would normally be expected of any single public policy intervention and as such need to be treated with some caution.
8.2.
Successes
The results from the evaluation are overwhelmingly positive, albeit with the caveat that the robustness of data might have been improved by access to NHS data and by leaving a longer period between pre- and post-intervention questionnaires.
The scheme was successful in reaching its output targets and compares favourably to many other similar local authority initiatives, especially those focused on health. This can be attributed to th