Original Article
Comparison of structural
genetics of non-schistosoma-associated
squamous cell carcinoma of the urinary bladder
Marina Molitor1, Kerstin Junker2,3,Elke Eltze4,Marieta Toma5, Stefan Denzinger6,Sabine Siegert7,8,Ruth Knuechel1, Nadine T Gaisa1
1Institute of Pathology, RWTH Aachen University, Aachen, Germany; 2Department of Urology,
Friedrich-Schiller-University, Jena, Germany; 3Department of Urology, Saarland University, Homburg, Germany; 4Institute of
Pathology Saarbruecken-Rastpfuhl, Saarbruecken, Germany; 5Institute of Pathology, University Dresden, Dresden,
Germany; 6Department of Urology, University Hospital Regensburg, Regensburg, Germany; 7Institute of Pathology
LMU Munich, Munich, Germany; 8Institute of Pathology Munich-Nord, Munich, Germany Received May 16, 2015; Accepted May 31, 2015; Epub July 1, 2015; Published July 15, 2015
Abstract: Little is known about genetic changes in squamous differentiation of non-schistosomiasis-associated blad-der cancer. Therefore, we investigated pure squamous cell carcinomas (SqCC), squamous parts of mixed urothelial carcinomas with squamous differentiation (MIX) and mere urothelial cancers (UC) for structural genetic differences. Tissue microarray slides (n = 29 SqCC, n = 35 MIX and n = 23 UC) were analyzed by ZytoLight SPEC p16/CEN3/7/17
Quadruple Color Probe fluorescence-in-situ-hybridization (FISH) and DNA was investigated by comparative genomic
hybridization (CGH) (n = 35 SqCCs, n = 40 MIX and n = 36 UC). By FISH the mean number of polysomic cells was
lowest in SqCC (CEN3 P = 0.0498, CEN17 P = 0.0009). A slight tendency of lower copy numbers of chromosomes 3, 7 and 17 and higher numbers of the p16-locus in SqCC (P = 0.45) indicated less aneuploid tumor cells in SqCC
compared to MIX and UC. In CGH SqCC showed the lowest mean number of aberrations per tumor (SqCC 5.37
changes, MIX 6.75 and UC 7.64; P = 0.1754). Significant differences between the three groups were found for loss
of chromosome 3p (P = 0.004), 6q (P = 0.028), 11p (P = 0.024) and gains of 5p (P = 0.020). Loss of 3p was more frequent in SqCC (51.4%) than in MIX (37.5%) or UC (13.9%). To conclude, SqCCs show less polysomy and genetic
alterations than MIX and UC. Loss of 3p is more frequent in SqCC but there are no absolute specific alterations for
each tumor group. Squamous parts of mixed tumors show similar alterations than UC and should be considered as further development of UC, while pure SqCC seem to be a separate tumor group.
Keywords: Bladder cancer, urothelial carcinoma, urothelial carcinoma with squamous differentiation, squamous
cell carcinoma, FISH, CGH
Introduction
Pure squamous cell carcinoma (SqCC) of the urinary bladder comprises less than 5% of all bladder cancers [1-3]. However, it is more
fre-quent in certain subgroups like patients with
chronic inflammation, urinary tract calculi or
chronic bladder outlet obstruction, and in patients with spinal cord injury [1, 2, 4]. Additionally, higher numbers of SqCC were reported in regions with endemic schistosomia-sis [5, 6]. According to the 2004 World Health Organization classification of bladder cancer
the diagnosis of squamous cell carcinoma is reserved for tumors with complete squamous
differentiation without any other tumor compo-nent including urothelial carcinoma in situ [3].
Indeed, histologically identifiable focal squa -mous differentiation in high grade urothelial
carcinoma is a quite frequent finding reported
in literature in up to 50% of tumors [7]. Additionally, recent advances in whole genome
expression profiling revealed a subtyping of muscle invasive bladder cancer (MIBC) into
breast cancer-like basal and luminal types, with
identification of a “basal/squamous-like” sub -type [8-10]. These cancers express higher lev-els of high molecular weight keratins (KRT5,
KRT6, KRT14) and EGFR [8, 9], show an inva
surviv-Table 1. Characteristics of the multicentric tumor cohort (classified according to the results of Gaisa
et al., 2011 [15])
ID classification center samplingyear of sex age tumor grade pT pN L V R
1 MIX Aachen 2004 M 77 3 2 0 0 0 0
2 UC Aachen 2005 M 72 3 2 0 0 0 0
3 SqCC Aachen 2003 F 47 2 3 0 N/A N/A 0
5 SqCC Aachen 2005 M 78 3 3 N/A N/A N/A N/A
7 MIX Aachen 2006 F 66 3 3 0 N/A 1 0
10 SqCC Aachen 2005 F 81 3 4 0 N/A 1 1
11 SqCC Aachen 2006 F 63 3 3 N/A N/A N/A 0
12 MIX Aachen 2006 M 53 3 4b 2 1 N/A 0
22 UC Aachen 2004 M 64 2 3 0 1 0 0
24 UC Aachen 2006 M 77 3 3b 2 1 1 0
29 SqCC Aachen 2004 F 82 3 2 N/A N/A N/A N/A
30 UC Aachen 2005 M 58 3 2 0 0 0 0
32 UC Aachen 2006 F 84 3 2b 0 1 1 0
33 UC Aachen 2005 M 60 3 3 0 0 0 0
34 UC Aachen 2008 F 56 3 4a 1 0 0 x
35 UC Aachen 2008 M 82 3 2 N/A N/A N/A N/A
36 MIX Aachen 2004 F 35 3 3 N/A 0 0 1
39 SqCC Aachen 2006 F 57 2 3 0 0 0 0
41 SqCC München 2008 F 63 3 3a 0 1 1 0
43 UC Aachen 2003 M 77 2 3 0 1 0 0
44 UC Aachen 2006 M 76 3 3a 2 1 1 1
45 UC Aachen 2009 M 78 3 4a 1 1 1 1
46 UC Aachen 2006 M 94 3 3a N/A 0 1 0
47 UC Aachen 2004 M 48 3 3 0 0 0 0
56 MIX München 2008 F 47 2 2 0 0 0 0
62 MIX Aachen 2005 M 58 3 3 0 0 0 0
66 UC Aachen 2007 F 76 3 3 N/A 0 1 0
70 UC Aachen 2009 M 72 3 2b 0 0 0 0
71 UC Aachen 2005 M 74 3 2b 0 0 0 0
77 MIX Aachen 2005 M 60 3 3 0 0 0 0
38 UC Aachen 2005 M 60 3 3 0 0 0 0
78 UC Aachen 2006 M 70 3 4 3 1 0 1
80 MIX Aachen 2003 M 77 2 3 0 1 0 0
88 MIX Aachen 2007 F 76 3 3 N/A 0 1 0
89 MIX München 2007 F 71 3 3 N/A 0 0 0
90 MIX Aachen 2008 F 70 3 3 0 0 0 0
91 SqCC Aachen 2003 F 77 3 3 N/A N/A N/A N/A
98 SqCC Regensburg 2007 F 79 3 2 N/A N/A N/A N/A
102 SqCC Regensburg 2007 F 53 3 2 N/A N/A N/A N/A
107 SqCC Regensburg 1999 F 76 2 2 N/A N/A N/A 0
110 MIX Regensburg 2007 F 76 3 2 N/A N/A N/A N/A
113 MIX Regensburg 1994 F 71 2 2 N/A N/A N/A N/A
117 SqCC Regensburg 2005 M 49 3 3b 0 0 0 0
120 MIX Regensburg 2004 M 75 3 2 N/A N/A N/A N/A
[image:2.612.91.518.96.724.2]125 MIX Regensburg 2002 F 76 3 3 0 N/A N/A 0
129 MIX Regensburg 2007 F 80 3 3a 1 1 1 0
132 SqCC Regensburg 2001 M 80 3 4 N/A N/A N/A N/A
135 SqCC Regensburg 2001 F 57 3 3 0 N/A N/A 1
136 SqCC Dresden 2003 M 82 3 3a 0 N/A N/A 0
138 MIX Dresden 2006 F 81 3 3b 0 0 0 1
141 MIX Dresden 2006 F 87 3 2a 0 N/A N/A 0
143 UC Dresden 2005 M 71 3 3b 0 1 1 0
146 MIX Dresden 2004 F 68 3 3a 0 N/A 1 0
148 MIX Dresden 2004 F 68 3 3b 2 1 0 0
150 MIX Dresden 2005 M 68 2 3a 0 1 0 N/A
152 MIX Dresden 2005 M 82 3 3b N/A 1 1 0
154 MIX Dresden 2006 F 84 3 3b 1 1 0 0
156 MIX Dresden 2006 M 52 3 3a 0 0 0 0
158 MIX Dresden 2001 F 80 2 3a 0 N/A N/A 0
160 MIX Dresden 2002 M 78 3 3b 0 N/A N/A 0
162 MIX Dresden 2002 M 61 3 3a 0 N/A N/A 0
163 MIX Dresden 2004 F 80 3 3b 2 1 0 0
167 SqCC Münster 2002 F 65 2 4 0 N/A N/A 0
170 SqCC Münster 2003 M 58 2 3 2 N/A N/A 1
173 MIX Münster 2003 F 62 3 3 N/A N/A N/A N/A
179 UC Münster 2003 M 68 2 2 0 N/A N/A N/A
180 MIX Münster 2003 M 68 2 2 0 N/A N/A N/A
182 SqCC Münster 2003 M 75 2 4 0 N/A 1 0
186 MIX Münster 2003 F 34 3 3b 0 N/A N/A 0
189 SqCC Münster 2003 F 43 2 3a 0 N/A N/A 0
195 MIX Münster 2003 M 65 3 3a 1 N/A N/A 0
197 SqCC Münster 1993 M 68 2 3b 0 N/A N/A N/A
199 SqCC Münster 1995 M 60 3 3b N/A N/A N/A 0
201 MIX Münster 1996 M 60 3 3b 0 1 N/A 0
206 SqCC Münster 1998 M 50 3 4b N/A N/A N/A 1
208 SqCC Münster 1999 M 69 3 3b 0 N/A N/A N/A
210 SqCC Münster 1999 M 34 3 3b 1 N/A N/A 0
212 MIX Münster 1999 F 68 3 3b N/A N/A N/A 0
214 MIX Münster 1999 M 59 3 3a 0 N/A N/A 0
217 MIX Münster 1999 F 74 3 4a 0 N/A N/A N/A
220 SqCC Münster 2000 F 61 2 3b N/A N/A N/A 0
222 MIX Münster 2002 M 74 3 3b N/A N/A N/A 0
224 SqCC Münster 2002 F 62 3 3a 0 N/A N/A 0
226 SqCC Münster 2002 M 75 2 3a 2 1 1 0
229 SqCC Münster 2002 M 63 2 2b 0 N/A N/A 0
231 SqCC München 2005 M 70 3 3b 0 N/A N/A N/A
233 MIX München 2005 F 88 3 3a 0 N/A N/A N/A
236 SqCC München 2006 F 64 2 3a N/A 1 N/A N/A
238 SqCC München 2006 M 62 3 2b 0 N/A N/A 0
240 SqCC München 2007 M 55 2 3a 0 N/A N/A 0
242 SqCC München 2007 F 58 2 2b 0 0 0 0
247 MIX Aachen 2008 F 79 3 4 0 0 1 0
al but are indifferent from conventional high grade urothelial carcinoma on hematoxylin eosin-based routine histological evaluation. In this context, there is a need to better under-stand mere squamous differentiation and par-tial squamous differentiation especially in non-schistosoma-associated bladder cancers, to draw further conclusions and consequences of
a “basal/squamous-like” subtype. However,
previous studies on genetic aberrations in SqCC either focused on schistosomiasis-asso-ciated tumors [11, 12], hardly separated schis-tosomiasis-associated and non-schistosomia-sis-associated SqCC or compared SqCC and squamous parts of mixed urothelial/squamous cancers in single cases only [13]. The most comprehensive study of structural genetic data on schistosoma- and non-schistosoma-associ-ated SqCC and UC by El-Rifai et al. suggested different genetic pathways for these tumors due to varying gains and losses of chromo-somes [14], but a detailed analysis of non-schistosoma-associated SqCC and the squa-mous part of mixed urothelial/squasqua-mous can-cers (MIX) is also lacking. In a previous study our workgroup has evaluated squamous differ-entiation in bladder cancers [15], and precisely immunophenotyped a cohort of patients with non-schistosomiasis-associated pure SqCC of the urinary bladder and mixed urothelial and
squamous cancers. Given the paraffin material
and histopathological data of this cohort, the aim of the study presented here was to evalu-ate the structural genetic changes of the three
bladder cancer subtypes non-schistosomiasis-associated squamous carcinoma of the blad-der (SqCC), mixed urothelial carcinoma with partial squamous differentiation (MIX) and pure
urothelial carcinoma (UC) by fluorescence in
situ hybridization and comparative genomic hybridization.
Materials and methods
Specimens and preparations
Retrospectively diagnostic formalin-fixed paraf
-fin tissues (FFPE) from six Institutes of
Pathology in Germany were collected. Cases were recruited between 1993 and 2009. In total we collected n = 35 pure squamous cell carcinoma (SqCC) and n = 40 mixed UC/SqCC (MIX). In a prior study of our workgroup tissue microarrays (TMAs) of these samples have been constructed and immunohistochemically evaluated [15]. For analysis of MIX tumors we
used the squamous cell tumor part (completely positive for KRT5/6 and KRT5/14, but negative for KRT20) [15]. Additionally, n = 36 urothelial carcinomas (UC) from Aachen and Jena served as a control group. The age of the tissue blocks
as well as the formalin concentrations, fixation times and paraffin composition among the
samples were highly variable. An overview of cases is shown in Table 1.
Approval of the local ethics committee for
retro-spective use of diagnostic FFPE tissue was
256 MIX Aachen 2005 M 72 3 3 0 1 1 0
259 SqCC Aachen 2008 F 54 3 4 0 N/A 0 N/A
J60 UC Jena 1996 M 68 3 2 N/A N/A N/A N/A
J66 UC Jena 1997 M 56 3 3 N/A N/A N/A N/A
J101 UC Jena 2001 M 67 3 3 2 N/A N/A N/A
J108 UC Jena 1997 M 58 3 3 N/A N/A N/A N/A
J135 UC Jena 1996 W 82 3 2 N/A N/A N/A N/A
J139 UC Jena 1996 M 57 2 3 N/A N/A N/A N/A
J143 UC Jena 1996 M 69 3 3 N/A N/A N/A N/A
J178 UC Jena 1997 M 72 3 2 N/A N/A N/A N/A
J223 UC Jena 1996 W 69 3 2 N/A N/A N/A N/A
J224 UC Jena 1996 M 71 3 2 N/A N/A N/A N/A
J228 UC Jena 1996 M 66 3 2 N/A N/A N/A N/A
J311 UC Jena 1999 M 58 3 2 N/A N/A N/A N/A
J381 UC Jena 1997 M 66 3 3 N/A N/A N/A N/A
J578 UC Jena 1997 M 66 3 2 2 N/A N/A N/A
obtained (RWTH Aachen EK 9/12). Paraffin slides of TMAs were used for FISH, and DNA was extracted from paraffin slides of the resid -ual tissue blocks after careful man-ual
microdis-section of tumor areas under a stereomicro-scope using standard QiAampTM DNA Mini Kit
(Qiagen, Hilden, Germany) according to the
[image:5.612.303.521.69.503.2]manufacturer’s orders.
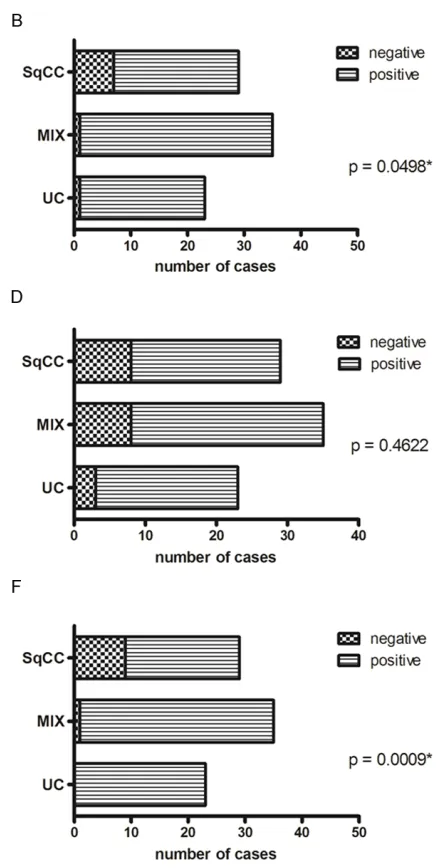
Figure 1. Evaluation of tumor cell polysomy. A. Numbers of polysomic tumor cells of SqCC, MIX and UC regarding chromosome 3 (CEN 3 red). Cut off level is indicated by a horizontal broken line, mean is represented by a horizontal
continuous line. NC = normal control. B. Categorization of
tumors in negative (= diploid/normal) and positive (= poly-somic) cases regarding polysomy of CEN3. C. Numbers of polysomic tumor cells of SqCC, MIX and UC regarding chro-mosome 7 (CEN 7 green). D. Categorization of tumors in negative (= diploid/normal) and positive (= polysomic) cas-es regarding polysomy of CEN7. E. Numbers of polysomic tumor cells of SqCC, MIX and UC regarding chromosome
17 (CEN 17 blue). F. Categorization of tumors in negative (=
Fluorescence in situ hybridization (FISH)
FISH was performed on 5 µm paraffin-slides of
TMAs carrying both tumor and reference cores. ZytoLight SPEC p16/CEN3/7/17 Qua-
druple Color Probes (Zytovision, Bremerhaven,
Germany) was used according to the
manufac-turer’s protocol and standard in-house modifi
-cations for pretreatment of tissue sections. Signals were detected with an Axiovert S100
Fluorescence Microscope (Carl Zeiss, Ober-kochen, Germany), suitable filter sets and DISKUS software (Hilgers, Technisches Buero,
Koenigswinter, Germany).
For each TMA hybridization efficacy was evalu
-ated on normal urothelium reference cores and for each patient signals of 50 tumor cell nuclei were counted. Polysomy of tumour cells was determined by a cut-off value in normal tissue cells according to the literature: mean number of polysomic cells + (standard deviation x 3). All
cells with ≥3 signals were assumed to be poly
-somic [16].
Comparative genomic hybridization (CGH)
Due to highly variable DNA quality and subse-quent problems in probe preparation for
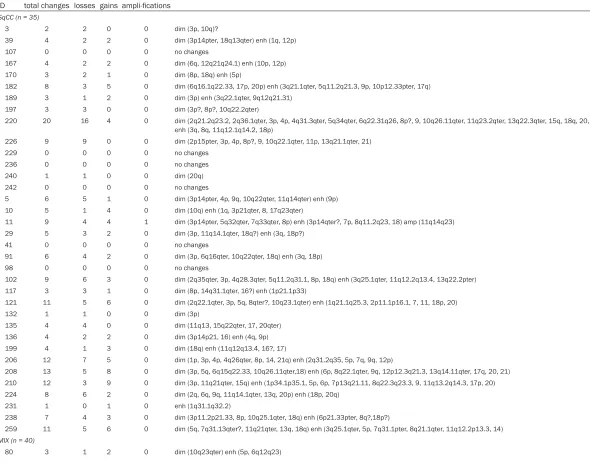
[image:6.612.89.526.74.522.2]Table 2. All structural chromosomal aberrations detected with CGH ID total changes losses gains ampli-fications
SqCC (n = 35)
3 2 2 0 0 dim (3p, 10q)?
39 4 2 2 0 dim (3p14pter, 18q13qter) enh (1q, 12p) 107 0 0 0 0 no changes
167 4 2 2 0 dim (6q, 12q21q24.1) enh (10p, 12p) 170 3 2 1 0 dim (8p, 18q) enh (5p)
182 8 3 5 0 dim (6q16.1q22.33, 17p, 20p) enh (3q21.1qter, 5q11.2q21.3, 9p, 10p12.33pter, 17q) 189 3 1 2 0 dim (3p) enh (3q22.1qter, 9q12q21.31)
197 3 3 0 0 dim (3p?, 8p?, 10q22.2qter)
220 20 16 4 0 dim (2q21.2q23.2, 2q36.1qter, 3p, 4p, 4q31.3qter, 5q34qter, 6q22.31q26, 8p?, 9, 10q26.11qter, 11q23.2qter, 13q22.3qter, 15q, 18q, 20, 21q) enh (3q, 8q, 11q12.1q14.2, 18p)
226 9 9 0 0 dim (2p15pter, 3p, 4p, 8p?, 9, 10q22.1qter, 11p, 13q21.1qter, 21) 229 0 0 0 0 no changes
236 0 0 0 0 no changes 240 1 1 0 0 dim (20q) 242 0 0 0 0 no changes
5 6 5 1 0 dim (3p14pter, 4p, 9q, 10q22qter, 11q14qter) enh (9p) 10 5 1 4 0 dim (10q) enh (1q, 3p21qter, 8, 17q23qter)
11 9 4 4 1 dim (3p14pter, 5q32qter, 7q33qter, 8p) enh (3p14qter?, 7p, 8q11.2q23, 18) amp (11q14q23) 29 5 3 2 0 dim (3p, 11q14.1qter, 18q?) enh (3q, 18p?)
41 0 0 0 0 no changes
91 6 4 2 0 dim (3p, 6q16qter, 10q22qter, 18q) enh (3q, 18p) 98 0 0 0 0 no changes
102 9 6 3 0 dim (2q35qter, 3p, 4q28.3qter, 5q11.2q31.1, 8p, 18q) enh (3q25.1qter, 11q12.2q13.4, 13q22.2pter) 117 3 3 1 0 dim (8p, 14q31.1qter, 16?) enh (1p21.1p33)
121 11 5 6 0 dim (2q22.1qter, 3p, 5q, 8qter?, 10q23.1qter) enh (1q21.1q25.3, 2p11.1p16.1, 7, 11, 18p, 20) 132 1 1 0 0 dim (3p)
135 4 4 0 0 dim (11q13, 15q22qter, 17, 20qter) 136 4 2 2 0 dim (3p14p21, 16) enh (4q, 9p) 199 4 1 3 0 dim (18q) enh (11q12q13.4, 16?, 17)
206 12 7 5 0 dim (1p, 3p, 4p, 4q26qter, 8p, 14, 21q) enh (2q31.2q35, 5p, 7q, 9q, 12p)
208 13 5 8 0 dim (3p, 5q, 6q15q22.33, 10q26.11qter,18) enh (6p, 8q22.1qter, 9q, 12p12.3q21.3, 13q14.11qter, 17q, 20, 21) 210 12 3 9 0 dim (3p, 11q21qter, 15q) enh (1p34.1p35.1, 5p, 6p, 7p13q21.11, 8q22.3q23.3, 9, 11q13.2q14.3, 17p, 20) 224 8 6 2 0 dim (2q, 6q, 9q, 11q14.1qter, 13q, 20p) enh (18p, 20q)
231 1 0 1 0 enh (1q31.1q32.2)
238 7 4 3 0 dim (3p11.2p21.33, 8p, 10q25.1qter, 18q) enh (6p21.33pter, 8q?,18p?)
259 11 5 6 0 dim (5q, 7q31.13qter?, 11q21qter, 13q, 18q) enh (3q25.1qter, 5p, 7q31.1pter, 8q21.1qter, 11q12.2p13.3, 14)
MIX (n = 40)
150 4 4 0 0 dim (9, 10q24.2qter, 11, 17p) 158 4 4 0 0 dim (6p?, 15q22qter, 17p, 20)
180 21 13 8 0 dim (1p, 2p, 2q34qter, 3p, 4p, 4q26qter, 5q, 10q23.31q25.3, 11p, 11q23.1qter, 17p, 18q, 20p) enh (5p, 6p, 6q21q24, 7p, 8p, 10p, 11q12.1q14.1, 20q)
56 5 3 2 0 dim (3p12p14, 7q, 10q21qter?) enh (3q, 7p) 113 0 0 0 0 no changes
1 8 5 3 0 dim (2p?, 2q33qter, 8p, 11q23qter, 16q21qter) enh (1p12p31, 8q11.22q23.1, 12q14q21) 6 0 0 0 0 no changes
12 13 6 7 0 dim (3p, 8p, 9p13pter, 10q22.2q23, 11p, 11q23qter) enh (1q21qXq31.3, 5p13.2p14.3, 6q22.3qter, 7q?, 8q21.1qter, 9q?, 10p11.2p13) 62 0 0 0 0 no changes
88 5 1 4 0 dim (11q14qter) enh (1q, 3q26qter, 7p12.2q32, 8q23.1qter)
90 8 6 2 0 dim (3p?, 6p21p22?, 9q22.3qter, 10q22qter, 15q22qter, 18q?) enh (5p, 8q)
110 16 5 11 0 dim (3p14.1p24, 6p, 11p, 16q, 17q24.2pter) enh (1q, 2p11.2p21, 3q, 4q13.2q24, 5q11.2q14.2, 6q, 8q23.1qter, 10p, 12p, 16p, 20q) 120 7 1 6 0 dim (3p12.2p23) enh (1q12q32.2, 3q, 5p?, 7, 8q, 9)
125 6 6 0 0 dim (3p14.3p21.3, 10q21.1qter, 11q12.3q13.4?, 16, 17p?, 20q)
148 9 6 3 0 dim (3p14.1pter, 10q22.1qter, 15q22.1qter, 16, 17p, 20) enh (3p14.1qter, 5p, 9q21.3qter)
152 10 9 1 0 dim (2q36.1qter, 3p12.1p21.32, 4q, 5q, 7q32.3qter, 11q22.3qter, 15q22.1qter, 16p, 20q13.12qter) enh (5p) 154 4 2 2 0 dim (8p, 16?) enh (1? oder 1p33q31.3, 12q21.1q23.2)
156 0 0 0 0 no changes
160 7 3 3 1 dim (9q22.3qter, 16p, 17q25.1pter) enh (1p32q32, 3q, 5p) amp (12p)
162 10 7 3 0 dim (1q31.3qter, 2q34qter, 3p14.1p22.1, 9q31.1qter, 1q24.2qter, 15q22.1qter, 16q) enh (11q14.1q24.1, 13q21.1qter, 18p) 173 11 8 3 0 dim (1?, 2?, 4q28qter, 10q, 11p, 11q21qter, 15q, 18q) enh (5p, 8q21.1qter, 18p)
195 8 4 4 0 dim (3p, 3q12.3q21.2, 4, 5q) enh (2q23.2q33.2, 6p21.31pter, 1p14.1q12.1, 12p) 214 5 1 4 0 dim (18q) enh (5p, 7q12.1q21.12, 17p, 20)
233 8 3 5 0 dim (5q32qter, 6p, 9q21.13qter, 18q) enh (3q26.2qter, 8q, 10p, 12p, 20?) 252 6 0 6 0 enh (1q, 7?, 12, 16?, 17?, 20)
256 5 3 2 0 dim (6q22.1qter, 10q25.1qter, 13q31.1) enh (3q24qter?, 10p)
186 8 8 0 0 dim (2q34qter, 3p11.1p21.3, 4q21.22qter, 5q, 7q22.2qter, 11q21qter, 13q12.11q21.1, 18q21.31qter) 201 10 7 3 0 dim (4p, 5q32qter, 8p, 9, 10q25.1qter, 11p, 21q) enh (5p, 8q, 17p)
212 4 2 2 0 dim (8p, 10q25.1qter) enh (8q, 11q) 222 5 5 0 0 dim (1p, 9q, 10q, 14q, 18q)
247 14 5 9 0 dim (5q, 6q, 10q?, 11p?, 18q) enh (6p, 8q21.3qter, 9p13.3q22.2, 11q12.1q13.5, 12p11.22q12.3, 14q23.2q31.3, 17q, 18p, 20) 36 1 0 1 0 enh (5p?)
77 3 2 1 0 dim (2q35qter, 3p) enh (5p) 89 0 0 0 0 no changes
129 8 3 4 1 dim (3p12p24, 5q31qter, 18q) enh (5p, 8, 12, 13q14.3q31.3) amp (11q21q23.1)
138 14 9 5 0 dim (3q24pter, 4q23qter, 5q32qter, 6q, 7p11.2q21.3, 10q25.1qter, 11q14.1qter, 17p, 18q) enh (1p31.1q24.3, 3q26.1qter, 5p, 7p14.1pter, 17q) 141 5 3 2 0 dim (8p, 16, 18q) enh (3q?, 8q)
UC (n = 36)
143 0 0 0 0 no changes
J60 10 4 6 0 dim (2q32qter, 5q, 11p12pter,12p,Y) enh (3, 5p, 8q21.3q22.3,
J135 17 9 7 1 dim (2q14.2, 4p, 6q, 8p12pter, 11p, 13q13q31.3, 14q21qter, 16p, 18q) enh (1p31p1q32.2, 3q, 4q?, 5p, 7, 16q22.1qter, 18p, 20q) amp (8q23) J178 16 7 9 0 dim(1p, 2q36qter, 5q, 6q, 8p, 10q, 18q) enh(1q, 5p, 6p22p24, 9p, 10p12pter, 13q31qter, 17q23.2qter, 18p, 20q)
J223 9 3 6 0 dim (8p, 11q23qter, 18q21qter?) enh(3q24qter, 6p22pter, 8q, 9, 11p?, 18q, 14q) J224 4 3 1 0 dim (2q36qter, 10q, 11q22qter) enh(6p23pter)
J228 0 0 0 0 no changes J578 0 0 0 0 no changes J311 0 0 0 0 no changes
J66 3 1 2 0 dim (6q) enh(8q21.1qter, 11q14.3qter) J101 0 0 0 0 no changes
J108 7 2 5 0 dim(4q32.1qter,12q21qter), enh(1q21q31,2q,3p25pter,5p,18p) J143 5 2 3 0 dim (6p22pter, 17p) enh (3q25q26, 8q, 9p23pter)
J139 6 4 1 1 dim (4q31qter, 9, 15q22qter, 17p, Y) enh(7) amp(10q22q23) J381 8 4 4 0 dim (4p, 5q11.2q23, 8p, 18q) enh(5p, 8q, 10q25qter, 20) 43 4 1 3 0 dim (10q22.2qter) enh (6q12q33, 8q, 17q)
66 3 1 2 0 dim (8p) enh (5p, 10q23.1q24.1) 45 5 3 2 0 dim (9?, 10q21.3qter, 18q) enh (8, 13q)
179 15 12 3 0 dim (2q32.1qter, 3p12p24, 4p, 5q, 8p21pter, 10q, 11p, 11q23.1qter, 13q, 17p, 18q, 20p) enh (5p, 6q24pter, 10q) 22 16 9 7 0 dim (3p?, 4p, 5q14.3q22.2, 6q14.1qter, 7p, 8p, 9q, 11p, 18q) enh (3q, 11q12.3q14.3, 12q12q21.33, 16, 17q, 18p, 20q)
24 20 12 8 0 dim (2p22.3pter, 2q22.3q32.3, 4p, 4q32.3qter, 5q, 6q, 9p?, 9q, 10q24.2qter, 11p, 16p, 17p) enh (3q, 5p, 8q21.3q23.3, 11q12.1q14.1, 16q, 17q11.1q23.2, 20)
29 17 10 7 0 dim (2q14.1q24.3, 4p, 5q12.1q21.1, 5q33.2qter, 6q, 9q, 10q, 11p, 13q, 17p) enh (8q, 10p, 11q11q13.3, 12q11q21.33, 17q, 20)
2 21 11 10 0 dim (1q31.1qter, 4p, 5q, 6q12q23.2, 8p, 9p, 9q, 10q24.2qter, 11p, 16q, 18q) enh 2q11.2q22.3, 3p24.1pter, 3q13.33q26.33, 4q31.1q34.2, 5p, 6q23.2qter, 7p12.1q31.33, 10p, 16p, 18p)
30 10 6 4 0 dim (3p13p24.1, 8p, 16p, 17p, 18q, 20p) enh (2q32.1q35, 8q21.13qter, 10p, 12p11.1p13.31) 78 6 3 3 0 dim (8q23.1qter, 9, 14q) enh (1q, 2p16, 17q)
77 7 4 3 0 dim (10q13.1qter, 15q21.1qter, 16p, 17p) enh (5p, 18p, 20p) 71 4 1 3 0 dim (6q) enh (1q23.2q31.3, 5p, 18q)
70 6 2 3 1 dim (11pX, 17p) enh (3q, 8q21.1qter, 10p) amp(12q14.1q23.1)
47 11 5 6 0 dim (4q21.1qter, 6q, 7q21.3qter, 8p, 16q) enh (1q, 7p-q21.3, 8q22.2qter,9p, 10p, 17q) 46 3 1 2 0 dim (3p?) enh (3q26.2qter, 17q24.3qter)
44 7 4 3 0 dim (1p, 3p24.3, 6q, 8p, 11p) enh (8q, 17q, 18p) 45 3 3 0 0 dim (10q, 11q22.3, 15q?)
35 5 3 2 0 dim (4q31.3qter, 8p, 9q) enh (8q, 20p)
32 9 7 2 0 dim (4q24qter, 5q32qter, 7p, 9p, 113q12.11q21.33, 17p, 18q) enh (10p, 18p)
33 13 2 11 0 dim (2q34qter, 18q21.2qter) enh (1q42.3qter, 3q13.11q13.33, 7?, 8q11.22q23.3, 10q, 17, 18p, 20) 34 5 5 0 0 dim (4?, 5q, 6q, 10q, 12q14.1q23.1)
CGH we performed traditional CGH in order to
investigate as much cases as possible.
Amplification of DNA via degenerate oligonucle
-otide-primed-polymerase chain reaction (PCR) and Taq-polymerase primed-PCR, labeling with biotin-16-dUTP for tumor-DNA and digoxigenin-11-dUTP for reference-DNA as well as hybridiza-tion and detechybridiza-tion were performed as described earlier [17]. Analysis included ten to fifteen
metaphase-chromosomes per case. Statistical analysis
Statistical analysis using Fisher’s exact test,
1-way ANOVA-test and unbound t-Test was per-formed with the GraphPad software (GraphPad Software, Inc., La Jolla, California, USA). Numbers are presented as frequencies and percentages. A P-value of less than 0.05 was
considered significant.
Results
Polysomy of tumor cells evaluated by FISH
For FISH-analysis n = 29 pure SqCC, n = 35 MIX
and n = 23 UC could be successfully analyzed.
Due to a low hybridization efficiency of tissue
sections (<0.9) it was not possible to analyze deletions (p16-probe (gold)) with reasonable accuracy. Therefore, we only focused on poly-somy of CEN3 (red), CEN7 (green) and CEN17
(blue). Cells with ≥3 signals were assumed to
be polysomic, and according to the formula: cut off = mean number of polysomic cells + (stand-ard deviation × 3), the calculated cut-offs in
normal cells for CEN3 (red) were 2.13, and for CEN7 (green) and CEN17 (blue) were 1.175 each. All three tumor groups showed similar variations regarding the number of polysomic cells in all probes (Figure 1). Constantly, the mean number of polysomic cells in SqCC was lower, indicating less aneuploid tumor cells in
SqCC compared to MIX and UC. Significant
differences of polysomic and non-polysomic cases within the three groups were only found for the CEN3-probe (red) (P = 0.0498) and the CEN17-probe (aqua) (P = 0.0009).
Differences of chromosome/locus copies among UC, MIX and SqCC
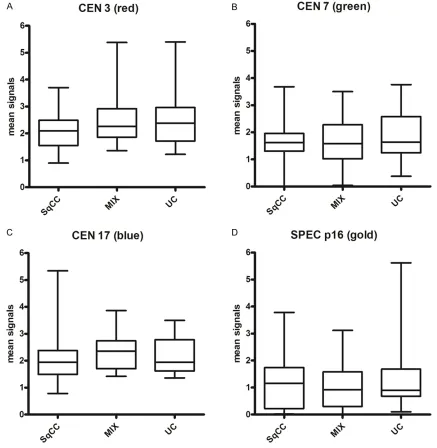
Of all tumors 50 tumor cell nuclei were evalu-ated for each probe; the mean results are shown in Figure 2. Means of the three tumor groups of the CEN3-probe (red) and the CEN17-probe (blue) varied around 2, the CEN7-CEN17-probe (green) was slightly below 2 and the means of the SPEC p16-probe (gold) was around 1. There was a slight tendency of lower copy numbers of chromosomes 3, 7 and 17 and higher numbers of the p16-locus in SqCC compared to UC and
MIX, but there was no significant statistical
difference among the three tumor groups (P = 0.45).
CGH of UC, MIX and SqCC
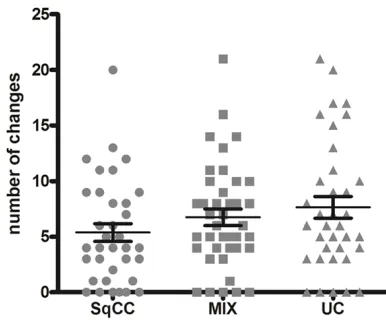
CGH was successfully performed on n = 35
SqCC, n = 40 MIX and n = 36 UC samples. Structural genomic variations were found in n = 30 SqCC (85.7%), n = 35 MIX (87.5%) and n = 32 UC samples (88.9%). Table 2 depicts all variations (Table 2). SqCC showed the lowest number of variations/tumor (mean = 5.37, standard error of the mean (SEM) 0.80, 95%
confidence interval of the mean (CI) 3.75-6.99);
MIX tumors had a mean of 6.75 changes/tumor (SEM 0.74, CI 5.25-8.25) and UC exhibited most changes with a mean of 7.64 changes/ tumor (SEM 0.98, CI 5.65-9.63; P = 0.1754, Figure 3).
Chromosomal variations of organ confined tumor stages (pT2) versus advanced tumor stages (pT3-4)
In SqCCs mean number of changes increased with extravesical tumor stage (pT2 tumors: mean 3, SEM 1.48, CI-0.62-6.62; pT3-4 tumors:
mean 5.964, SEM 0.90, CI 4.12-7.81). However,
the case numbers for stages pT2 were low, and
the difference was not statistically significant
[image:10.612.90.283.71.231.2](P = 0.1386). In MIX and UC no increase of
Figure 3. Mean of chromosomal aberrations for each
tumor group in CGH. Each sample is represented by
changes with tumor stage could be found (MIX pT2: mean 8.9, SEM 2.72, CI 2.20-15.51; MIX pT3-4: mean 6.3, SEM 0.70, CI 4.88-7.72; P =
[image:11.612.90.523.81.655.2]0.1953; UC pT2: mean 9.2, SEM 1.60, CI 5.79-12.56; UC pT3-4: 6.3, SEM 1.14, CI 3.88-8.65; P = 0.14).
Table 3. Gains and losses of short and long arms of chromosomes for each tumor group
Chr. arm
SqCC (n = 35) MIX (n = 40) UC (n = 36)
losses gains losses gains losses gains
n % n % n % n % n % n %
1p 1 2.9 2 5.7 3 7.5 4 10 2 5.5 1 2.8
1q 0 0 4 11.4 2 5 7 17.5 1 2.8 6 16.7
2p 1 2.9 1 2.9 3 7.5 1 2.5 1 2.8 1 2.8
2q 4 11.4 1 2.9 7 17.5 1 2.5 8 22.2 3 8.3
3p 18 51.4 2 5.7 15 37.5 1 2.5 5 13.9 3 8.3
3q 0 0 7 20 2 5 10 25 0 0 10 27.8
4p 4 11.4 0 0 3 7.5 0 0 8 22.2 0 0
4q 3 8.6 1 2.9 7 17.5 1 2.5 7 19.4 2 5.5
5p 1 2.9 4 11.4 0 0 16 40 0 0 11 30.6
5q 5 14.3 1 2.9 10 25 1 2.5 10 27.8 0 0
6p 0 0 3 8.6 4 10 3 7.5 1 2.8 3 8.3
6q 6 17.1 0 0 3 7.5 5 12.5 11 30.6 1 2.8
7p 0 0 3 8.6 1 2.5 5 12.5 2 5.5 5 13.9
7q 2 5.7 3 8.6 3 7.5 4 10 1 2.8 3 8.3
8p 9 25.7 1 2.9 6 15 2 5 12 33.3 1 2.8
8q 1 2.9 7 20 0 0 13 32.5 1 2.8 15 41.7
9p 2 5.7 4 11.4 4 10 2 5 6 16.7 4 11.1
9q 2 5.7 4 11.4 7 17.5 3 7.5 8 22.2 1 2.8
10p 1 2.9 2 5.7 0 0 5 12.5 0 0 8 22.2
10q 9 25.7 0 0 17 42.5 0 0 11 30.6 3 8.3
11p 1 2.9 1 2.9 9 22.5 1 2.5 9 25 1 2.8
11q 7 20 6 17.1 12 30 4 10 3 8.3 4 11.1
12p 0 0 4 11.4 0 0 7 17.5 1 2.8 1 2.8
12q 1 2.9 0 0 0 0 3 7.5 2 5.5 2 5.5
13p 0 0 0 0 0 0 0 0 0 0 0 0
13q 4 11.4 2 5.7 2 5 2 5 4 11.1 3 8.3
14p 1 2.9 1 2.9 0 0 0 0 0 0 0 0
14q 2 5.7 1 2.9 1 2.5 1 2.5 2 5.5 2 5.5
15p 0 0 0 0 0 0 0 0 0 0 0 0
15q 3 8.6 0 0 7 17.5 0 0 3 8.3 0 0
16p 2 5.7 1 2,9 7 17.5 2 5 4 11.1 2 5.5
16q 2 5.7 1 2.9 6 15 1 2.5 2 5.5 3 8.3
17p 2 5.7 2 5.7 7 17.5 3 7.5 9 25 1 2.8
17q 1 2.9 4 11.4 2 5 4 10 0 0 10 27.8
18p 1 2.9 7 20 0 0 4 10 0 0 9 25
18q 10 28.6 1 2.9 11 27.5 0 0 11 30.6 1 2.8
20p 3 8.6 3 8.6 3 7.5 4 10 2 5.5 6 16.7
20q 3 8.6 4 11.4 4 10 6 15 0 0 7 19.4
21p 1 2.9 1 2.9 0 0 0 0 0 0 0 0
21q 4 11.4 1 2.9 1 2.5 0 0 0 0 0 0
Chromosomal variations and tumor grading
Correlations with tumor grade showed in all tumor groups the same trend of increasing genetic changes in less differentiated G3 tumors compared to G2 tumors. In SqCCs G2 tumours harboured a mean of 4.1 changes (SEM 1.44, CI 0.96-7.18), whereas G3 tumours showed a mean of 6.2 changes (SEM 0.90, CI 4.37-8.11; P = 0.186). In mixed tumors there were 6.2 changes in G2 tumors (SEM 3.05, CI -1.67-14) and 6.9 changes in G3 tumors (SEM 0.72, CI 5.39-8.32), and in pure UCs there was the same trend but there were only 2 cases of G2 tumours (G2: mean 15.5 changes, SEM 0.5, CI 9.12-21.85; G3: mean 7.17 changes, SEM 0.98, CI 5.18-9.17). Due to low numbers no sta-tistical analysis was performed.
Most frequent chromosomal changes
Table 3 shows an overview of the gains and losses on short (p) and long (q) arms of the chromosomes compared in each tumor group (Table 3). Chromosomes 19, 22, X and Y were excluded due to high variability.
Most frequent changes in SqCC were losses of 3p (51.4%)*, 8p (25.7%), 10q (25.7%), 18q (28.6%), and gains of 3q (20%), 8q (20%), 18p (20%). In MIX tumors losses were found on 3p (37.5%), 5q (25%), 10q (42.5%), 11p (22.5%)*, 11q (30%) and 18q (27.5%), and gains on 3q (25%), 5p (40%) and 8q (32.5%). UCs presented with the most frequent losses on 5q (27.8%), 6q (30.6%)*, 8p (33.3%), 9q (22.2%), 10q (30.%), 11p (25%)*, 17p (25%) and 18q (30.6%), as well as gains on 3q (27.8%), 5p (30.6%), 8q (41.7%), 10p (22.2%), 17q (27.8%) und 18p
(25%). In statistical analysis significant differ -ences between groups were found for losses on 3p (P = 0.0041), 6q (P = 0.0202) and 11p (P = 0.0237), as well as for gains on 5p (P = 0.0202).
Discussion
This is the first larger study comparing immuno -histochemically proven non-schistosoma asso-ciated pure SqCC, mixed urothelial carcinoma with partial squamous differentiation and pure UC. In previous studies either not exactly
char-acterized/specified tumors or only small num
-bers of cases have been analyzed. Our data support the concept that SqCC of the bladder is less aneuploid and therefore genetically more
stable than UC. This is in line with the largest
non-specified FISH-study of cell suspensions of
n = 94 SCCs and n = 96 UCs from Pycha et al., who also found less polysomic tumour cells in SqCCs than in UCs (CEN17 30.8% versus 85.4% UC, CEN 7 81.9% vs. 97.9%) [18]. For
chromo-some 7 our study could not show statistically
significant differences. However, this might be
due to the technical difference of cell suspen-sions and artifact-rich tissue sections (partial nuclei or overlay of nuclei) [19]. Further,
Urovysion® FISH was developed for the detec -tion of aneuploidy in UC, and Reid Nicholson et al. found only two of 15 SqCCs on tissue
sec-tions FISH-positive (Abbott criteria), strongly
questioning its diagnostic value in
non-urotheli-al tumors. However, annon-urotheli-alysis of their published
data also showed polysomies of chromosome 3 and 17 in one case, as well as polysomy of chro-mosomes 3, 7 and 17 in the other case [20]. In contrast, we found higher numbers of positive SqCCs (22/29, 76%) and polysomic tumor cells: 76% of cases showed polysomy of chromo-some 3 and 68% polysomy of chromochromo-some 17. Kipp et al. analyzed tissue sections of n = 7 SqCC by Urovysion® FISH and detected homozy
-gous deletions of 9p21 in SqCC significantly
more frequent than in other tumor types [21]. They also reported polysomies of the other chromosomes in 31% of 9p21-deleted cells. We substantiated our study with further
analy-sis of our cohort by CGH. Similar to UC [22] we
expected an increase of genetic alterations by tumor stage and grade in squamous tumors as a consequence of accumulation of genetic hits.
However, in our invasive cancers we found no significant correlations of genetic alterations
within any tumor group regarding increasing tumor stage (T2 vs. T3-4) or grade (G2 vs. G3). Overall we detected less genetic alterations in SqCC (mean 5.37) than in any other tumor type (MIX mean 6.75, UC mean 7.64), but the results
showed no statistical significance. The findings
are similar to the differences in tumor cell
poly-somy found with FISH.
An important question is, if there is a difference
in the genetic profile of schistosoma- and
and detected in non-schistosoma-associated samples most frequently losses of 13q, 3p, 9p and gains of 1q, 8q and 20q [3, 14]. The results for the losses of 3p and gains of 8q are in line with ours, however, we found alterations of 3p much more frequently (51% vs. El-Rifai et al. 18%). Alterations of chromosomes 9p and 13q as well as 1q and 20q were not among the most frequent alterations in our study.
Another point to address is, whether there is a
specific difference in genetic aberrations in
SqCC and MIX or UC. The earlier study of Rifai et al. dealing with not-exactly characterized
samples reported gains and high-level amplifi
-cations of 5p and losses of 3p as specific for
SqCC, with gains of 5p only in schistosoma-associated SqCC [14]. Our precisely defined
cohort showed three characteristics: a) the loss of 3p was more frequent in SqCC than in MIX or UC, b) the loss of 11p was less frequent in SqCC than in others, and c) there were less gains of 5p in SqCC compared to MIX and UC (P
= 0.0795). However, we found gains of 5p in
30% of UC. Loss of chromosome arm 11p was rare in all groups in the study of El-Rifai et al.
[14]. Fadl-Elmula et al. analyzed two cases of
urothelial carcinoma with secondary squamous differentiation. They showed in both cases UC-typical changes and an isochromosome 5p in one case and the loss of 11p in the other case, which allowed no discrimination between MIX and UC [13]. The loss of 3p was also report-ed in squamous cell tumors of the head and neck [23] and esophagus [24, 25], with a reported loss of 57% (21/37) in SqCC of the esophagus [25]. In a meta-analysis of CGH data of 5918 cancers Baudis et al. described
frequent losses of 3p and gains of 3q, 8q as well as variable gains of 1q and 5p in cancer subsites with predominantly squamous cell tumours (i.e., head and neck, non-small cell lung cancer, cervix carcinoma, vulva carcino-ma, esophagus carcinoma) [23]. Interestingly, in our analysis we also found frequent loss of 3p and gains of 3q, 8q and 5p, but more often in UC than in SqCC, which does not indicate a
specific role in squamous cell cancers but a
general involvement in the malignant transfor-mation of the urothelium.
Comparing the exact regions of losses in 3p, we found more often a complete loss of 3p or from 3p14 until the p-terminal end in SqCC, whereas the losses in MIX and UC are more focal. There
are various genes located in region 3p, e.g.,
FHIT (fragile histidine triad-3p14.2), CTNNB1
catenin (cadherin associated protein-3p21),
VHL (von Hippel-Lindau tumor suppressor, E3
ubiquitin protein ligase-3p25.3) [25], or MLH1
(mutL homolog 1, colon cancer nonpolyposis type 2-3p21.3) [23]. So far, only FHIT was
reported to be involved in the tumorigenesis of bladder tumors [26]. It encodes the
FHIT-protein, a diadenosintriphosphate-hydrolase of
the “histidine triad (HIT)”-super family of nucle -otid-binding proteins [26, 27], which acts as a tumour suppressor. The tumour suppressive mechanism is not fully understood, yet [26, 28, 29], but it seems to induce apoptosis [29], and interacts with several pathways regulating oxi-dative stress and cell cycle control [28, 29].
Furthermore, region 3p14.2 includes a very
active “common fragile site (CFS)” FRA3B, sus
-ceptible for strand breaks or rearrangements (genetic instability), and triggering tumorigene-sis [28, 29]. Therefore, loss of 3p14.2 as part
of FRA3 is reported quite often in tumours of
the lung, esophagus, cervix, breast and head and neck [26, 28]. In bladder tumors Han et al.
reported a negative correlation of FHIT expres
-sion with tumour grade, but not with tumour stage or recurrence [26]. Zhang et al.
suggest-ed FHIT expression as a prognostic marker, as patients with positive FHIT-expression showed significantly longer survival times in their study
[30]. FHIT-expression has not yet been
investi-gated in pure, non-schistosoma associated SqCCs of the bladder, but Gutierrez et al. found
a methylation of FHIT (40% of cases) and other
loci in schistosoma-associated SqCCs [31]. To conclude, SqCCs show less polysomy and
genetic alterations than MIX and UC. However, the structural genetic profile for SqCC, MIX and UC is similar, with no absolutely specific altera -tions for each group. Loss of 3p was more fre-quent in SqCC, but so far we do not know the driver-event for squamous carcinogenesis. Our results build bridges to the recently proposed subtypes of muscle invasive bladder cancer, as
the described “basal/squamous-like” subtype
perfectly overlaps with our MIX tumors,
espe-cially the “transdifferentiated” subtype of Gaisa
et al. [15]. Our cytogenetic data strengthen the concept of different squamous phenotypes in bladder cancer: mixed tumors show similar
alterations than UC, thus seem to fit into the
-sidered a further more aggressive development of urothelial carcinoma, while mere SqCC appear to be a separate tumor group. Gathering detailed knowledge on exact subtypes of blad-der cancer is extremely important for the devel-opment of biology-based individualized thera-pies and further molecular studies on squa-mous differentiated bladder tumours are needed.
Acknowledgements
The authors thank Daniela Smeets and Sonja Gostek for excellent technical support and Dr. Luigi Villa, Robert Schmidt as well as Prof.
Ralf-Dieter Hilgers for statistical advice.
Disclosure of conflict of interest
None.
Address correspondence to: Dr. Nadine T Gaisa,
Institute of Pathology RWTH Aachen, Pauwelsstrasse
30, Aachen 52074, Germany. Tel: +49 (0)241-80-36118; Fax: +49 (0) 241-80-82439; E-mail: ngai-sa@ukaachen.de
References
[1] Lagwinski N, Thomas A, Stephenson AJ,
Campbell S, Hoschar AP, El-Gabry E, Dreicer R and Hansel DE. Squamous cell carcinoma of
the bladder: a clinicopathologic analysis of 45 cases. Am J Surg Pathol 2007; 31: 1777-1787. [2] Rausch S, Hofmann R and von Knobloch R.
Nonbilharzial squamous cell carcinoma and transitional cell carcinoma with squamous dif-ferentiation of the lower and upper urinary tract. Urol Ann 2012; 4: 14-18.
[3] Eble JN, Sauter G, Epstein JI and Sesterhenn
IAE. World Health Organization Classification
of Tumours. Pathology and Genetics of Tumours of the urinary system and male geni-tal organs. Lyon: IARC Press; 2004.
[4] El-Sebaie M, Zaghloul MS, Howard G and
Mokhtar A. Squamous cell carcinoma of the bilharzial and non-bilharzial urinary bladder: a review of etiological features, natural history, and management. Int J Clin Oncol 2005; 10: 20-25.
[5] Botelho MC, Machado JC, Brindley PJ and
Correia da Costa JM. Targeting molecular sig-naling pathways of Schistosoma haemotobium infection in bladder cancer. Virulence 2011; 2: 267-279.
[6] Felix AS, Soliman AS, Khaled H, Zaghloul MS, Banerjee M, El-Baradie M, El-Kalawy M, Abd-Elsayed AA, Ismail K, Hablas A, Seifeldin IA,
Ramadan M and Wilson ML. The changing
pat-terns of bladder cancer in Egypt over the past 26 years. Cancer Causes Control 2008; 19: 421-429.
[7] Shanks JH and Iczkowski KA. Divergent differ -entiation in urothelial carcinoma and other bladder cancer subtypes with selected mimics.
Histopathology 2009; 54: 885-900.
[8] Choi W, Porten S, Kim S, Willis D, Plimack ER,
Hoffman-Censits J, Roth B, Cheng T, Tran M, Lee IL, Melquist J, Bondaruk J, Majewski T, Zhang S, Pretzsch S, Baggerly K, Siefker-Radtke A, Czerniak B, Dinney CPN, McConkey DJ. Identification of distinct basal and luminal
subtypes of muscle-invasive bladder cancer with different sensitivities to frontline chemo-therapy. Cancer Cell 2014; 25: 152-165. [9] Weinstein JN, Akbani R, Broom BM, Wang W,
Verhaak RG, McConkey D, Lerner S, Morgan M, Creighton CJ, Smith C, Kwiatkowski DJ, Cherniack AD, Kim J, Sekhar Pedamallu C,
Noble MS, Al-Ahmadie HA, Reuter VE, Rosenberg JE, Bajorin DF, Bochner BH, Solit DB, Koppie T, Robinson B, Gordenin DA, Fargo
D, Klimczak LJ, Roberts SA, Au J, Laird PW,
Hinoue T, Schultz N, Ramirez R, Hansel D, Hoadley KA, Kim WY, Damrauer JS, Baylin SB,
Mungall AJ, Robertson AG, Chu A, Kwiatkowski DJ, Sougnez C, Cibulskis K, Lichtenstein L, Sivachenko A, Stewart C, Lawrence MS, Getz
G, Lander E, Gabriel SB, Creighton CJ,
Donehower L, Cherniack AD, Kim J, Carter SL, Saksena G, Schumacher SE, Sougnez C,
Freeman SS, Jung J, Sekhar Pedamallu C, Bhatt AS, Pugh T, Getz G, Beroukhim R, Gabriel SB, Meyerson M, Mungall AJ, Robertson AG, Chu A, Ally A, Balasundaram M, Butterfield YS, Dhalla N, Hirst C, Holt RA, Jones SJ, Lee D, Li HI, Marra MA, Mayo M, Moore RA, Schein JE,
Sipahimalani P, Tam A, Thiessen N, Wong T,
Wye N, Bowlby R, Chuah E, Guin R, Jones SJ, Marra MA, Hinoue T, Shen H, Bootwalla MS, Triche T Jr, Lai PH, Van Den Berg DJ, Weisenberger DJ, Laird PW, Hansel D, Hoadley KA, Balu S, Bodenheimer T, Damrauer JS, Hoyle AP, Jefferys SR, Meng S, Mose LE,
Simons JV, Soloway MG, Wu J, Kim WY, Parker
JS, Hayes DN, Roach J, Buda E, Jones CD,
Mieczkowski PA, Tan D, Veluvolu U, Waring S, Auman JT, Perou CM, Wilkerson MD, Santoso
N, Parfenov M, Ren X, Pantazi A, Hadjipanayis
A, Seidman J, Kucherlapati R, Lee S, Yang L,
Park PJ, Baylin SB, Wei Xu A, Protopopov A, Zhang J, Bristow C, Mahadeshwar HS, Seth S,
Song X, Tang J, Zeng D, Chin L, Guo C, Weinstein
JN, Akbani R, Broom BM, McConkey D, Casasent TD, Liu W, Ju Z, Motter T, Peng B,
Ryan M, Wang W, Verhaak RG, Su X, Yang JY,
P, Voet D, Zhang H, Zou L, Chin L, Getz G, Bernard B, Kreisberg D, Reynolds S, Rovira H,
Shmulevich I, Ramirez R, Schultz N, Gao J,
Jacobsen A, Aksoy BA, Antipin Y, Ciriello G, Dresdner G, Gross B, Lee W, Reva B, Shen R,
Sinha R, Sumer SO, Weinhold N, Ladanyi M,
Sander C, Benz C, Carlin D, Haussler D, Ng S,
Paull EO, Stuart J, Zhu J, Liu Y, Zhang W, Taylor
BS, Lichtenberg TM, Zmuda E, Barr T, Black AD, George M, Hanf B, Helsel C, McAllister C,
Ramirez NC, Tabler TR, Weaver S, Wise L,
Bowen J, Gastier-Foster JM, Weinstein JN,
Lerner S, Jian W, Tello S, Ittman M, Castro P, McClenden WD, Morgan M, Gibbs R, Liu Y,
Saller C, Tarvin K, DiPiero JM, Owens J, Bollag
R, Li Q, Weinberger P, Czerwinski C,
Huelsenbeck-Dill L, Iacocca M, Petrelli N, Rabeno B, Swanson P, Shelton T, Curley E, Gardner J, Mallery D, Penny R, Van Bang N, Thi Hanh P, Kohl B, Van Le X, Duc Phu B, Thorp R, Viet Tien N, Quang Vinh L, Sandusky G, Burks E, Christ K, Gee J, Holway A, Moinzadeh A, Sorcini A, Sullivan T, Al-Ahmadie HA, Bajorin DF, Bochner BH, Garcia-Grossman IR, Regazzi AM, Solit DB, Rosenberg JE, Reuter VE, Koppie T, Boice L, Kimryn Rathmell W, Thorne L, Bastacky S, Davies B, Dhir R, Gingrich J, Hrebinko R, Maranchie J, Nelson J, Parwani A, Bshara W, Gaudioso C, Morrison C, Alexopoulou V, Bartlett J, Engel J, Kodeeswaran S, Antic T, O'Donnell PH, Smith ND, Steinberg GD, Egea S, Gomez-Fernandez C, Herbert L, Jorda M, Soloway M, Beaver A, Carter S, Kapur P, Lewis C, Lotan Y, Robinson B, Hansel D, Guo C, Bondaruk J, Czerniak B, Akbani R, Broom BM,
Liu Y, Zhang W, Weinstein JN, Lerner S, Morgan
M, Kim J, Cherniack AD, Freeman SS, Sekhar
Pedamallu C, Noble MS, Kwiatkowski DJ,
Al-Ahmadie HA, Bajorin DF, Bochner BH, Solit DB,
Rosenberg JE, Reuter VE, Koppie T, Robinson
B, Skinner E, Ramirez R, Schultz N, Hansel D, Kim WY, Guo C, Bondaruk J, Aldape K, Czerniak B, Jensen MA, Kahn AB, Pihl TD, Pot DA, Srinivasan D, Wan Y, Ferguson ML, Zenklusen
JC, Davidsen T, Demchok JA, Mills Shaw KR,
Sheth M, Tarnuzzer R, Wang Z, Yang L, Hutter C, Ozenberger BA, Sofia HJ, Eley G. Cancer
Genome Atlas Research Network. Comp- rehensive molecular characterization of uro-thelial bladder carcinoma. Nature 2014; 507: 315-322.
[10] Sjödahl G, Lauss M, Lövgren K, Chebil G, Gudjonsson S, Veerla S, Patschan O, Aine M,
Fernö M, Ringner M, Mansson W, Liedberg F, Lindgren D, Höglund M. A molecular taxonomy
for urothelial carcinoma. Clin Cancer Res 2012; 18: 3377-3386.
[11] Aly MS, Khaled HM, Emara M, Hussein TD. Cytogenetic profile of locally advanced and
metastatic schistosoma-related bladder can-cer and response to chemotherapy. Cancan-cer Genet 2012; 205: 156-162.
[12] Muscheck M, Abol-Enein H, Chew K, Moore D 2nd, Bhagarva V, Ghoneim MA, Carroll PR, Waldmann FM. Comparison of genetic chang -es in schistosome-related transitional and squamous bladder cancers using comparative genomic hybridization. Carcinogenesis 2000; 21: 1721-1726.
[13] Fadl-Elmula I, Gorunova L, Lundgren R, Mandahl N, Forsby N, Mitelman F and Heim S.
Chromosomal abnormalities in two bladder carcinomas with secondary squamous cell dif-ferentiation. Cancer Genet Cytogenet 1998; 102: 125-130.
[14] El-Rifai W, Kamel D, Larramendy ML, Shoman
S, Gad Y, Baithun S, El-Awady M, Eissa S, Khaled H, Soloneski S, Sheaff M and Knuutila
S. DNA copy number changes in Schistosoma-associated and non-Schistosoma-Schistosoma-associated bladder cancer. Am J Pathol 2000; 156: 871-878.
[15] Gaisa NT, Braunschweig T, Reimer N, Bornemann J, Eltze E, Siegert S, Toma M, Villa L, Hartmann A and Knuechel R. Different im -munohistochemical and ultrastructural pheno-types of squamous differentiation in bladder cancer. Virchows Arch 2011; 458: 301-312. [16] Harrison CJ, Kempski H, Hammond DW and
Kearney L. Molecular cytogenetics in child-hood leukemia. Methods Mol Med 2004; 91: 123-137.
[17] Junker K, van Oers JM, Zwarthoff EC, Kania I,
Schubert J and Hartmann A. Fibroblast growth
factor receptor 3 mutations in bladder tumors correlate with low frequency of chromosome alterations. Neoplasia 2008; 10: 1-7.
[18] Pycha A, Mian C, Posch B, Haitel A, Mokhtar AA, El-Baz M, Ghoneim MA and Marberger M.
Numerical chromosomal aberrations in mus-cle invasive squamous cell and transitional cell cancer of the urinary bladder: an alternative to classic prognostic indicators? Urology 1999; 53: 1005-1010.
[19] Sugimura H, Mori H, Nagura K, Kiyose S, Tao H, Isozaki M, Igarashi H, Shinmura K, Hasegawa A, Kitayama Y and Tanioka F. Fluorescence in
situ hybridization analysis with a tissue
micro-array: ‘FISH and chips’ analysis of pathology
archives. Pathol Int 2010; 60: 543-550. [20] Reid-Nicholson MD, Ramalingam P, Adeagbo
B, Cheng N, Peiper SC and Terris MK. The use of Urovysion fluorescence in situ hybridization
in the diagnosis and surveillance of non-uro-thelial carcinoma of the bladder. Mod Pathol 2009; 22: 119-127.
Chromosomal alterations detected by fluores -cence in situ hybridization in urothelial carci-noma and rarer histologic variants of bladder cancer. Am J Clin Pathol 2008; 130: 552-559. [22] Chan MW, Hui AB, Yip SK, Ng CF, Lo KW, Tong
JH, Chan AW, Cheung HY, Wong WS, Chan PS, Lai FM and To KF. Progressive increase of ge -netic alteration in urinary bladder cancer by combined allelotyping analysis and compara-tive genomic hybridization. Int J Oncol 2009; 34: 963-970.
[23] Baudis M. Genomic imbalances in 5918 malig -nant epithelial tumors: an explorative
meta-analysis of chromosomal CGH data. BMC
Cancer 2007; 7: 226.
[24] Bellini MF, Silva AE and Varella-Garcia M.
Genomic imbalances in esophageal squamous
cell carcinoma identified by molecular cytoge
-netic techniques. Genet Mol Biol 2010; 33:
205-213.
[25] Qin YR, Wang LD, Fan ZM, Kwong D and Guan
XY. Comparative genomic hybridization analy-sis of genetic aberrations associated with de-velopment of esophageal squamous cell
carci-noma in Henan, China. World J Gastroenterol
2008; 14: 1828-1835.
[26] Han Y, Zhang Z, Zhang GJ, Guo KF, Shan GY and Kong CZ. Aberrant FHIT expression is
linked to bladder carcinogenesis and apopto-sis. Asian Pac J Cancer Prev 2011; 12: 2915-2920.
[27] Barnes LD, Garrison PN, Siprashvili Z,
Guranowski A, Robinson AK, Ingram SW, Croce
CM, Ohta M and Huebner K. Fhit, a putative
tumor suppressor in humans, is a dinucleoside
5’, 5”’-P1, P3-triphosphate hydrolase.
Bioch-emistry 1996; 35: 11529-11535.
[28] Pichiorri F, Palumbo T, Suh SS, Okamura H, Trapasso F, Ishii H, Huebner K and Croce CM. Fhit tumor suppressor: guardian of the preneo
-plastic genome. Future Oncol 2008; 4:
815-824.
[29] Wali A. FHIT: doubts are clear now. ScientificWorldJournal 2010; 10: 1142-1151.
[30] Zhang CT, Lu R, Lin YL, Liu RL, Zhang ZH, Yang K, Dang RF, Zhang HT, Shen YG, Kong PZ, Ren HL, Li XL, Quan W and Xu Y. The significance of
fragile histidine triad protein as a molecular prognostic marker of bladder urothelial carci-noma. J Int Med Res 2012; 40: 507-516. [31] Gutierrez MI, Siraj AK, Khaled H, Koon N,
El-Rifai W and Bhatia K. CpG island methylation
![Table 1. Characteristics of the multicentric tumor cohort (classified according to the results of Gaisa et al., 2011 [15])](https://thumb-us.123doks.com/thumbv2/123dok_us/850213.595706/2.612.91.518.96.724/table-characteristics-multicentric-cohort-classified-according-results-gaisa.webp)