Abstract—Yttria Partially Stabilized Zirconia (YPSZ) is one
of the most important engineering ceramic materials in that it displays a whole host of outstanding structural and functional properties. Of particular importance for load-bearing applications is the remarkable fracture toughness of YPSZ that arises from its ability to undergo martensitic transformation, a phase transformation that is dependent on stress, temperature, time, humidity, grain size, and the proximity of an interface.
The present study was aimed at revealing the influence of the thermal ageing on the tetragonal to monoclinic phase transformation in the near-surface regions of YPSZ. In order to perform qualitative and quantitative characterisation of the phase composition, three principal microscopic techniques were employed: atomic force microscopy, depth resolved Raman micro-spectroscopic scanning, and synchrotron X-ray diffraction.
Satisfactory consistency was achieved between the results obtained using different techniques. Moreover, the data obtained in this way displayed complementarity that provided valuable input for the development of thermodynamic
Manuscript received 31 March, 2014; revised 30 April, 2014. This work was supported in part by UK EPSRC through grants EP/I020691 “Multi-disciplinary Centre for In-situ Processing Studies (CIPS)”, EP/G004676 “Micromechanical Modelling and Experimentation”, and EP/H003215 “New Dimensions of Engineering Science at Large Facilities”. Diamond Light Source is acknowledged for providing the beam time.
Oliver Roberts is MEng student in the Department of Engineering Science, University of Oxford, Parks Road, Oxford OX1 3PJ, UK (e-mail: [email protected]).
Alexander J. G. Lunt is doctoral student in the Department of Engineering Science, University of Oxford, Parks Road, Oxford OX1 3PJ, UK (e-mail: [email protected]).
Siqi Ying is doctoral student in the Department of Engineering Science, University of Oxford, OX1 3PJ, UK (e-mail: [email protected]).
Tan Sui is doctoral student in the Department of Engineering Science, University of Oxford, OX1 3PJ, UK (e-mail: [email protected]).
Nikolaos Baimpas is doctoral student in the Department of Engineering Science, University of Oxford, Parks Road, OX1 3PJ, UK (e-mail: [email protected]).
Igor P. Dolbnya is beamline scientist in the Diamond Light Source, Harwell Oxford Campus, Didcot OX11 0DE, UK (e-mail: [email protected]).
Maria Parkes is post-doctoral research assistant in the Department of Mechanical Engineering, Imperial College, Exhibition Road, London SW7 2AZ, UK (e-mail: [email protected]).
Daniele Dini is Reader in Tribology, Department of Mechanical Engineering, Imperial College, Exhibition Road, London SW7 2AZ, UK (e-mail: [email protected]).
Sergei M. Kreynin is Professor of Physics, Moscow State Mining University, 6 Leninsky Prospect, Moscow 119991, Russia (e-mail: [email protected]). Current address: National University of Science and Technology "MISIS", 4 Leninsky Prospect, Moscow 119049, Russia.
Tee Khin Neo is Prosthodontist, Specialist Dental Group, 3 Mount Elizabeth #08-08 Mount Elizabeth Medical Centre, Singapore 228510.
*Alexander M. Korsunsky is Professor of Engineering Science at the University of Oxford, OX1 3PJ, UK (corresponding author, tel: +44-18652-73043; fax: +44-18652-73010; (e-mail: [email protected]).
modelling of the complex inter-dependence between phase state and processing history of zirconia ceramics.
Index Terms— partially stabilized zirconia ceramic, phase
transformation, thermodynamic modelling, micro-Raman, synchrotron scattering, AFM
I. INTRODUCTION
IRCONIA ceramics are a class of complex ceramic materials for which intricate control over properties and behaviour can be achieved by alloying additions of other oxides, primarily yttria, ceria, and hafnia, but also oxides of other elements. Yttria (Y2O3) Partially Stabilised Zirconia
(ZrO2) (YPSZ) has found widespread use in the manufacture
of dental prostheses due to its high compressive strength, appealing aesthetics, biocompatibility and toughness [1]. YPSZ derives its toughness from a displacive phase transformation between the tetragonal (t) and monoclinic (m) crystal structures. The t-m transformation can be induced by the combined action of stress and temperature, as well as other factors applied to the ceramic. The resulting phase change introduces a combination of shear and volume expansion (of 7%) that, for example, can lead to the reduction of tensile stress near crack tips. This effect opposes crack growth and results in the apparent increased toughness of YPSZ [2].
It is well known that the phase transformation behaviour of YPSZ is closely related to its deformation [3]. The thermodynamic description of this change establishes a framework in which the strain, surface and chemical free energy combine to control the material behaviour. For a particle of volume 𝑉and surface area 𝑆, the change in Gibbs free energy associated with the t-m transformation can be written as [4]
∆𝐺𝑡→𝑚 =𝑉(∆𝐺𝜀− ∆𝐺𝑐ℎ𝑒𝑚) +𝑆∆𝐺𝑠𝑢𝑟𝑓 . (1)
where ∆𝐺𝜀 is the transformation shear and dilatational strain energy change that depends on the local stress-strain state of the transforming particle; ∆𝐺𝑐ℎ𝑒𝑚 is the temperature-dependent chemical free energy difference between the two phases; and ∆𝐺𝑠𝑢𝑟𝑓 is the change in surface energy which is associated with new surfaces e.g. due to micro-cracking or new interfaces that may arise as a result of twinning or grain refinement. The equilibrium temperature of the t-m transformation, T0, is defined as the temperature at
which ∆𝐺𝑐ℎ𝑒𝑚=0, and Ms (transformation start temperature)
is defined as the temperature at which ∆𝐺𝑡→𝑚 = 0.
In order to understand fully the complex transformation history often encountered in zirconia ceramics, a reliable, validated and versatile model of the YPSZ system is needed. The model must satisfy the following requirements:
A Study of Phase Transformation at the Surface
of a Zirconia Ceramic
Oliver Roberts, Alexander J. G. Lunt, Siqi Ying, Tan Sui, Nikolaos Baimpas, Igor P. Dolbnya, Maria
Parkes, Daniele Dini, Sergei M. Kreynin, Tee Khin Neo, and Alexander M. Korsunsky
*• The use of a thermodynamically-based constitutive law that describes the evolution of the mechanical state of the material as a function of temperature, local stress state, strain increment and the local surface and interface conditions.
• The implementation of a microstructurally-informed numerical model of deformation and transformation in order to quantify a spatially-resolved relationship between remotely applied loading, thermal effects and the resulting local strain and phase state.
• Model validation and refinement capability through post-processing that would allow representation of the numerical simulation output in the form that can be directly compared and matched to experimentally observable parameters.
The establishment of such a model is a long-term objective and an ongoing project. The present paper represents a “work in progress” report that establishes the current state-of-the-art and identifies routes for further progress.
A. Thermal ageing induced phase transformation
A wide range of literature has been produced on the influence of thermal ageing on the tetragonal to monoclinic phase transformation in YPSZ [5-7]. Low temperature ageing has been shown to occur within the temperature range 65-500°C, with the maximum rate at 250°C [8]. The transformation has also previously been shown to be accelerated by the addition of water vapour to the heating vessel [7].
The results of these studies have provided evidence for the Invariant Plane Strain (IPS) phase transformation model of YPSZ. Upon transformation, scratches lying on the surface of transformed grains remain unbroken, demonstrating that the martensitic habit plane exhibits neither strain, nor rotation. The volume expansion occurs by the formation of self-accommodating martensitic variant pairs which occur when two monoclinic plates form back to back, with a joint arising between the two habit planes [9]. This results in an energetically favourable configuration: since the shear strains in the two variants of the pair are opposite and equal, a large reduction of long-range overall strain is achieved by this process. Variant pairs lead to a characteristic triangular prism-shaped ‘pop-out’ at the material surface.
In order to detect and quantify the formation of variant pairs, AFM (Atomic Force Microscopy) can be used. By mapping the surface of the transformed region and detecting the presence of triangular prismatic structures at the appropriate scale, insight into the thermodynamic and phase state of the near-surface grains can be obtained. For example Deville et al. [5] recently identified the surface transformation zone around crack tips using this approach.
Thermal ageing induced phase transformation analysis in YPSZ has also been performed using X-ray Diffraction (XRD). Tsubakino et al. [10] demonstrated that the monoclinic fraction increases with the time of ageing. This process follows a sigmoidal curve, so that despite being of martensitic type, the transformation proceeds following typical nucleation and growth kinetics.
The impact of thermally induced phase transformation and degradation of YPSZ has also been studied using in-situ
Raman spectroscopy, as outlined by Garces et al.[11] Their analysis highlighted the importance of understanding the phase transformation effects in YPSZ in order to reduce the
prevalence of thermomechanically induced failure in thermal barrier coatings.
Despite the extensive range of studies on the influence of thermal ageing in YPSZ, no direct quantitative comparisons have been published between these three experimental techniques. The cross-validation of the results obtained using these different approaches is presented in this article. II. MATERIALS AND METHODS
A. Sample Preparation
Previous AFM studies of transformed surface grains [5, 9, 10, 12] stress the importance of sample preparation for effective characterisation of the transformation behaviour. In order to detect the phase transformation “signature” using the AFM-based method, very low initial surface roughness is required, since the typical transformation-induced height changes are in the order of 10 nm.
Samples were prepared in the form of 3mm diameter, 10mm long cylinders of white ZenotecTM Zr Bridge. They were sintered and embedded in an epoxy resin mould. A diamond cutting saw was used to section the sample into semi-circular cylinders of D-shaped cross section. The flat surfaces were ground using grit papers from P360 to P4000 grade. The surfaces were then polished using diamond paste with decreasing particle size from 3 µm down to 0.25 µm. After polishing the samples showed peak-to-peak height variation of less than 10 nm over a distance of 10 µm and an Ra value of less than 1 nm was recorded.
To study the effects of low temperature ageing, three samples were produced. The first sample was not thermally treated, and the remaining two were placed in an oven in air at 250°C for 3 and 28 hours respectively.
Samples were characterised using three complementary analytical techniques: AFM, synchrotron grazing angle X-ray diffraction, and Raman scanning micro-spectroscopy. The results are presented in the next section, together with the relevant background of technique implementation in each specific case.
III. RESULTS
A. Atomic Force Microscopy
[image:2.595.318.541.647.749.2]The high vertical and lateral resolution of AFM makes it a highly suitable method for revealing the transformation-induced relief that appears at the sample surface. However, it is important to remember that by its very nature, the method only provides evidence of transformation at the surface and not in the bulk [5]. The observations reported below were all made at the surface of the sample aged for 28h at 250°C using Veeco Dimension 3100 Atomic Force Microscope (Santa Barbara, CA, USA).
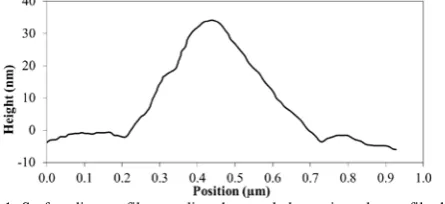
Fig. 1. Surface line profile revealing the equal slope triangular profile that provides a “signature” of a martensitic variant pair.
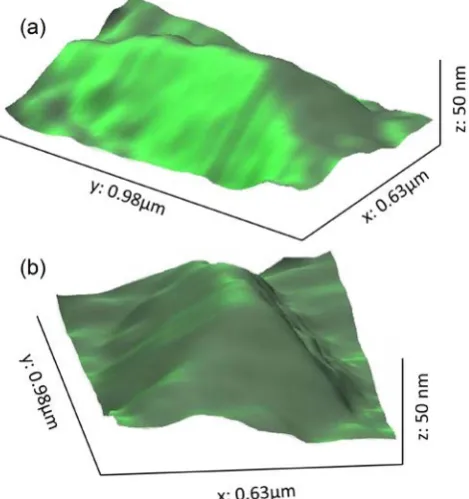
previously, provides the characteristic “signature” relief due to the formation of a martensitic variant pair. The triangular prism shape is further illustrated in 3D rendered images shown in Fig. 2.
Fig. 2. 3D rendered relief images of a triangular prismatic shape of the martensitic variant pair.
[image:3.595.306.546.89.187.2]Martensitic variant pairs (MVPs) are frequently found adjacent to each other, since this “doubling up” leads to a further reduction in the system strain energy [6]. One such occurrence is illustrated in Fig. 3.
Fig. 3. Example MVP “doubling up” observed by AFM surface mapping.
Whilst AFM provides excellent insight into the local, grain-level transformation behaviour of zirconia at the sample surface, it is not suitable for phase content quantification, nor for depth profiling. For this reason, other techniques that offer better capability for spatial averaging need to be employed, such as X-ray diffraction and Raman micro-spectroscopy.
B. Synchrotron Grazing Incidence X-ray Diffraction
Grazing Incidence X-ray Diffraction (GIXD) is an effective tool for the characterisation of phase composition in the near-surface regions (at the depth in the order of a few nanometres). In this technique, the sample surface is fully illuminated by the incident monochromatic beam at a shallow angle (3°). The resulting diffraction spectra are collected by a 2D detector placed downstream of the sample along the
incident beam direction. Radial binning of the spectra in the direction normal to the sample surface can be used to obtain the equivalent 1D diffraction spectra (Fig. 4).
Fig. 4. GIXD experimental setup illustrating the incident beam, the diffraction cone and the method for radial binning of the diffraction pattern.
The experimental setup is both simple and effective for surface characterisation, but suffers from a lack of resolution in the direction along the incident beam, as an average value is obtained over the entire illuminated area. Furthermore, peak blurring arises due to the variation in the effective sample to detector distance from different scattering points in this setup. To minimise this blurring, relatively small vertical beam size is defined using collimating slits.
GIXD was performed on two of the polished samples: the untreated and 28 hour aged sample. The experiment was performed at beamline B16 at Diamond Light Source (DLS, Oxford, UK). The moderate beam energy used, in combination with the strong absorption of zirconia, ensured low penetration depth. Positioning flexibility and flexible detection available at the beamline made it a natural choice for this study.
A monochromatic 15keV X-ray beam was collimated down to a size of 1(h)×0.25(v) mm and directed at the sample. The 3° grazing angle on the sample resulted in the illuminated area of ~1×5 mm at the surface. The diffraction patterns were recorded using a Photonic Science Image Star 9000 detector (Photonic Science Ltd., UK). The exposure time of 15 minutes was chosen to obtain sufficient statistics on the pattern recorded. Flat field exposures were also collected for subtraction from the YPSZ data collected.
Fig. 5. Radially binned diffraction spectra of the untreated samples, showing purely tetragonal peaks (black curve, narrower peaks), and of the heat-treated sample (red curve, broader peaks) that shows both monoclinic and tetragonal peaks. Peak broadening is likely to be associated with grain fragmentation and size reduction due to transformation.
[image:3.595.54.289.103.353.2] [image:3.595.56.287.437.575.2] [image:3.595.312.553.533.655.2]distinction between the two samples is however clearly demonstrated by the presence of only tetragonal peaks in the untreated sample and both monoclinic and tetragonal peaks in the treated sample.
In order to quantify the percentage of transformed YPSZ material in the surface region, the relative intensities of the monoclinic peaks 1�11𝑀 and 111𝑀, and the tetragonal peak 111𝑇 were used (Fig. 5). As outlined by Toraya et al. [13], the ratio of the integrated peak intensities, 𝐼𝑀1�11, 𝐼𝑀111and 𝐼𝑇111 can be used to calculate the XRD-derived monoclinic volume fraction (XM) as follows:
XM = 1.311�IM111+IM111� 1.311�IM111+I𝑀111�+IT111
. (2)
Using this technique, the untreated sample was identified as purely tetragonal, whilst the monoclinic volume fraction of the 28 hour treated sample was determined to be 71%. This confirms that the thermal ageing process has resulted in the transformation of a large percentage of the surface grains from tetragonal to the monoclinic phase.
C. Raman scattering
Raman micro-spectroscopy offers a sensitive tool for spatially resolved (at ~1 µm resolution and better) mapping of substances using chemical bond identification. After a monochromatic beam is focused at the sample surface, the scattered light is recorded by a spectrometer, and the energy (wavelength) shift spectrum is examined. Basic interpretation of the Raman spectroscopic shift assumes that the material may be represented by balls (atoms) connected with springs (chemical bonds) that vibrate in response to an input of energy. Vibrational modes of specific molecules are functions of a number of factors such as bond orientation and length, atomic mass, etc. Whilst most incident photons undergo elastic Rayleigh scattering at the same energy as the incident photons, a small fraction (approximately 1 in 107 photons) is scattered at longer wavelengths (Stokes shift), whilst an even smaller proportion are shifted to shorter wavelengths (anti-Stokes shift). Raman spectrometer detects and measures the intensity of scattered light as a function of wavelength shift. The Raman shift (in cm-1) is calculated using
𝜈̅=𝜆1
inc−
1
𝜆sc, (3)
with λ inc and λsc representing the wavelengths (in cm) of the
incident and the scattered light respectively. It is worth noting that the Raman shift represents the energy difference between levels characteristic for a particular material, and does not depend on the frequency of the incident radiation.
The intensity of Raman bands are obtained after scattering from zirconia is directly proportional to the concentration of scattering crystallographic species, enabling quantitative microanalysis of monoclinic and tetragonal phases to be conducted [14]. The monoclinic phase intensity ratio [15] was calculated using the equation:
Cm =
Im179 + Im190
Im179 + Im190 + F(It147+It264)
. (4)
where Im 179
, Im 190
, It 147
and It 264
refer to the intensities of the monoclinic (m) and tetragonal (t) peaks in the Raman spectra at 179 cm-1, 190 cm-1, 147 cm-1 and 264 cm-1, respectively
(Fig. 6). The Raman-derived volume fraction of the monoclinic phase was then computed using [15]:
[image:4.595.309.551.81.250.2]Vm = 0.65 + 0.39 log10Cm . (5)
Fig. 6. Raman spectrum of a partially transformed zirconia sample with the tetragonal and monoclinic peaks labelled as T and M respectively. The background is estimated as the black (dashed) line below the 147, 179, 190 and 264 cm-1 peaks in the spectrum.
Scans were carried out using Alpha300R confocal Raman spectrometer (WITec Gmbh, Ulm, Germany) in accumulation mode over an area of 40×40 µm. There was no visible change in profile during scanning, confirming that the phase state was uniform in the entire area. The spectra were also unchanged when the spectrometer was focused at 5µm beneath the material surface. Fig. 7 presents the significant differences between the spectra of the sample in the initial (untreated) state, and after heat treatment for 28 hours. Although tetragonal bands persist in the 28h sample, new peaks also appear at 96, 179, 183, 220, 331, 378, 475, 534, 556, 616, 638 and 743cm-1. These peaks are representative of the monoclinic spectra. The 28h heat treatment causes the t-
m phase transformation with the Vm value of 59% according
to equation (5).
Fig. 7. Accumulated Raman spectra of the initial (untreated) sample state, and following 28h heat treatment.
[image:4.595.309.555.487.628.2]the monoclinic volume fraction of 11%. Finally, by interrogating the layers of material at the depth of 2.5µm, the lowest curve in Fig. 8 was measured, giving the monoclinic volume fraction of 29%. From these results it appears that the
t-m transformation is most prominent at the sample surface, and decays with depth in the 3h sample.
Fig. 8. Raman spectra of the 3h-aged sample collected at sample surface, 2.5µm below the surface and 5µm below the surface.
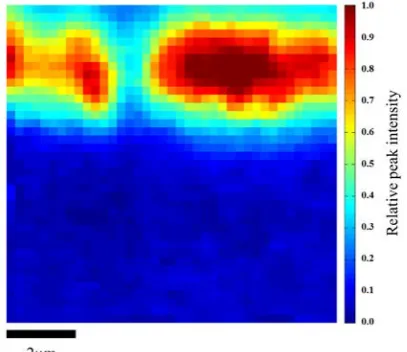
[image:5.595.52.294.125.266.2]In order to examine this hypothesis critically, the final experiment was conducted in the present study, as follows. The spot size was focused down to 250 nm and was rastered over a 10×10 µm region in two directions: along the surface and in depth. The results collected were interpreted in terms of the relative intensity of the monoclinic double peak at 179 cm-1 and 190 cm-1, and plotted in Fig. 9. Brighter colours represent larger peak intensities with a corresponding increased volume fraction of the monoclinic phase in these regions. Comparison of these results with the depth resolved monoclinic volume fraction calculations outlined previously suggest that the relative intensity calculation can be used to provide insight into the phase composition at these points.
Fig. 9. Relative intensity of the monoclinic double peak intensity at 179 cm-1 and 190 cm-1 in the 3h heat treated sample showing the variation in the transformed content with lateral position and depth below the sample surface. Lighter colours indicate higher peak intensities and therefore increased monoclinic volume fractions.
IV. DISCUSSION AND CONCLUSION
The final image presented in this paper (Fig. 9) provides compelling evidence of the spatially varying nature of the thermally induced phase transformation in YPSZ. Following heat treatment, although the volume fraction of the monoclinic phase is elevated at the surface, it reaches its maximum below the surface, at the depth of approximately 1µm, whilst at greater depths the m volume fraction decays
rapidly to low values.
Further understanding of this phenomenon requires not only additional experimentation, but also the development of appropriately versatile, spatially resolved thermodynamic models of this phenomenon. It is the authors’ opinion that this route is most likely to provide the insight required to develop supreme control over the behaviour and properties of this fascinating and important engineering material.
ACKNOWLEDGMENT
AMK acknowledges EPSRC support: EP/I020691 “Multi-disciplinary Centre for In-situ Processing Studies (CIPS)”, EP/G004676 “Micromechanical Modelling and Experimentation”, and EP/H003215 “New Dimensions of Engineering Science at Large Facilities”. Diamond Light Source is acknowledged for providing beamtime.
Modifications as of today, 30 April 2014:
- reference to AFM equipment: Veeco (p. 2) - reference to Raman equipment: WITec (p. 4) - paper formatted to fit to exactly 5 pages - replaced “1 in 107” with “1 in 107” (p. 4)
REFERENCES
[1] I. Denry, and J. R. Kelly, “State of the art of zirconia for dental applications”. Dental Materials, 24(3). 2008, pp. 299-307.
[2] P. F. Manicone, P. R. Iommetti, and L. Raffaelli, “An overview of zirconia ceramics: Basic properties and clinical applications”. Journal of Dentistry, 35(11). 2007, pp. 819-826.
[3] A.K. Mainjot, et al., “Influence of zirconia framework thickness on residual stress profile in veneering ceramic: Measurement by hole-drilling”. Dental Materials, 28(4). 2012, pp. 378-384.
[4] X. J. Jin, “Martensitic transformation in zirconia containing ceramics and its applications”. Current Opinion in Solid State & Materials Science, 9(6). 2005, pp. 313-318.
[5] S. Deville, H. El Attaoui, and J. Chevalier, “Atomic force microscopy of transformation toughening in ceria-stabilized zirconia”. Journal of the European Ceramic Society, 25(13). 2005, pp. 3089-3096. [6] S. Deville, J. Chevalier, and H. El Attaoui, “Atomic force microscopy
study and qualitative analysis of martensite relief in zirconia”. Journal of the American Ceramic Society, 88(5). 2005, pp. 1261-1267. [7] S. Deville, J. Chevalier, and L. Gremillard, “Atomic force microscopy
study of the tetragonal to monoclinic transformation behavior of silica doped yttria-stabilized zirconia”. Journal of Materials Science, 40(14). 2005, pp. 3821-3823.
[8] S. Lawson, “Environmental Degradation of Zirconia Ceramics”. Journal of the European Ceramic Society, 15(6). 1995, pp. 485-502. [9] X. Y. Chen, et al., “The study of martensitic transformation and
nanoscale surface relief in zirconia”. Journal of Materials Science Letters, 21(5). 2002, pp. 415-418.
[10] H. Tsubakino, “Isothermal tetragonal-to-monoclinic phase transformation in a zirconia-yttria system”. Materials Transactions, 46(7). 2005, pp. 1443-1451.
[11] H. F. Garces, B.S. Senturk, N. P. Padture, “In situ Raman spectroscopy studies of high-temperature degradation of thermal barrier coatings by molten silicate deposits”. Scripta Materialia, 76. 2014, pp. 29-32. [12] J. Chevalier, et al., “The Tetragonal-Monoclinic Transformation in
Zirconia: Lessons Learned and Future Trends”. Journal of the American Ceramic Society, 92(9). 2009, pp. 1901-1920.
[13] H. Toraya, M. Yoshimura, and S. Somiya, “Calibration Curve for Quantitative-Analysis of the Monoclinic-Tetragonal ZrO2 System by X-Ray-Diffraction”. Journal of the American Ceramic Society, 67(6). 1984, pp. 119-121.
[14] D. Casellas, et al., “On the transformation toughening of Y-ZrO2 ceramics with mixed Y-TZP/PSZ microstructures”. Journal of the European Ceramic Society, 21(6). 2001, pp. 765-777.
[image:5.595.68.272.445.621.2]