Real Time Detection of Hurricanes from Satellite
Cloud Imagery Using Haar Wavelet
Murali Prasad Raja, Narasimha Prasad L V,
Member, IAENG,
and Vasavi Krishna Yacham
Abstract—Hurricane is one of the most powerful and disas-trous natural calamities of all times. Hurricanes form over the warm oceans due to the complex interactions of the underlying ocean and the storm environment. Prediction of the trajectory of these hurricane storms is quite accurate after landfall but the forecast of the future storm is more difficult due to intensity change. There are different observations used for forecasting hurricane. A direct observation using research aircraft is extremely expensive and an indirect observation method called Doppler radar is useful only the storm comes close to shore and after landfall. So in order to predict before landfall, satellites can be used and even this is an indirect observation. Visible satellite images are used for estimating precipitation, amount of ice within the clouds, which tells us the strength of convection or the overturn of the atmosphere within the hurricane. The hurricane storm detection model presented in this paper uses satellite images containing different textures are subjected to
k-means clustering to obtain cloud texture on which analysis is carried out. The distance difference between clusters is typically based on pixel color, intensity, texture, and location, or a weighted combination of these factors. The Haar wavelet transform is used to eliminate striping noise and transform the satellite image in spatial domain to frequency. The threshold values of wavelength for cloud image are estimated with higher accuracy using soft thresholding and square root balance sparsity norm.
Index Terms—Hurricane, Haar wavelet, Image processing, Satellite imagery,k-means clustering
I. INTRODUCTION
H
URRICANE has a very intense impact on most of the countries around the globe. It falls under the category of the meteorological phenomenon known as the tropical cyclone. These tropical cyclones are low pressure systems that rotate in counter clockwise direction, having a thunderstorm activity. The tropical cyclone can be classified based on the intensity of the wind. When the winds are of 38 mph (33 kt) or less, they are called tropical depression. When it reaches 39-73 mph (34-63 kt), it is classified as tropical storm and if it exceeds 74 mph (64kt) it is considered to be a hurricane. It is an intense circular storm with well defined surface circulation generally formed at tropics, having strong thunderstorms and maximum sustained winds. The word hurricane has been originated from the Spanish word huracan which was inspired by hunraken, the name for the ancient Mayan storm God. In recent decades, the number and strength of intense hurricanes which fall underManuscript received July 03, 2014; revised August 04, 2014.
Murali Prasad Raja is with the Department of Electronics and Communi-cation Engineering, Vardhaman College of Engineering, Hyderabad, India. e-mail: [email protected]
Narasimha Prasad L V is with the Department of Computer Science and Engineering, Vardhaman College of Engineering, Hyderabad, India. e-mail: [email protected]
Vasavi Krishna Yacham is with the Department of Computer Science and Engineering, Vardhaman College of Engineering, Hyderabad, India. e-mail: [email protected]
category 4 and 5 of the Saffir-Simpson scale have increased, where major hurricanes hit Florida and the east coast of the United States near north Atlantic ocean. In the western pacific, hurricanes are said to be typhoons and the similar storms in Indian ocean are known as cyclones. However, their physical nature is the same.
Hurricanes form over the warm oceans (at least 800F)
in the tropics. The disastrous conditions which lead to the formation of hurricane could be prior disturbances in weather, high moisture levels, relatively light winds aloft and a wind pattern near the surface which spirals the air inward. If these conditions persist for a long period of time, cyclones develop from tropical depressions to tropical storms, and then to hurricanes, producing violent winds, turbulent waves, torrential rains and floods. The prime factors that help in predicting the hurricane are sea surface temperature, low pressure, humidity, precipitation, heat emitted by the sun and spinning of the earth. The factors like direction of wind and speed depend on the location of the hurricane eye, since hurricane winds circulate around the center in a counter-clockwise fashion. Hurricanes also depend on the path it follows, like in a fairly straight manner, looping or wobbling along its path. Hurricanes are classified based on Saffir-Simpson scale as it is the most accurate method of describing a storm that affects large areas. This scale defines the hurricane strength by categorizing them where category 1 storm is the weakest hurricane and category 5 is the strongest as shown in Table I.
[image:1.595.304.555.724.784.2]The right front quadrant of the hurricane is most dangerous as it has an additive effect of the high hurricane wind speed and steering winds in the atmosphere. It is dangerous in terms of its highest storm surge, winds, heavy rainfalls which produces destructive floods (hurricane Camille in 1969 which affected the gulf coast area, combined with a cold front in the mountains of Virginia, produced 30 inches of rain, killing 109 people.), tornadoes (The hurricane Beulah in 1967, had an off-shoot of 141 tornadoes in the Texas coast) and riptides. Hurricane damage might also cause chemical spills in industries that could make the disaster even worse. A large number of people and property fall prey to hurricane threats. This can be supported by the facts and figures which go by understanding that in an average 3 year period time, close to five hurricanes have struck the US coastlines
TABLE I: Saffir-Simpson Scale of Hurricane
claiming around 50-100 lives. Hurricane Andrew (1992) which struck South Florida and Louisiana caused a heavy damage of about $25 billion. When a hurricane hits land, it can do great damage through its fierce winds, torrential rains, inland flooding, and huge waves crashing ashore killing people and destroying property. So, there is dire need to predict hurricanes before landfall. The proposed technique uses satellite images to predict the occurrence of hurricane before landfall by determining its wavelength range.
Prediction of the trajectory of hurricane storms is quite accurate only after landfall. The forecast of the future storm intensity is more difficult to predict. The reason for this is that storm tracks are primarily determined by the large-scale atmospheric environment surrounding the storm, but the intensity is affected on a wide variety of scales by the convection near the storm center, interactions with the underlying ocean and complex interactions with the storm environment, including the effects of vertical shear, trough interaction and moisture availability which leads to difficulty in prediction.
NOAA’s National Weather Service has several tools to monitor hurricanes. While the storms are still far out in the ocean, indirect measurements using satellites which are the main tool, although ships and buoy provide observations. Once the storms come closer to land, more direct measure-ments like reconnaissance aircraft that fly into these storms, radiosondes, and automated surface observing stations are used. These aircraft observations are extremely expensive, and are not available in all regions of the globe owing to range and safety limitation.
Radar provides an important and indirect measurement once the storm comes closer to the shore and after landfall (within about 200 miles of the coast). As hurricanes spend most of their lifetime over the oceans, it has always been a problem to obtain continuous and quality data from hurri-canes before landfall, using radar. Satellites can be used for certain observations for predicting the hurricanes before the landfall. Radar cannot track if deceleration is greater than one mph/second. Sometimes, large targets close to radar can saturate the receiver and radar images which contain speckle noise due to random fluctuations in the return signal which cause difficulties for interpretation of the image [1].
Computer models were used to forecast storm intensity and movement. This method requires collection of huge amount of data about the atmosphere. Lack of observations (especially over the ocean), errors and other inconsistencies in data are the major reasons for the occurrence of erroneous results in the forecast.
The methodology employed here involves processing of visible satellite image using Haar wavelet transform in order to enhance the image or to eliminate striping noise, speckle noise [2]. The resulted satellite images are subjected to clustering based on the color attribute. To percolate these pixels into the clusters, k-means algorithm is used [3]-[5]. Then finding the threshold and standard deviation values which are further used to locate the region of visible wavelengths in which hurricane occurs. This mechanism is developed to detect the presence of hurricane by determining the wavelength range in which this storm occurs.
The remaining paper is structured as follows: Section II emphasizes on the literature survey. Section III gives
brief information on formation and lifecycle of hurricane. Section IV demonstrates the experimentation methodology employed. Section V provides the experimental results and performance measures. Finally, section VI gives conclusion and future enhancements.
II. RELATEDWORK
Research accounts to the systematic approach of gathering information or data, studying the gathered data and also var-ious materials, investigating new scientific areas, exploring new ideas in order to enhance deeper understanding of a topic and for the advancement of knowledge. The research methodology depends upon the sources from where the information has been assembled, sampling of the data and the basis on which the conclusions have been drawn. The main motto of research process of this paper is to detect the hurricane in clouds.
YonghuiWeng, Meng Zhang and Fuqing Zhang used ad-vanced data assimilating techniques to decrease errors in initial conditions and used 3DVar and 4DVar algorithms for assimilating doppler radar observations by implementing EnKF in the WRF models [6]. Brent A. Williams and David G. Long developed a hurricane model which provides prior information that can be used in maximum a posteri-ori probability estimation of rain-contaminated ocean winds and some useful hurricane parameters like location of eye center using sea winds instrument [7]. Antonio Reppucci performed wavelet analyses on SAR images and proposed a new algorithm, which uses least square minimization of SAR images in combination with a parametric holland-type model of wind speed in order to predict hurricane intensity [1]. Fuqing Zhang et al. assimilated radial velocity observations of doppler radar with an ensemble Kalman filter for predic-tion and cloud resolving analysis of hurricanes [8]. Shuyi S. Chen et al. studied many factors that lead to hurricane and developed a fully coupled atmosphere-wave-ocean modeling system that can be useful for the next-generation hurricane prediction [9]. Alark Joshi et al. approached in understanding the structure of hurricanes, identifying of the amount of vertical wind shear in a hurricane with the aid of visualization techniques [10]. Banner I. Miller et al. used some statistical methods and derived equations by using data at sea level, 700 mb and 500 mb that can be useful for prediction of hurricane motion [11]. Colin Price et al. discovered that there is a correlation between lightning frequency and maximum sustained winds where the maximum sustained winds and minimum pressures in hurricanes are preceded by increases in lightning activity, this contributes in forecasting by contin-uously monitoring the lightning activity in hurricanes around the globe [12].
III. FORMATION OFHURRICANE
cyclone’s rotation, there should be some adequate coriolis force. Absence of this force near equator, limits the formation of tropical cyclone between00−70 latitudes.
The process by which a tropical cyclone forms and sub-sequently strengthens into a hurricane depends on some conditions like pre-existing disturbance with thunderstorms, where the temperature of oceans [13] is at least800F upto a
depth of about 150 feet and the light upper level winds that do not change much in direction and speed throughout the atmosphere (low wind shear). Hurricane comes in contact with warm ocean waters and gathers heat and energy from the disturbances. The wind near the ocean surface spiral into the disturbance’s in low pressure area. The raised air gets in touch with the moisture and heat which is produced by the warm ocean. As this moisture condenses into drops, more heat is released, contributing additional energy to power the storm. Bands of thunderstorms are formed and the cloud tips of the storm rise higher into the atmosphere. If the winds at these high levels remain relatively light and have no wind shear, then the storm can remain intact and continue to strengthen.
There are three stages of tropical cyclone development. In the early stages, the system appears on the satellite image as a relatively unorganized cluster of thunderstorms. If weather and ocean conditions continue to be favorable, the system can strengthen and become a tropical depression with winds less than 38 mph or 33 kt. At this point, the storm begins to take on the familiar spiral appearance due to the flow of the winds and the rotation of the earth. If the storm continues to strengthen to tropical storm status of winds at 39-73 mph or 34-63 kt, the bands of thunderstorms contribute additional heat and moisture to the storm. The storm becomes a hurricane when winds reach a minimum of 74 mph or 64 kt.
Rapidly sinking air at the center dries and warms the area to form the cloud-free hurricane eye which is relatively calm and has a clear area of approximately 20-40 miles across. The eyewall surrounding the eye is composed of dense clouds of thunderstorms that contain the highest winds of storm. Hurricane-force winds called rain bands can stretch out as far as 300 miles from the center of a large hurricane. Air spirals towards the center in a counter-clockwise pattern and comes out in the opposite direction. Changes in the structure of the eye and eyewall can cause changes in the wind speed, which is an indicator of the storm’s intensity. During their life span, hurricanes can last for more than two weeks over the ocean and can travel up the entire Atlantic coast.
Hurricane will decay due to many reasons. When the wind shear tears the hurricane apart, it decays. Moving over cooler water or drier areas can also lead to weakening. Landfall evaporates the moisture source of hurricane due to the reduced surface circulation by friction when it passes over the land causing hurricanes to diminish. These hurricanes are spiraling masses, relying on complex combination of atmospheric processes to grow, mature and then die. There is a scope for these weakening hurricanes to reintensify if they move to a more favorable region or interact with mid-latitude frontal systems.
IV. EXPERIMENTATIONMETHODOLOGY
Large advances have been done by the meteorologists in the field of forecasting technology in order to track the poten-tial path of tropical storms and hurricanes. But this research did not prove to be sufficient in predicting storm intensity as it is difficult to determine the rapid intensification of storms when they suddenly transform into stronger cyclones or hurricanes. Also, the internal processes within the storm system and large-scale winds that determine the direction of the storms contribute to the difficulties in predicting the rapid intensification of storms.
The satellite imagery is most commonly used for meteorol-ogy which looks at the clouds above the storms, giving little insight about whats going on inside the system. In particular, satellites have greatly improved our ability to monitor and understand hurricanes. Hence, satellite or digital images are one of the efficient sources for predicting hurricanes. Satellite images use albedo factor for estimating precipitation and amount of ice within the clouds. This helps in determining the strength of convection or the overturn of the atmosphere within the hurricane. Clouds having high albedos are thick and show up bright in satellite images and thin cirrus clouds have low albedos and are semi-transparent to sunlight.
The hurricane storm detection model established in this paper has considered visible satellite images (∼ 0.6µm) and through the process of image acquisition we often find barriers like noise, burrs among others. Denoising concepts should be applied in order to analyze the image. The noise present in the images may appear as additive or multiplicative components and the main purpose of denoising is to remove these noisy components and retain the significant information to preserve useful data. Image denoising is an important task in image processing and the use of wavelet transform improves the quality of an image and reduces noise level [14]. The wavelet transform due to their excellent local-ization property, have evolved into an indispensable image processing tool in compression and denoising and therefore preserving the image characteristics making use of wavelet threshold proposed by Donoho [15].
extracted from the image. Each of the pixels in a region is similar with respect to some characteristic or computed property, such as color, intensity, or texture [16]. Clustering was carried out using MATLAB with image processing tool box, which provide image segmentation algorithms, tools and a comprehensive environment for data analysis, visualization and algorithm development. Satellite image which contains different textures such as water body, forests, grass, asphalt, barren lands, concrete and clouds etc., have different pixel values shown in Table II.
[image:4.595.92.249.397.764.2]Fig. 1 shows the schematic overview pertaining to the development of detection of hurricane storm framework. The satellite images are subjected tok-means clustering to obtain cloud texture on which analysis is carried out. In this case, distance is the square or absolute difference between a pixel and a cluster center. The difference is typically based on pixel color, intensity, texture, and location, or a weighted combination of these factors. The value ofkcan be selected manually, randomly, or by a heuristic. This algorithm is guaranteed to converge, but it may not return the optimal solution. The quality of the solution depends on the initial set of clusters and the value ofk. Based on the pixel values, the satellite image is segmented into various clusters to obtain the region of interest which is the cloud texture. The cloud texture is found to be lying in between the pixel values of
TABLE II: Pixel Values of Various Textures
[image:4.595.342.514.476.618.2]Textures Pixel values 1. Water Body 0-20 2. Forests 21-33 3. Grass 34-81 4. Asphalt 82-140 5. Barren Lands 141-199 6. Concrete 200-224 7. Clouds 225-255
Fig. 1: Schematic framework of hurricane storm detection
225 and 255.
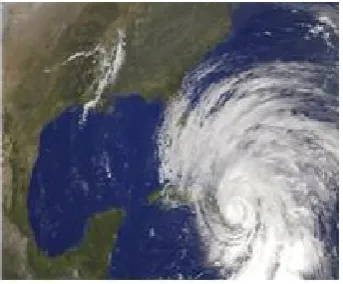
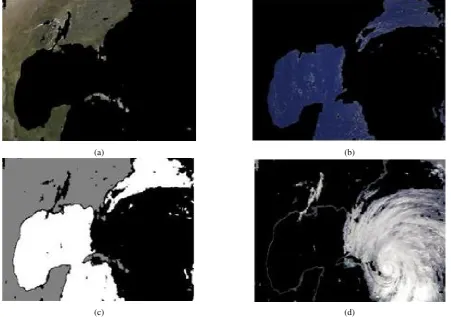
The segmentation process applied for a hurricane satellite image is shown in Fig. 2 and the resulted clusters generated are shown in Fig. 3(a), 3(b), 3(c) and 3(d) respectively. The feature extracted clustered image shown in Fig. 3(d), is analyzed further by applying wavelet transformation.
Now, using Haar wavelet transform we obtain threshold values for cloud image using square root balance sparsity. This thresholding method is the simplest method of image segmentation. This method is based on a clip-level (or a threshold value) to turn a gray-scale image into a binary image. Thresholding is used to segment an image by setting all pixels whose intensity values are above a threshold to a foreground value and all the remaining pixels to a background value [9].
In order to predict the occurrence of hurricane we have to estimate certain range of values from the feature extracted image. As the cloud image taken is in the visible infrared range, the wavelength will be in the visible spectrum range that would lie between 400 nm 700 nm. We now compute a value for square root balance-sparsity norm threshold. From Table IV, whenever a hurricane is present in the feature extracted image in frequency domain square root balance-sparsity norm threshold value varies between 10 and 11.5. Soft threshold was chosen to find the value for square root balance-sparsity norm, because this procedure does not cause non-continuants at c(k) = ±τ. The notations used in this paper are given in Table III.
The soft threshold expression is shown in equation (1).
cs(k) =
nsign c(k) (c(k)−τ), c(k)> τ
0, c(k)< τ (1)
For the determination of threshold values, equation (2) is used.
Fig. 2: An example satellite image with cloud and ground surfaces for analysis of hurricane.
TABLE III: Notations used in generalized format
Symbol Notation
cs(k) Soft threshold value
c(ki) Wavelength ofithPixel
τ Square root balance-sparsity norm threshold
σ2 Variance
σ Standard deviation
n Number of pixels
c(k) Mean wavelength
τk Fixed threshold value ∆ Correction factor
d∆
[image:4.595.329.523.674.782.2](a) (b)
[image:5.595.73.525.55.372.2](c) (d)
Fig. 3: Segmented Images Obtained After Applying K-means Clustering: (a) Textures in the first cluster; (b) Textures in the second cluster; (c) Textures in the third cluster; (d) Hurricane cloud texture extracted from the image
τ =
r
2σ2 log (n)
n (2)
The equation (3) is used to calculate the variance.
σ2 =
P(c(k
i) −c(k))2
n−1 (3)
Fixed threshold value is calculated by using equation (4).
τk =
255 Z
1 d∆
dλ r
2σ2 logn n
!
dn (4)
The values of variance, square root balance-sparsity norm threshold, wavelength factor and the wavelengths are calcu-lated using equations 1, 2, 3 and 4 are shown in Table IV. This mechanism as shown in Fig. 1 is developed to detect the presence of hurricane by determining the wavelength range in which this storm occurs.
V. EXPERIMENTALRESULTS
Hurricane is one of the most powerful and disastrous nat-ural calamities of all times. There are different observations that can be used in forecasting the hurricane like doppler radar, research aircraft among others. But these are a bit expensive and can predict hurricane only after landfall due to complex interactions between ocean and the atmosphere. Prediction of hurricanes before landfall is very crucial in order to reduce the loss of life and property. Satellite images can be used as an observation for predicting the hurricanes before landfall.
The satellite images obtained from American meteorolog-ical society are used in the analyze of hurricane detection. The major factors that play a vital role in the formation of hurricane are researched and formulated.The cloud part is extracted from the satellite image which contain different textures, color and intensity, on which the required analysis is carried out by taking color as main attribute to estimate the wavelength of the cloud image with higher accuracy and this wavelength is used for the detection of hurricane.
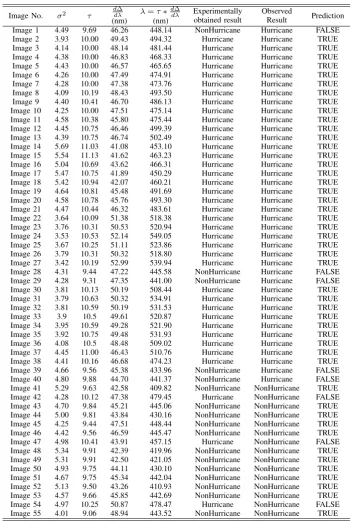
[image:5.595.304.550.624.783.2]It can be inferred from the Table IV that the result obtained for wavelength factor is approximately equal to 47.39. It can be concluded that if the product of the wavelength factor
TABLE IV: Values for variance, square root balance-sparsity norm threshold, wavelength factor and wavelength
Image No. σ2 τ d∆dλ
(nm)
λ=τ∗d∆ dλ
(nm)
TABLE V: Detection of Hurricanes
Image No. σ2 τ
d∆ dλ
(nm)
λ=τ∗d∆ dλ
(nm)
Experimentally obtained result
Observed
Result Prediction Image 1 4.49 9.69 46.26 448.14 NonHurricane Hurricane FALSE Image 2 3.93 10.00 49.43 494.32 Hurricane Hurricane TRUE Image 3 4.14 10.00 48.14 481.44 Hurricane Hurricane TRUE Image 4 4.38 10.00 46.83 468.33 Hurricane Hurricane TRUE Image 5 4.43 10.00 46.57 465.65 Hurricane Hurricane TRUE Image 6 4.26 10.00 47.49 474.91 Hurricane Hurricane TRUE Image 7 4.28 10.00 47.38 473.76 Hurricane Hurricane TRUE Image 8 4.09 10.19 48.43 493.50 Hurricane Hurricane TRUE Image 9 4.40 10.41 46.70 486.13 Hurricane Hurricane TRUE Image 10 4.25 10.00 47.51 475.14 Hurricane Hurricane TRUE Image 11 4.58 10.38 45.80 475.44 Hurricane Hurricane TRUE Image 12 4.45 10.75 46.46 499.39 Hurricane Hurricane TRUE Image 13 4.39 10.75 46.74 502.49 Hurricane Hurricane TRUE Image 14 5.69 11.03 41.08 453.10 Hurricane Hurricane TRUE Image 15 5.54 11.13 41.62 463.23 Hurricane Hurricane TRUE Image 16 5.04 10.69 43.62 466.31 Hurricane Hurricane TRUE Image 17 5.47 10.75 41.89 450.29 Hurricane Hurricane TRUE Image 18 5.42 10.94 42.07 460.21 Hurricane Hurricane TRUE Image 19 4.64 10.81 45.48 491.69 Hurricane Hurricane TRUE Image 20 4.58 10.78 45.76 493.30 Hurricane Hurricane TRUE Image 21 4.47 10.44 46.32 483.61 Hurricane Hurricane TRUE Image 22 3.64 10.09 51.38 518.38 Hurricane Hurricane TRUE Image 23 3.76 10.31 50.53 520.94 Hurricane Hurricane TRUE Image 24 3.53 10.53 52.14 549.05 Hurricane Hurricane TRUE Image 25 3.67 10.25 51.11 523.86 Hurricane Hurricane TRUE Image 26 3.79 10.31 50.32 518.80 Hurricane Hurricane TRUE Image 27 3.42 10.19 52.99 539.94 Hurricane Hurricane TRUE Image 28 4.31 9.44 47.22 445.58 NonHurricane Hurricane FALSE Image 29 4.28 9.31 47.35 441.00 NonHurricane Hurricane FALSE Image 30 3.81 10.13 50.19 508.44 Hurricane Hurricane TRUE Image 31 3.79 10.63 50.32 534.91 Hurricane Hurricane TRUE Image 32 3.81 10.59 50.19 531.53 Hurricane Hurricane TRUE Image 33 3.9 10.5 49.61 520.87 Hurricane Hurricane TRUE Image 34 3.95 10.59 49.28 521.90 Hurricane Hurricane TRUE Image 35 3.92 10.75 49.48 531.93 Hurricane Hurricane TRUE Image 36 4.08 10.5 48.48 509.02 Hurricane Hurricane TRUE Image 37 4.45 11.00 46.43 510.76 Hurricane Hurricane TRUE Image 38 4.41 10.16 46.68 474.23 Hurricane Hurricane TRUE Image 39 4.66 9.56 45.38 433.96 NonHurricane Hurricane FALSE Image 40 4.80 9.88 44.70 441.37 NonHurricane Hurricane FALSE Image 41 5.29 9.63 42.58 409.82 NonHurricane NonHurricane TRUE Image 42 4.28 10.12 47.38 479.45 Hurricane NonHurricane FALSE Image 43 4.70 9.84 45.21 445.06 NonHurricane NonHurricane TRUE Image 44 5.00 9.81 43.84 430.16 NonHurricane NonHurricane TRUE Image 45 4.25 9.44 47.51 448.44 NonHurricane NonHurricane TRUE Image 46 4.42 9.56 46.59 445.47 NonHurricane NonHurricane TRUE Image 47 4.98 10.41 43.91 457.15 Hurricane NonHurricane FALSE Image 48 5.34 9.91 42.39 419.96 NonHurricane NonHurricane TRUE Image 49 5.31 9.91 42.50 421.05 NonHurricane NonHurricane TRUE Image 50 4.93 9.75 44.11 430.10 NonHurricane NonHurricane TRUE Image 51 4.67 9.75 45.34 442.04 NonHurricane NonHurricane TRUE Image 52 5.13 9.50 43.26 410.93 NonHurricane NonHurricane TRUE Image 53 4.57 9.66 45.85 442.69 NonHurricane NonHurricane TRUE Image 54 4.97 10.25 50.87 478.47 Hurricane NonHurricane FALSE Image 55 4.01 9.06 48.94 443.52 NonHurricane NonHurricane TRUE
value and square root balance-sparsity norm threshold value is in between 450 nm - 550 nm, the de-noised, clustered image is of a hurricane. The main objective of the paper is to develop an accurate mechanism to detect the presence of hurricane. To test the performance of the proposed system we make use of four basic measures mentioned below.
Sensitivity= T P
T P +T N (5)
Specif icity= T N
F P + T N (6)
Accuracy= T P+T N
T P +F P +F N+T N (7)
P recision= T P
T P +F P (8)
The values of TP, TN, FP, FN are to be calculated in order to calculate the four measures.
1) True positive = correctly identified 2) False positive = incorrectly identified 3) True negative = correctly rejected 4) False negative = incorrectly rejected
the wavelength of the hurricane is predicted to be 445 nm which does not group into the category of the established range, contradicting to the observed data, resulting in a false prediction.
Now, looking at the non-hurricane images in the Table V, consider the image 44 where its wavelength is 430nm, which does not follow the predicted range hence concluding it as a non-hurricane. This result matches with the observed data. Hence the prediction is true. A contradiction to the non-hurricane result can be found in image 47 where the the wavelength is 457 nm, which is embedded in the established range that does not match with the observed result, tailing the prediction to be false.
Out of 100 images processed, 75 of them are hurricane and rest of the 25 are of non-hurricane. Among the 75 hurricane images, 66 were experimentally proven to be true and the rest contradicted the observed result, providing an accuracy of 88%. Out of the 25 non-hurricane images analyzed, 22 turned out to be in accordance with the observed results and the rest negated the observed result leading to the similar accuracy rate.The mean accuracy for both these results turn out to be 88%. In the similar way all the other performance measures are calculated using TP, TN, FP and FN and shown in Table VI. This proves that the prediction methodology applied by us have resulted to be more accurate and convincing when compared to the previous methodologies
VI. CONCLUSION
A hurricane is a very powerful, violent spiraling storm that can inflict catastrophic property damage and loss of human life. Hence there is a dire need to predict to occurrence of hurricanes before the landfall. This can be accurately achieved when we adapt the technique of prediction using the satellite images. In the technique which we have adapted in this paper, we establish a wavelength range using square root balance-sparsity norm threshold and spectral characteristics of cloud in the visible and infra-red spectrum to differentiate between hurricane and non-hurricane clouds. The technique which we have followed here is more precise when com-pared to the previous observations. Therefore more accurate prediction of hurricanes can be made by exploitingk-means clustering algorithm and Haar wavelet transformations. The risk of deviating and getting inaccurate results due to the presence of noise in radar images can be highly diminished and thus prediction of hurricanes before landfall can be done efficiently by using the visible satellite images for forecasting hurricane.
[image:7.595.98.242.734.783.2]Presence of water vapour content in the satellite image of hurricane adds to better prediction of the hurricane. Additional factors such as sea surface temperature, low pres-sure, vertical wind shear, moisture profiles, precipitation that
TABLE VI: Sensitivity, specificity, accuracy, precision rate of the proposed model
Performance measure Percentage (%) Sensitivity 95.65 Specificity 70.97 Accuracy 88.00 Precision Rate 88.00
contribute to hurricane can be considered while emphasizing on predictions in the future.
REFERENCES
[1] Antonio Reppucci, Susanne Lehner, Johannes Schulz-Stellenfleth and Stephan Brusch, “Tropical Cyclone Intensity Estimated From Wide-Swath SAR Images,” IEEE Transactions on Geoscience and Remote Sensing, 2010, pp.1639-1649.
[2] R. S. Stankovic and B. J. Falkowski, “The Haar Wavelet Transform: Its Status and Achievement,”Computers and Electrical Engineering, 2000, pp.25-44.
[3] J. Hartigan and M. Wong, “Algorithm AS136: A K-Means Clustering Algorithm,”Journal of the Royal Statistical Society, 1979, pp.100-108. [4] R. A. Jarvis and E. A. Patrick, “Clustering Using a Similarity Measure Based on Shared Nearest Neighbors,”IEEE Transactions on Computers, 1973, pp.1025-1034.
[5] T. Kanungo, D. M. Mount, N. S. Netanyaho, C. D. Piatko, R. Silverman and A. Y. Wu, “An Efficient K-means Clustering Algorithm: Analysis and Implementation,” IEEE Transactions on Pattern Analysis and Machine Intelligence, 2002.
[6] Yonghui Weng, Meng Zhang and Fuqing Zhang, “Advanced Data As-similation For Cloud-Resolving Hurricane Initialization and Prediction,”
Computing in Science & Engineering, 2010, pp.1-24.
[7] Brent A. Williams and David G. Long, “Estimation of Hurricane Winds from Sea Winds at Ultrahigh Resolution,” IEEE Transactions on Geoscience and Remote Sensing, 2008, pp.2924-2935.
[8] Fuqing Zhang, Yonghui Weng, Jason A. Sippel, Zhiyong Meng, and Craig H. Bishop, “ Cloud-Resolving Hurricane Initialization and Pre-diction through Assimilation of Doppler Radar Observations with an Ensemble KalmanFilter,” AMS Monthly Weather Review, July 2009, pp.2105-2125.
[9] Shuyi S. Chen, James F. Price, Wei Zhao, Mark A. Donelan and Edward J. Walsh, “The CBLAST-Hurricane Program and the Next-Generation Fully Coupled Atmosphere-Wave-Ocean Models for Hurri-cane Research and Prediction,”Bulletin of the American Meteorological Society, 2006.
[10] Alark Joshi, Jesus Caban, Penny Rheingans and Lynn Sparling, “Case Study on Visualizing Hurricanes Using Illustration-Inspired Tech-niques,” IEEE transactions on visualization and computer graphics, 2009, pp.709-718.
[11] Banner I. Miller and Peter P. Chase, “Prediction of Hurricane mo-tion by statistical methods,” American Meteorological Society, 1966, pp.399406.
[12] Colin Price, Mustafa Asfur and Yoav Yair, “Maximum hurricane in-tensity preceded by increase in lightning frequency,”Nature Geoscience 2, 2009, pp.329-332.
[13] Patrick J. Michaels, Paul C. Knappenberger and Robert E. Davis, “Sea-surface temperatures and tropical cyclones in the Atlantic basin,”
Geophysical Research Letters, 2006, pp.1-4.
[14] Kanwaljot Singh Sidhu, Baljeet Singh Khaira and Ishpreet Singh Virk, “Medical Image Denoising In The Wavelet Domain Using Haar And DB3 Filtering,” International Refereed Journal of Engineering and Science, 2012, pp.1-8.
[15] Mohammed Gulam Ahamad, Abdulaziz Almazyad and Syed Amjad Ali, “Design and Development of New Parametric Wavelet for Image Denoising,” International Journal of Electronics and Communication Engineering, 2011, pp.1-9.