of Non-Agricultural Incomes and
Incidence of Certain Taxes
By L. REASON.
{Read before the Society on March 10th, 1961) INTRODUCTION
Dissatisfaction with the existing tax structure, in so far as it has any rational basis, probably derives in large measure from the feeling that the incidence of taxation is inequitable or, to put it another way, that the other fellow is not paying as much as he should. This prompts the questions : What is the incidence of the existing taxes and to what extent is the impact of the taxes offset by benefits provided out of tax revenue? No data have yet been published which would attempt to answer these questions so far as this country is concerned.
In the case of Britain and the United States a considerable body of literature exists regarding investigations into the weight of existing tax structures on persons of varying incomes. So far as I am aware the most recent major work on this subject is that by Allan M. Cartter entitled The Redistribution of Income in Post-War
Britain.1 This book also contains references to the literature on the subject.
My interest in this subject stems from a period I spent as Assistant Secretary of the Commission on Income Taxation. During this period I did the work on which this paper is grounded. I am grateful to the Commission for permission to publish the material incorporated in this paper. I must also acknowledge the assistance accorded to me by the Office of the Revenue Commissioners, the Central Statistics Office and other Government Departments in allowing me access to unpublished material and in permitting me to utilise in this paper information derived from this material.
At the outset of this investigation I hoped to be able to classify all personal incomes by income ranges. For reasons which I will advert to later I had to abandon this idea in favour of a more limited approach. I also hoped to allocate all taxes, direct and indirect, according to the income ranges of those who paid them and also to allocate under income ranges all benefits in the form of transfer and other payments which, in the hands of those who receive them, are an offset to taxation. The purpose of this was to ascertain the income levels at which there were net gains or losses
arising out of the financial operations of government. These objectives had to be modified or abandoned. It proved possible to allocate under income ranges certain taxes only—admittedly those providing the great bulk of tax revenue. Information was not available on which io allocate benefits paid by public authorities
It is not possible to provide information on the distribution of incomes in the agricultural sector. The main material on which a distribution of agricultural incomes might be based is contained in the national farm surveys. The first year for which survey in-formation is available is 1955-56, i.e., a year later than the period covered by this investigation, and it relates to the income of farm families from farming as distinct from the incomes of individual farmers from all activities. There is the further point that the material in the household budget inquiry, 1951-52, which was used to estimate the incidence of certain taxes on expenditure relates to non-agricultural households only and could not be regarded as furnishing a satisfactory basis for estimating the incidence of such taxes on agricultural incomes. The exclusion of agricultural in-comes was, therefore, the first and main compromise dictated by lack of suitable basic statistical material.
The remainder of this paper falls into four parts as follows : I. Distribution of non-agricultural incomes.
II. Incidence of income tax and sur-tax. III. Incidence of certain taxes on expenditure. IV. Conclusion.
Many of the estimates contained in the paper, particularly those in Part III, must be regarded as first approximations.
The income distribution and estimates of incidence of tax relate to the calendar year 1954 or the financial year 1954-55 (in the case of income tax the year of assessment 1955-56) these periods being chosen because when I began the investigation they were relatively recent and at the same time did not appear to be too remote from certain basic statistical data which I proposed to use, namely, the Census of Incomes for 1950/51 compiled by the Revenue Com-missioners and the Household Budget Inquiry, 1951/52. The Census of Incomes coiners all persons effectively liable to tax and a proportion of those whose incomes fire above the effective exemption limit but who are exempt because of the operation of allowances, etc.
I. DISTRIBUTION OF NON-AGRICULTURAL INCOMES
Scope of income distribution
to the practical difficulty of estimating their total income from all sources. Persons who had both a full-time occupation and a part-time occupation are included in the income distribution only in respect of earnings from their full-time occupation. Furthermore, in the case of employees, income from employment only and not from any other source was included. Thus account was not taken of investment income of employees. Here again this was a restriction imposed by the statistical material available in relation to employees.
An examination of the income tax assessments of employees—I am referring to the position which existed before PA YE—would enable a classification of the total personal incomes from all sources of employees effectively liable to tax to be made. As already indicated, such a classification was, in fact, prepared by the Revenue Commissioners for their own purposes in respect of the year of assessment 1950-51. An approach on these lines would not, how-ever, give comprehensive data on employees' incomes because, while it would cover all those effectively liable to tax, it would not include all persons with incomes above the effective exemption limit who because of the operation of the income tax personal allowances, etc. were not liable to tax, and persons whose incomes were below the effective exemption limit.
The first white paper on national income and expenditure con-tained a classification of personal income by income ranges for the years 1938 and 1943. The total number of persons whose incomes were classified was 161,091 and 198,301 respectively. These figures are considerably lower than the total covered by the present income distribution, namely 701,000 persons.
Methods adopted for estimating incomes of employees
For the purpose of compiling a distribution of employees' incomes information available in the Central Statistics Office and other Government Departments was used and supplemented by an examination of a selected sample of returns of employees' remuneration (forms 46) submitted by employers to the various Inspectors of Taxes throughout the country. The methods adopted fall into four categories :—
Method (1) Examination on a 100 per cent, basis of the pay-ment records of certain Governpay-ment Departpay-ments and of certain individual employers' returns of employees' remuneration (forms 46) held in income tax offices.
Method (2) Use of material on employees' remuneration in the hands of the Central Statistics Office, mainly the census of industrial production (C.I.P.) and the civil service census.
Method (3; Examination of the returns of employees' remun-eration (forms 46) in respect of a representative
sample of employers in the economic sector for
Method (4) Attribution of conjectural income to employees whose numbers and occupations are listed in the 195] census of population and whose incomes were not covered under methods (1), (2) and (3) above. Methods (1), (2) and (3) may be regarded as yielding firm to good estimates of employees' remuneration. As regards method (2) it may be noted that the census of industrial production, 1954, did not give an income distribution for salaried employees in industry. The methods by which a distribution by income ranges for these employees was estimated is set out in the Technical Appendix. The estimates yielded by method (4), being based on assumptions regarding the incomes receivable in certain occupations, are not as reliable as those yielded by methods (1), (2) and (3).
Application of methods for estimating employees' income
Methods (1), (2) and (3) were applied to a total of 441,000 employees. The income distribution in respect of these employees may, therefore, be regarded as reasonably reliable. The estimates derived by method (4) cover 163,000 employees approximately and must be regarded as less reliable. It may be of interest to indicate the methods of estimation applied to particular groups.
Method applied
(1)
(2)
(3)
(4)
Group
Air companies, Central Bank, Hospitals' Trust, lay teachers (primary, secondary and vocational), Gardai, certain local authority employees and Army.
Employees of firms, etc. m C.I.P. 1954, civil service and railways.
Distribution (wholesale and retail), insurance companies, commercial banks and universities.
Small industrial firms not covered by the census of industrial production, certain transport employees, certain professional employees (e.g. nurses, law clerks), personal domestic service, hotels, entertainment and sport and miscellaneous.
Total :
No. of employees involved
50,578 284,462
106,292
162,539 603,871
not available and, second, that the figure for Schedule E sur-tax payers includes cases (the number of which is not available) where the wife's income was aggregated with the husband's, thereby bringing him into the sur-tax range. In the income distribution husband and wife at work were regarded as separate earning units and their incomes were included separately.
Estimation of employers', etc. income
According to the census of population, 1951, the total number of employers, persons working on their own account and persons assisting relatives in non-agricultural occupations was 97,000 approximately. On the basis of the census of incomes relating to the year of assessment, 1950-51, compiled by the Revenue Com-missioners, the total number of persons liable under Schedule D whose incomes were mainly earned was 36,000 approximately con-sisting of 25,000 persons effectively liable to tax and roughly 11,000 cases where there was no net liability to tax. In the absence of any more up-to-date material it was decided to use the 1950-51 data, suitably adjusted to cover the rise in incomes in the period up to 1954, for the purpose of providing an income distribution for the group of 36,000 persons approximately in respect of the year 1954. This group is called the " Schedule D group " in order to distinguish it from other employers, etc., included in the figure of 97,000 referred to earlier. A 20 per cent, increase in incomes in the period up to 1954 was postulated. This increase lies roughly mid-way between the increase in Schedule D actual in-come between 1950-51 and 1955-56 as disclosed in the Revenue Commissioners' reports and the increase in the relevant national income aggregates. Group income limits were increased by 20 per cent, throughout, and cumulative frequencies for the original group limits were then interpolated using second-order differences. The income distribution arrived at on this basis is set out in Appendix Table I. The total number in the range £1,501 and over which emerged was 4,303 or some 1,400 more than the esti-mated number of Schedule D sur-tax payers whose income is mainly earned. There is no means of eliminating this excess ex-cept by merely reducing the number in the sur-tax range to the estimated figure of 2,900. The effect of this is to reduce the number in the Schedule D group by 1,400 to 34,000 approximately with a corresponding increase in the number entered under the head " Other " of Appendix Table I. It may be mentioned that in principle this distribution would take account of investment income accruing to the Schedule D group.
The balance of the total of approximately 97,000 employers, persons working on their own account, etc. was assumed to fall into the lower income groups indicated in Appendix Table I under the head " Other " and to have an aggregate income of £18 million.
each range. For the under £240 range a mean income of £180 was assumed and for the £1,501 and over range a mean income of £2,000 was assumed for employees and £3,000 for the Schedule D group. The weighted average income for employees and for the Schedule D group in the £1,501 and over range worked out at £2,500 approximately. The latter figure was used to compute the income lax and sur-tax for the £1,501 and over range shown in Appendix Table II.
Comparison between total at work and total included in income distribution
The tota] covered by the income distribution is 701,000. Accord-ing to the Trend of Employment and Unemployment in 1959 (page 8), the total at work outside agriculture, forestry and fishing in 1954 was estimated at 725,000. Some difference between the two totals is, perhaps, to be expected as they are derived from different sources. The total covered by the income distribution is some 24,000 less than the estimate of the total at work in 1954. Of this 24,000, approximately 20,000 are accounted for by the ex-clusion from the income distribution of religious employed in education (whose salaries are regarded for national income purposes as profits), theological students and other persons such as those working outside the country and those working in industries not specified in the census of population, 1951. The balance of 4,000 is probably mainly accounted for, as suggested earlier, by casual variations caused by the use of different statistical sources.
Comparison between national income aggregates and income dis-tribution aggregates
The total of wages, salaries and pensions included in the national income estimates for 1954 is £201 million. This figure in-cludes social security contributions by insured employees out of wages and salaries but not the social security benefits received by them. It also includes pensions paid to employees by the State and private employers. No information is available as to the aggregate value of these pensions but it is thought not to be un-reasonable to assume a figure of £5 million. On this basis the total of wages and salaries would amount to £196 million. The corresponding figure derived from the income distribution (it is arrived at by adding together the income aggregates for each income range) is £198 million or 1-0 per cent, more than the national income aggregate of £196 million.
It is not possible to estimate with any degree of accuracy the appropriate aggregate personal income in respect of the 97,000 employers, persons working on their own account, etc. It cannot exceed £72-6 million, which figure is arrived at as follows :—
£m. Profits other than of companies, professional
earnings, etc. . . ... . . 32*6 Irish and foreign investment income including
distributed profits of Irish companies and
The investment income accrued not only to the 97,000 employers,, persons working on their own account, etc. but also to employees, persons whose incomes are mainly unearned, persons engaged in agriculture, persons living abroad and, so far as foreign investment income is concerned, to companies. It is not possible to distinguish the total income which accrued to employers, etc. It must amount to £32-6 million plus an additional sum in respect of foreign in-vestment income, distributed profits of Irish companies and national debt interest. If this additional sum is taken to be of the order of £15 million the total income which accrued to the 97,000 em-ployers, etc. would amount to £47*6 million. It will be recollected that the income distribution in respect of employers, etc. provides for an aggregate income of some £3 million less, i.e. £44 million approximately of which £26 million represents the amount attributed to the Schedule D group and £18 million the amount attributed to those in the category " Other " in Appendix Table L
Reliability of income estimates
Of the total of 700,000 persons covered by the income dis-tribution it has been necessary to resort to conjectural estimates in respect of about 160,000 employees. The estimates in respect of the 97,000 employers, etc. must also be regarded as being of a conjectural nature. Accordingly, the income estimates covering about 260,000 persons out of the total of 700,000 cannot be regarded as firmly based. The incomes attributed to the remaining 440,000 persons may be regarded as reasonably reliable. Another point to be noted which I have referred to already is that the methods of estimation adopted showed the number of Schedule E sur-tax payers to be 1,200 less, and the number of Schedule D sur-tax payers to be some 1,400 more, than the number estimated by Revenue.
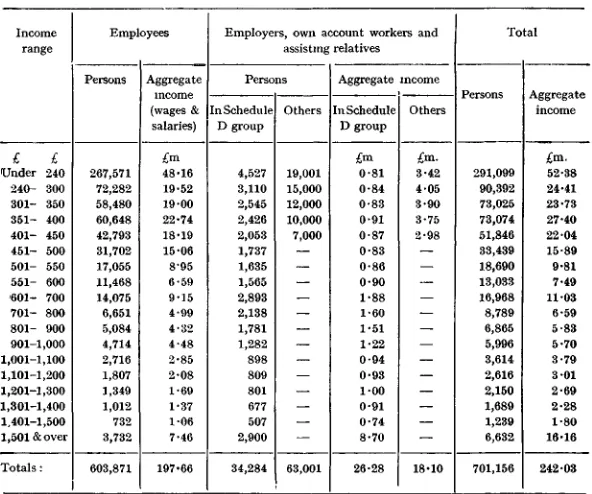
Home comments on the income distribution
The outstanding feature of the income distribution is the very high proportion of persons in non-agricultural occupations whose incomes in 1954 did not exceed £600 £>year. The following table summarises the i
Range of Income
Not exceeding £600 . £600-£l,000 £l,000-£l,500 Over £1,500
Numbers
Actua
644,600 38,600 11,300 6,600
Percentage Distribution
91-9 5-5 1-6 1-0
unearned and total personal incomes oi' employees. In these respects they differ from the figures given in the income dis-tribution but it is thought that these differences may not be so marked as to vitiate the comparison given in the table.
Range of Income
Not exceeding £250 £250-£500
£500-£l,000 Over £1,000
Totals :
Percentage Distribution
Ireland
44-4 430 10-0 2-6
100-0
Britain
34-2 34-4 28-1 3-3
1000
The figures emphasise the generally lower level of incomes in this country as compared with Britain.
II. INCIDENCE OF INCOME TAX AND SUR-TAX Preliminary
The only figures available on which estimates of the incidence of income tax and sur-tax could be based are those contained in the census of incomes prepared by the Revenue Commissioners for the year of assessment 1950/51. The census figures showed the total number of taxpayers effectively liable to income tax by ranges of income before tax and by personal circumstances, e.g. single, married, married with one child, etc. On the basis of a number of assumptions as to the rise in incomes and the effect of the various changes in income tax rates and allowances which took place since the census was compiled a projection for total personal incomes, mainly earned, was prepared by reference to the 1950/51 figures in respect of the year 1955/56. It is scarcely necessary to stress that the projection which emerged from this exercise must be regarded with reserve.
Methods adopted for computing the incidence of income tax and sur-tax
In the income ranges below £1,101 income tax liability at 1955/56 rates appropriate to the mid-point of each income range was computed, due regard being had to the personal circumstances of the taxpayers in each range as disclosed by the projection. The tax figures thus obtained were multiplied by the appropriate numbers of income tax payers in the various income ranges to give the aggregate tax in respect of each range. It was assumed in making the computation that all the income of the taxpayers was earned income. This assumption is probably a pretty accurate reflection of the actual position in these ranges.
In the income ranges £1,101 and over the figures in the pro-jection had to be adjusted so as to eliminate as far as possible the effect of the inclusion of the unearned income of employees and the aggregation of the incomes of married couples. The aggregate tax for these ranges was computed in the same manner as for the lower ranges and was scaled down by the proportion which the total number of persons in each range according to the income distribution bore to 1he total number of taxpayers in each range according to the projection. The scaled down aggregates were then divided by the total number of persons in the relevant income ranges according to the income distribution dealt with in Part I above to give the average tax per income tax piayer and per person. A comparable procedure was adopted in relation to the tax aggregates for the ranges below £1,101, scaling down not of course being necessary, to obtain the average tax per tax payer and per person in the income ranges below £1,101. It will be noted that, in contrast to the position in relation to the income ranges £1,101 and over, the figures for average tax per tax payer and per person in each of the lower income ranges are different. This is because the numbers of income tax payers in these ranges do not coincide with the total numbers of persons in these ranges.
Appendix Table II gives figures for the average amount of income tax and sur-tax paid by persons in each of the income ranges set out in the income distribution. Certain other figures which may be of interest, e.g. the aggregate tax in respect of each income range and the average tax payable per tax payer are also given in Appendix Table II.
Reliability of estimates of incidence of income tax and sur-tax
The fact that the projection on which the estimates are based must be regarded with reserve has already been mentioned.
exclusion from the projection in these ranges of the individual incomes of earning husbands and wives whose aggregate incomes fall into the higher ranges of the projection. Such persons who, it will be recalled, are included as separate earning units in the income distribution are—even with wife's earned income relief— taxed more heavily than single persons Aviih the same income.
Estimate of total income tax and sur-tax on non-agricultural incomes
The total income tax and sur-tax accounted for by the distri-bution in Appendix Table II is £10*9m. out of a total Exchequer receipt for 1955-56 of £24-8m. It is difficult to account with certitude for the balance of £13-9 million. The following tentative estimates are put forward to account for this balance.
£ million
Income tax on companies undistributed profits 8-0 Income tax and sur-tax payable by persons whose
income is mainly unearned 4-5 Income tax and sur-tax on investment income of
employees and persons in the agricultural sector
and on pensions 1-4
£13-9 million
Home co77iments on the incidence of income tax and sur-tax It will be noted that so far as the income ranges below £1,101 are concerned there are marked differences between the numbers of persons in each income range and the number effectively liable to income tax and sur-tax. These differences are reflected in the figures for the average tax payable per income tax payer and per person, the latter figure being substantially lower. It is clear that the low level of incomes in this country coupled with the various personal allowances and reliefs granted for Income Tax purposes, explains the gap which exists between the total at work in non-agricultural occupations and the total effectively liable to income tax.
As will be apparent from Appendix Table VI income tax shows a definite progressive tendency through all income ranges rising from 1-0 per cent in the range £240-£300 to 26-5 per cent, in the range of £1,501 and over. Even in the lower income ranges where, as will be seen later, taxes on expenditure as a proportion of income are relatively stable, income tax shows, in contrast, a noticeable progression. The tendency towards progression is, however, most in evidence in the income ranges above £600.
the raising of the sur-tax starting point from £1,500 to £2,000 and the granting of the income tax personal allowances as deductions for sur-tax purposes would have some effect on the incidence of income taxation. For example, the effective exemption limit for earned income is now £312 as against £240 for the period covered by the study.
III.—INCIDENCE OF CERTAIN TAXES ON EXPENDITURE Preliminary
One of the difficulties associated with estimating the incidence of taxes on expenditure is the lack of comprehensive information showing, by income ranges, the distribution of persona] spending on goods and services. In this respect the position in Great Britain is better as there has been a number of investigations into family expenditure which have been used by Cartter and his predecessors to produce estimates of the distribution of taxation by income ranges. Even with such information a considerable element of estimation and guess-work entered into the compilation of these estimates.
For the purpose of computing the incidence of taxes on expen-diture in this country it is necessary to fall back on the information published in the report on the household budget inquiry, 1951/52, which gives, inter alia, weekly expenditure figures for households in towns and villages I must again stress the tentative nature of the estimates which emerged. They suffer from all the imperfections of a first attempt based on very limited statistical data.
Scope of investigation
occupations only. Taxes on expenditure paid by, e.g., persons in the agricultural sector and by externs such as tourists are in princip]e excluded.
Estimation of incomes
Tables 3 and 6 of the report on the household budget inquiry give figures in respect of total weekly household expenditure. Such expenditure, expressed on an annual basis and adjusted upwards in line with the rise in the cost of living between 1951-52 and 1954; was regarded as being equivalent to annual household income. It was thought that this approach would give a more accurate indica-tion of income than the income figures contained in the report. Accordingly, household expenditure, as distinct from household income, determined the income range to which the various tax estimates were allocated. It was assumed that the relationship between household income as defined and taxes on expenditure by households is the same as the relationship between the incomes of individuals and taxes on expenditure by individuals. It is impor-tant to note this assumption because, as I explain later, it seems likely to have the effect of causing taxes on expenditure to be over-stated.
Where it was found possible to use Table 6 of the report on the household budget inquiry and the supplementary information con-tained in Table 6 (A) sixteen income figures (obcon-tained as indicated in the preceding paragraph) were available which could be related to specified expenditure on dutiable commodities. Tables 3 and 3 (A) were resorted to only where Tables 6 and 6 (A) did not yield usable material and only four sets of income and expenditure figures were obtained by this means.
Tables 6 and 6 (A) were used to relate annual incomes to expen-diture on tobacco, alcohol and entertainments. Tables 3 and 3 (A) were used in the case of rates and private motoring.
Estimation of tax element in household budget expenditure figures
expenditure data had to be made as to the increase in private motoring costs between 1951-52 and 1954, the total cost of private motoring in 1954 (including the cost of new cars) outside the business and agricultural sectors and the tax element in the total cost. In the absence of any better information the increase in motoring costs between 1951-52 and 1954 was assumed to be the same as the rise in the cost of living index in that period, namely 11 per cent, approximately. During this period one item entering into the cost of private motoring, namely standard grade petrol, rose in price by about 12 per cent. If the price rise is measured by reference to the cost of premium petrol introduced in 1953 the increase in the price of petrol was 22 per cent, approximately. The true increase during this period might perhaps have been as high as 15 per cent. The household expenditure figures, adjusted for the increase in motoring costs between 1951-52 and 1954 and multi-plied by the fraction representing the estimated tax element in the total cost of non-agricultural private motoring in 1954, gave the private motoring tax figures.
A special position arose in the case of alcohol because of the fact that the levels of expenditure reported in the household budget inquiry were, to quote the words of the report on the inquiry,
" considerably under-stated ". The methods adopted to compute
the estimates of the incidence of the duty on alcoholic beverages are set out in the Technical Appendix.
Estimation of incidence of taxes on expenditure over income ranges
The information in the household budget inquiry report enabled sixteen sets of figures for incomes and tax payable to be computed in respect of tobacco, alcohol and entertainments and four sets of figures in respect of rates and the tax on private motoring. The tax figures related to the relevant income only and the problem was to ascertain the tax appropriate to the set of income ranges evolved for the income distribution described earlier. The methods adopted for this purpose are outlined in the Technical Appendix. The results obtained by the adoption of the methods of estimation described in the Technical Appendix are set out in Appendix Tables III, IV and V, which show by income ranges in respect of the dutiable items mentioned the average annual duty paid per person, the average annual duty paid per person as a percentage of the mid-point of each income range and the aggregate annual duty paid.
Reliability of the estimates of taxes on expenditure over income ranges
Because of the assumptions which had to be made in computing the estimates they must be regarded as of a tentative character. The trend disclosed by the estimates must, therefore, be regarded as of greater significance than their absolute levels. Some other points are, perhaps, worth mentioning.
equivalent to household income and the tax figures in Appendix Tables III, IV and V relate to household rather than individual expenditure. In some households there is more than one earner and this is reflected in the household budget figures which indicate that the average number of male earners is 1-15 and of female earners 0-59. It is only reasonable to assume that a greater proportion of the incomes of these " supplementary earners " is absorbed in taxable expenditure on certain items such as enter-tainments, alcohol and tobacco than is the case with the main earner who bears the major share of the household running costs. For this reason the tax computations may overstate the tax paid by individual earners in some income ranges.
The figures for rates are overstated. The household budget figures used as a basis for the rates computations give the rates paid per owner-occupier. Owner-occupied dwellings might be expected to be more highly rated than rented dwellings including those let by local authorities at rents, including rates, which are subsidised. The distortion in the estimates of incidence of rates arising from this circumstance would be most marked in the lower income ranges where the number of owner-occupiers is insignificant. There are, as indicated in the Technical Appendix, reasons for believing that the tax on private motoring is significantly over-stated in the £1,501 and over income range.
The total tax accounted for by each of the five tax distributions (see Appendix Table V) is as follows. The aggregates were obtained by multiplying the average tax per person in each income range by the total number of earners in that range. For purposes of comparison, figures are also given of the total tax collected in 1954 or 1954-55
Tobacco Alcohol Entertainments Private motoring
Rates
Total tax accounted for by tax distribution
(1). £ million
8-5 8-2 0-8 3-4
11-2
Total tax collected 1954 or 1954-55
(2) £ million
22-2 16-0 1-3
Separate figures not available
17-0
computations) which appear in the first column of the preceding table.
£ m. Tobacco 10-0 Alcohol 8-8 Entertainments 0 • 7 Private motoring 2*7 Bates 8-0
The main divergences to be noted arc those in relation to tobacco and rates. The aggregate tax accounted for by the tax distribu-tion is, in the case of tabacco, lower, and, in the case of rates, higher, than the comparable figure arrived at by direct estimate. An explanation of the discrepancy in the case of tobacco is not readily apparent. It may be noted, however, that 1 per cent, of the total tax on tobacco amounts to £220,000. Accordingly a small per-centage error in estimating the tax on consumption by externs or by the agricultural sector would have a significant effect on the estimate arrived at by direct means. The reason for the divergence in the case of rates has already been noted.
In the case of private motoring the fact that the aggregate accounted for by the tax distribution is about £0-7 m. higher than the figure arrived at by direct estimate is accounted for to some extent by the overstatement in the tax distribution of the duty in respect of the highest income range.
IV. CONCLUSION
Appendix Table VI summarises the results of the investigation. These show that the lowest proportion of income absorbed by taxation is 11-6 per cent, in the range £240-£300 and the highest 60-3 per cent, in the range £1,501 and over. It is clear that the effect of income tax (including sur-tax) is to impart an over-all progressive tendency to the incidence of taxation in all income ranges including the lower ranges where taxes on expenditure taken as a whole are proportional in character. It is necessary again to stress that the figures shown for the highest income range arc over-stated. Making due allowance for this, however, it is clear that taxation absorbs a sizeable proportion of higher incomes.
£301-£350. The figure of 12-3 per cent, in respect of the lowest income range bears the impact of the inflated figure for rates which has already been explained.
A further point to be noted is that it has not been found possible to provide estimates of the incidence of taxes on expenditure on incomes in excess of the mean figure of £2,500 assumed for the income range £1,501 and over. It seems reasonable to assume, however, that at income levels in excess of £2,500 the proportion of income absorbed by taxes on expenditure will diminish as income rises. There are, therefore, definite limits to the tendency towards progression in expenditure taxes displayed by the figures given in Appendix Table IV.
As regards tobacco the evidence points to the tax being generally proportional except possibly in the higher income ranges where indications of regressiveness emerge. In the lowest income range, however, the duty absorbs a higher proportion of income (4-4 per cent.) than in any other range. The proportion of income absorbed by the duty is smallest in the highest income range, £1,501 and over.
In the case of alcohol there is no evidence of regression. Broadly speaking the tendency of the duty is progressive with some evidence of proportionality in the loAver income ranges. The duty absorbs 1-9 per cent, of income in the lowest income range, 3*9 per cent, in the £551-£600 range and 6-3 per cent, in the highest income range.
Entertainments duly in terms of the proportion of income absorbed by it is not of any great significance. The over-all tendency is slightly progressive with evidence of proportionality over some income ranges. The duty absorbs 0*1 per cent, of income in the lowest income range and 0-6 per cent, in the highest income range.
The duty on private motoring also shows a progressive trend. Attention is directed to the fact that the duty figure for the highest income range is significantly over-stated.
On the basis of the highly selective approach which, as 1 have already explained, had to be made in this study, it would seem that rates bear more heavily on persons in the lowest income range than in any other range up to and including the £l,401-£l,500 range. The tendency of the figures for rates is regressive or proportional in the ranges up to £700. Above this figure a steady progressive tendency is evident. It will be apparent from my previous remarks about the reliability of the figures for rates that these conclusions must be regarded with reserve.
ACKNOWLEDGEMENT
APPENDIX.
TABLE I.—ANNUAL INCOME CLASSIFIED BY INCOME RANGES, 1954.—
NON-AGRICULTURAL OCCUPATIONS Income range £ £ Under 240 240- 300 301- 350 351- 400 401- 450 451- 500 501- 550 551- 600 601- 700 701- 800 801- 900 901-1,000 1,001-1,100 1,101-1,200 1,201-1,300 1,301-1,400 1,401-1,500 1,501 & over
Totals : Empl Persons 267,571 72,282 58,480 60,648 42,793 31,702 17,055 11,468 14,075 6,651 5,084 4,714 2,716 1,807 1,349 1,012 732 3,732 603,871 oyees Aggregate income (wages & salaries) 48-16 19-52 19-00 22-74 18-19 15-06 8-95 6-59 9-15 4-99 4-32 4-48 2-85 2-08 1-69 1-37 1-06 7-46 197-66
T A B L E I I . — I N C I D E N C E OF INCOME TAX AND SUR-TAX BY INCOME R A N G E S —
INCOME MAINLY EARNED.
Y E A R OF ASSESSMENT, 1955-56 (1954-55 ACTUAL).
J.LX\J\J l i l t ?
range
£ £ Under 240
240- 300 3 0 1 - 350 3 5 1 - 400 4 0 1 - 450 4 5 1 - 500 5 0 1 - 550 5 5 1 - 600 6 0 1 - 700 7 0 1 - 800 8 0 1 - 900 901-1,000 1,001-1,100 1,101-1,200 1,201-1,300 1,301-1,400 1,401-1,500 1,501 & over
All income ranges Income tax Estimated number . 30,070 22,530 17,440 14,770 15,110 10,100 8,000 10,280 6,690 4,980 4,120 3,470 2,800 (2,616) 2,690 (2,150) 2,170 (1,689) 1,980 (1,239) 7,800 (6,632) 165,000 payers Aggregate t a x payable
£ m .
0-24 0-32 0-43 0-39 0-46 0-42 0-39 0-58 0-47 0-45 0-44 0-46 0-40 0-40 0-35 0-30 4-40 10-90
Average t a x payable
Per income tax payer in
range £ . . 7-87 14-07 24-38 26-68 30-20 41-76 49-06 56-66 70-69 90-69 107-15 132-44 152-59 184-35 206-41 240-00 663-51 66-07
Per person in income range £ 2-62 4-34 5-82 7-60 13-65 22»57 30-11 34-33 53-80 65-79 73-62 127-16 152-59 184-35 206-41 240-00 663-51 15-57
NOTE : The estimates of the numbers of income t a x payers in each income range are derived from a projection based on the census of incomes compiled by t h e Revenue Commissioners in respect of t h e year of assessment 1950-51.
TABLE III.-—AVERAGE ANNUAL DUTY PAID PER PERSON IN RESPECT OF CERTAIN-T A X E S ON EXPENDICERTAIN-TURE.
Income range £ £ Under 240 240-300 301-350 351-400 401-450 451-500 501-550 551-600 601-700 701-800 801-900 901-1,000 1,001-1,100 1,101-1,200 1,201-1,300 1,301-1,400 1,401-1,500 1,501 and over All income ranges Tobacco 8-00 9-00 11-00 13-00 14-25 16-00 18-00 19-00 21-50 24-25 27-50 30-00 3200 3500 37-50 4000 42-00 64-00 1217 Alcohol 3-39 6-79 9-05 12-44 1414 17-53 19-23 22-62 26-01 32-80 39-59 45-24 5203 58-81 65-60 71-25 79-17 158-34 11-65 Entertain-ments £ 0-10 0-50 0-75 1-25 1-50 2-00 2-25 2-50
3 0 0
3-75 4-50 5-00 5-75 6-50 7-00 7-75 8-50 15-90 1-10 Private motoring .
0 0 2
0-09 0-21 0-43 0-74
1 1 9
1-80
3 0 3
5-44 8-97 13-66 19-94 27-71 37-39 49-39 63-49 406-13 4-88 Rates 10-66 12-26 1319 14-26 15-46 16-80 18-26 19-86 22-66 26-79 31-59 37-06 4306 49-72 57-05 64-78 7318 200-22 15-94 Total 22-15 28-57 34-08 4116 45-78 5307 58-93 65-78 76-20 9303 11215 130-96 152-78 177-74 204-54 23317 266-34 844-59 45-74
TABLE IV.—AVERAGE ANNUAL DUTY PAID PER PERSON AS A PERCENTAGE OF THE MID-POINT OF INCOME RANGE.
Income range £ £ Under 240 240-300 301-350 351-400 401-450 451-500 501-550 551-600 601-700 701-800 801-900 901-1,000 1,001-1,100 1,101-1,200 1,201-1,300 1,301-1,400 1,401-1,500 1,501 and over Tobacco 4-4 3-3 3-4 3-5 3-4 3-4 3-4 3-3 3-3 3-2 3-2 3-2 3-0 3-0 3-0 3-0 2-9 2-6 Alcohol 1-9 2-5 2-8 3-3 3-3 3-7 3-7 3-9 4 0 4-4 4-7 4-8 5-0 5 1 5-2 5-3 5-5 6-3 Entertain-ments Percentage 0-1 0-2 0-2 0-3 0-4 0-4 0-4 0-4 0-5 0-5 0-5 0-5 0-5 0-6 0-6 0-6 0-6 0-6 Private motoring — 0 1 0-1 0-2 0-2 0-3 0-5 0-7 1 1 1-4 1-9 2-4 3-0 3-7 4-4 16-2 Rates 5-9 4-5 4 1 3-8 3-6 3-5 3-5 3-5 3-5 3-6 3-7 3-9 4-1 4-3 4-6 4-8 5-0 8-0 Total 12.3 10-6 10-5
1 1 0
TABLE V.—AGGREGATE DUTY PAID IN RESPECT OF CERTAIN TAXES ON EXPENDITURE. Income range £ £ Under 240 240- 300 301- 350 3 5 1 - 400 401- 450 451- 500 5 0 1 - 550 5 5 1 - 600 601- 700 701- 800 801- 900 901-1,000 1,001-1,100 1,101-1,200 1,201-1,300 1,301-1,400 1,401-1,500 1,501 and over Totals
Tobacco Alcohol Entertain-ments Private motoring £ million 2-33 0-81 0-80 0-95 0-74 0-54 0-34 0-25 0-36 0-21 0 1 9 0-18 0-12 0-09 0 08 0-07 0-05 0-42 8-53 0-99 0-61 0-66 0-91 0-73 0-59 0 36 0-29 0-44 0-29 0-27 0-27 0 1 9 0-15 0-14 0 1 2 0-10
1-05
8-16
0-03 0-05 0 0 5 0 0 9 0-08 0 0 7 0-04 0 0 3 0 0 5 0 0 3 0-03 0-03 0-02 0-02 0-02 0-01 0 0 1
0 1 1
0-77 . — 0-01 0-02 0-02 0-02 0-02 0-02 0 0 5 0 0 5 0-06 0-08 0-07 0 0 7 0-08 0-08 0-08 2-69 3-42 Rates
3 1 0 1 1 1 0-96 1 0 4 0-80 0-56 0-34 0-26 0-38 0-24 0-22 0-22 0-16 0 1 3 0-12 0-11 0-09 1-33 11-17 Total 6-45 2-58 2-48 3 0 1 2-37 1-78 1 1 0 0-85 1-28 0-82 0-77 0-78 0-56 0-46 0-44 0-39 0-33 5-60 3205
TABLE VI.—INCIDENCE OF VARIOUS TAXES CLASSIFIED BY INCOME RANGES.
1954 AND 1954-55.
Income range Under 240 240- 300 301- 350 351- 400 401- 450 451- 500 501- 550 551- 600 601- 700 701- 800 801- 900 901- 1,001- ,101- ,201- ,301- ,401-,000 ,100 ,200 ,300 ,400 ,500 ,501 and over Totals
Tax payable per person
Taxes on expenditure 2-62 4-34 5-82 7-60 13-65 22-57 30-11 34-33 53-80 65-79 73-62 127-16 152-59 184-35 206-41 24000 663-51 15-55 Total 22-15 28-57 34-08 41-16 45-78 53-07 58-93 65-78 76-20 93-03 11215 130-96 152-78 177-74 204-54 23317 266-34 844-59 45-74 2215 3119 38-42 46-98 53-38 66-72 81-50 95-89 110-53 146-83 177-94 204-58 279-94 330-33 388-89 439-58 506-34 1,508-10 61-29
Tax payable per person as a percentage of mid-point of income range.
Income tax and sur-tax Taxes on expen-diture Total Percentage 1-0 1-3 1-6 1-8 2-9 4-3 5-2 5-3 7-2 7-7 7-7 12-1 13-3 14-7 15-3 16-6 26-5 33-8 12-3 10-6 10-5 1 1 0 10-8 11-2 11-2 11-4 11-7 12-4 13-2 13-8 14-6 15-4 16-4 17-3 18-4 12-3 11-6 11-8 12-5 12-6 1 4 0 15-5 16-7 1 7 0 19-6 20-9 21-5 26-7 28-7 3 1 1 32-6 34-9
TECHNICAL APPENDIX
DETAILS OF CERTAIN MATHEMATICAL TECHNIQUES USED
1. Distribution by income ranges of salaried workers in industry The 1954 Census of Industrial Production (CIP) returns gave details of income distribution in respect of wage-earners only ; in addition there were a total of some 30,000 salaried employees for whom a detailed distribution was not available. Among these the number of males and females were approximately 19,000 and 11,000 respectively. Estimation of the income distribution of these categories had to be based on the 1952 CIP data, this being the last year for which detailed figures for salaried workers were available. In the case of females, the method used was to increase or decrease the numbers in each income range in accordance with the observed percentage change in numbers of female wage-earners in the same range between 1952 and 1954, the numbers then being given a uniform proportional adjustment to bring the total into agreement with the known total figure in 1954. This rather crude method was acceptable because the distribution for female salaried employees in 1952 was not very different from that of female wage-earners in the same year, and because in any case the adjusted figures formed only a small proportion of the total num-bers in the ranges concerned. In the case of male employees, how-ever, the distribution for salaried workers in 1954 was estimated separately by extrapolation from the information available for 1952. Some extrapolation was needed even in order to complete the 1952 distribution, as the 1952 CIP returns give detailed distribution covering the range up to £12 per week only, and about one third of all male salaried employees had incomes above this level.
Graphical examination of the 1952 figures showed that in the range £5 to £12 per week, actual numbers conformed quite closely with those given by a fitted lognormal distribution. The relation-ship was
P = 4-23 log L - 6-40 (1)
where L represents salary in pounds per annum, and P represents the probit function of the proportion p having salary up to level L, defined by
*1 ( 2 )
cent, between January 1952 and January 1954. The higher salary levels in industry are possibly more closely related to profits than to wages in year-to-year trend, and in this connection it was noted that total income in industry other than wages, salaries and pensions increased by some 32 per cent, between 1952 and 1954 (Irish Statistical Survey, 1956, Table A2). In the light of these considerations it was assumed that between 1952 and 1954 salaries increased by 10 per cent, at the 1952 level of £350 and by 30 per cent, at the 1952 level of £1,000 and that the form of the distribu-tion remained lognormal. On these assumpdistribu-tions it is found that corresponding salary levels in 1952 and 1954 are related by the equation
log L = 0-313 + 0-863 log L' (3)
where L and 1/ are corresponding salary levels in 1952 and 1954 respectively. Substituting from (3) in (1) the 1954 distribution of salary levels is obtained as
P = 3-65 log L' - 5.08 (4)
Percentage frequencies relating to the salary ranges shown in Appendix Table I were calculated from (4) and these were multiplied by the total number of male salaried workers in 1954 to give the absolute frequencies.
2. Incidence of taxes on expenditure at different levels of income Data given in the Household Budget Survey Report (Pr. 2520) enables the average incidence of different categories of taxation on expenditure to be estimated for sixteen categories of households, representing a cross-classification of all households in the Survey by four levels of household size and four ranges of income per head. Corresponding figures are also available for households broken down into four categories of income per head only, the figures being averaged over all household sizes as represented in the survey. The general approach adopted was to seek a simple approximate relationship between expenditure in the main taxable categories and total household income.* For categories of expendi-ture in which the relationship between expendiexpendi-ture and total income appeared to be reasonably independent of household size, a set of sixteen points was available for estimating the parameters of the income-expenditure curve, covering the range from £130 to £2,150 per annum in household income. This was found to apply to expenditure on entertainment and tobacco. In two other categories of expenditure, the amount spent and hence the incidence of taxation was found to depend on household size as well as household income, so that the aim was to estimate an
income-expenditure curve relating to national average household size and composition at each income level ; in these cases only four points were available for fitting the curve and the income levels covered ranged from £330 to £970 per annum. In the remaining category, alcohol, the position was doubtful ; the procedure adopted is described below.
The incidence of entertainments duty presented a comparatively simple picture. Expenditure was found to be directly propor-tional to excess of household income over £200 per annum and was negligible at levels of £200 and below. Deviations of the 16 points from this straight-line relationship were small and did not appear to be systematically related to household size. The equation obtained was
To =0-0067 (Y-200) (1)
where Y represents household income and T c the tax element in expenditure on entertainments, both figures being in pounds per annum. Here, as in all cases, the tax element is assumed propor-tional to total expenditure.
In the case of tobacco, a consistent curvilinear relationship was found between expenditure and household income, deviations again showing no apparent relationship with household size. On trans-formation to double log scales the relationship was still curvilinear. An equation was then sought in the form
log Tt = a -r b log (Y - Yo)
where T t represents the tax element in expenditure on tobacco in pounds per annum. The constant Yo, which represents the " threshold '* income at which expenditure on tobacco would theoretically be zero, was estimated by triaL and error, the criterion being that the graph of log Tt against log (Y-Yo) should show no systematic curvature. Working on these lines, it was found that the figures could be satisfactorily represented by
log Tt =—0-702 + 0-743 log (Y — 100) (2)
groups. An equation was therefore fitted by least squares of the form
log Ta = a, -4- b log (Y — 75)
where Ta represents the tax element in expenditure on alcohol
and the constant cu takes different values in the four categories of household size The results obtained were
b = 1 -225
ax = —2-74, a2 = -2-97, a3 = -2-96, a, = -3-07
where the suffices 1, 2, 3, 4 refer to the lour household size groups as designated in the Household Budget Survey report, i e. in order of increasing household size.
It is likely that some element of this indicated variation with household size is genuine, but it also seems likely that the element of under-reporting would vary systematically with household size and composition. In the absence of any information as to the relative importance of these two effects and in view of the fact that expenditure on tobacco was found to be effectively independent of household size, it was decided to assume that the whole of the variation between the ax values could be ascribed to variable
under-reporting. It should be noted that the absence of any noticeable coiTelation between expenditure on tobacco and household size may be due to the operation of two opposing trends in the individual figures; a negative correlation occurring with increasing numbers of children and a positive correlation with increasing numbers of adults. If this is the case, it would be reasonable to assume a similar situation with regard to alcohol.
On the basis of these considerations, it was assumed that the required relationship could be represented by
T a - K (Y-75)1'2 2 5 (3)
where K is an undetermined constant. The value of K was esti-mated by aggregating T/K as calculated from this equation over the distribution of incomes shown in Appendix Table I and equating aggregate Ta to the national total, estimated deductions being
made in respect of consumption of alcohol by the agricultural com-munity and by tourists.
in the estimation of the relationships, but no estimate can easily be made of the extent of this bias. In these cases, as there were only four points, it was found more convenient to carry out the trial-and-error process numerically; the quadratic term in the log-log regression was computed for a series of trial values of the threshold level, and a figure was obtained by interpolation which made the quadratic term zero.
For taxes on private motoring the equation obtained was
log Tm = -7-97 + 3-101 log (Y - 170) (4)
where T m represents the tax element in expenditure on private motoring. Because of the high value of the regression coefficient and the amount of extrapolation involved, this equation must be regarded as unreliable at the highest income levels.
In the case of rates, the figures used represent rates paid per owner occupied dwelling in each of the four income categories. When these are plotted against income on a double log scale the curvature is found to be concave upward instead of downward as in the other cases (income-elasticity of demand increasing instead of decreasing with increasing income). This shows that a straight line cannot be obtained by subtracting a positive threshhold line cannot be obtained by subtracting a positive threshold of the form
log (Tr-Tro) = a + b log Y
where Tr represents payment of rates in pounds per annum and Tro is a constant representing a " basic " level of rates which in theory would be paid at income zero. The numerical result obtained was
log (Tr - 7-6) = -4-71 + 2-202 log Y. (5)
Using equations (1) to (5), the required tax figures can be cal-culated at any specified income-level. The figures given in Appendix Table III refer in each case to the mid-point of the income-range involved except in the case of the open-ended ranges " under £240 " and " £1,501 and over " for which assumed mean levels of £180 and £2,500 respectively were used.
DISCUSSION
subject himself but he could not aspire to the quality of the re-search which Mr. Reason had put into his paper. If he had any fault to find it was in the reluctance of the reader to draw any conclusions. For example—it seemed quite clear that over 60 per cent, of the Revenue from direct taxation was obtained from about 12^- per cent, of the taxpayers, and it had always seemed anomalous that such a large machine as the Revenue machine in Taxation should work so hard among the great body of taxpayers for a comparatively low }deld in Tax from them. The conclusion could be drawn that Income Tax should be directed at a special class, say the Companies above a certain profit earning-capacity and the private incomes above £2,000 a year, and if it had done so the yield would still be over 60 per cent, of the present yield, while administration would be cut to an insignificant item. Those who escape the Tax by being below the Income Tax figure could have a simple direct Tax such as a salary or wage tax without any allow-ances or reliefs or other complications in order to recoup the Tax lost to the Revenue.
Mr. Charleton felt that it was time the Statistical Society had a small school for fiscal study which would follow up the reports of the Commission on Taxation and a number of excellent books recently published in Britain and America on the subject. This might lead to a more empirical approach to the subject, but we were a small country which should not be hidebound by tax tradi-tion, and we could afford to experiment in the fiscal territories.
Concluding, Mr. Charleton said he felt he was not competent to deal with indirect taxation, but was struck by the fact that so large a part of the revenue depended on smoking, drinking, car driving and entertainments. Anyone who did not indulge in these recreations was something less than a patriot and might very well be loaded on to an emigrant ship and put out of the country. The question was where he would go, bearing in mind that the majority of modern countries had very similar taxation systems, and equally relied for revenue on the recreations of the taxpayers. Perhaps the answer was to shoot the recalcitrants into orbit and leave them circulating the globe.
Dt. R. C. Geary : Mr. Reason (with whom he would wish me to
associate Mr. O'Carroll) is to be congratulated on his excellent pioneering effort; presented with commendable modesty and frank-ness. Not only a first step but positively a stride has been made in the right direction. Statistics of income distribution are of great importance and it is high time that we took them seriously. After all, the end product of economic effort is to better the lot of poorer people and to do this it is necessary to know their circum-stances. And we want to know all about the large incomes so that they may be efficiently taxed. In his first paragraph Mr. Reason refers to equity. There is more to the taxation problem than this. A fundamental question is : can the taxation system of this country be improved so that it will create incentives or lessen disincentives to economic development?
well aware of the shortcomings of his paper. It is, of course, dis-appointing that he did not have a shot at the income distribution of farmers and also at the redistribution by way of subsidies to the lower income groups. It is true 1hat the unit in the Farm Survey is the household and not the individual earner, but one would have thought that it could be assumed that in each farm household there was an equal distribution of income amongst all working family members. This would be a fiction of course but the resulting statistics would be quite useful provided we bear in mind this basic assumption. In addition to the Farm Survey there is almost
i\ unique wealth of statistical information available from the
censuses of population in regard to distribution by farm size and by valuation which would help in making income distributions. In any case income distribution for household units is if anything more important than distribution by individual earners especially in a country like Ireland where families arc so strong and cohesive. 1 know that Mr. Reason and Mr. O'Carroll Avill not take these and my following remarks as carping criticisms. I well know how much work would be entailed in making extensions in these directions to their valuable study. Perhaps indeed knowing my present affiliation they might say as politely as may be "Go do it yourself ". And indeed I might.
Now as to some specific points. I am not quite clear, from the reference in the introduction, as to the scope of the 1950/51 Census of Incomes compiled by the Revenue Commissioners. Was this an inquiry extended to persons who had incomes above the absolute minimum of liability for single persons (£240?)? If the .Revenue Commissioners had conducted such a census, with appro-priate cross-heads in regard to dependency, sources of income and tax levied in the different schedules, it would appear to be unneces-sary to have recourse to the four methods specified. Mathematical methods could then be confined to smoothing, to regrading and to extrapolation. 1 have noted, of course, that the census refers to the year 1950/51 whereas Mr. Reason's year was 1954. If the kind of information I have specified were available from the census there would be little difficulty in projecting the data to four or five years forward. I suppose there is the perfectly simple answer to this query namely that the census didn't go far enough. If it didn't, then I think that it should be made do so in future. In fact, apart from the essential importance of these statistics for everyone interested in the economic and social progress of the country, a comprehensive census of incomes on the lines 1 have indicated, in which the sources of income of each earning unit were drawn together, conducted by the Revenue Commissioners at intervals of say five years, would bring to light, I am convinced, a substantial yield of tax which now manages to slip through the revenue net. A comprehensive census of incomes, even if for prudent reasons it were to extend only to the non-agricultural community, would yield handsome dividends in many ways.
and income distribution aggregates. 1 mean I would like to know his grounds for this surmise.
The second table disproves the popular assumption, based on skilled wage rates, that the level of earnings in non-agriculture in Ireland are on a par with those in Britain. As the table shows, the Irish average is much lower.
The discrepancy between the £11 millions income tax and sur-tax with a total exchequer receipt of £25 million has obviously given Mr. Reason some trouble. May I ask his grounds for the figures given.
I have a mild growl about the opening paragraphs in Section III. Mr. Reason need not worry about " all the imperfections of a first attempt " for as I said at the beginning 1 regard his attempt as excellent. What I complain about is his statement that the statistical data are very limited. This is certainly not the case. There is a wealth of material in the Household Budget Survey, the Farm Survey and the Census of Population, and elsewhere, of reasonably recent date. What is lacking is, in my opinion, not data but resources for working on these data. I would also express the wish that the rates element in rents should be estimated based perhaps on the remarkable statistics of rents available from the 1946 census of population. 1 believe I am right in thinking that a similar inquiry will be made in the 1961 census, but the results will naturally not be available for some time. Of course, it is true that these figures would haA^c little significance without taking into account at the same time the element of subsidy in local authority housing. The problems should be tackled together.
I would like to have some information as to how Mr. Reason derived the second set of estimates for taxes on expenditure of certain items.
With regard to Table I it is surely a pity that the lowest bracket of the range should contain so large a proportion as two-fifths of persons and one-fifth of income and that the largest bracket should contain as much as one seventh of income. Could these classes not be split up0? The highest income range is specially interesting for the fact that so much tax has to come out of it. It is disquieting that two-fifths of non-agricultural earners should have less than £5 a week. No doubt private domestic servants and young persons account for much of the large total. At the 1951 census there were about 100,000 (other than private domestic servants and agriculturalists) gainfully occupied in the 14—19 age group.
Perhaps the most interesting feature of the appendix is the derivation of the incidence curve for tax on expenditure on alcoholic beverages. As stated in the paper the expenditure returned at the household budget inquiry was far too small—an invariable feature of these inquiries everywhere. Why are people secretive about their consumption of alcohol and not ashamed of their expenditure on tobacco, which they apparently own up to in full? Anyway, at the HBI weekly expenditure in 1951/52 was returned as only 2/6 per household. Such expenditure would be quivalent to an annual estimate of only £2J million, only something like one-sixth of the drink bill of native non-agricul-turalists. While the HBI might accordingly seem to afford too slender a basis for estimates of the income-incidence of taxation, Mr. O'Carroll is sustained by a remarkable regularity through income groups and family sizes of the figures published in the HBI report. Of course he has to assume that degree of reluctance to tell the truth is constant amongst different income groups in this regard. The regularity of the series goes some distance in supporting him, if not all the way.
I have been sufficiently interested in the drink aspect to endeavour to set up a demand function for drink consumption during the years 1946/58, based on data kindly supplied to me at very short notice by the CSO. That the results do not bear out Mr. 0'Carroll's conclusions is not unexpected since we are con-fronted with the familiar difficulty of reconciling demand functions based on cross section (Mr. O'Carroll's) and time series (mine). I found an income elasticity of 0.4 and a price elasticity of —0.7. An income elasticity of 0.4 indicates a regressive tendency whereas Mr. 0'Carroll's analysis points to an income elasticity of much greater than unity, i.e. progressive. My demand curve (drink bill on total consumption, drink prices and time, all general-price deflated using logs) did not give too good a fit (R2 = 0.69) as was to be expected since drink consumption was very stable during 1946—58. Still I cannot help thinking that Mr. 0'Carroll's analysis exaggerates the progressive tendency.
Replying to the discussion Mr. Reason said that there were a number of points made by Dr. Geary on which he would like to comment. The question of including agricultural incomes was considered and some of the reasons for excluding such incomes are mentioned in the paper. There is the further consideration that the national farm survey figures which are of critical import-ance in this context cannot be regarded as representative. The elimination of the bias in the figures would require an expenditure of time and effort which seemed to be prohibitive.
As regards Dr. Geary's comments about the possibility of using existing statistical data for the purpose of allocating by income ranges benefits paid by public authorities I hope I do not seem presumptuous in continuing to feel some doubts about the poten-tialities of this material. In any event, as Dr. Geary said, lack of resources for working on the data is an overriding consideration.
The 1950-51 Census of Incomes compiled by the Revenue Com-missioners covered all persons effectively liable to Income Tax (i.e. those whose incomes were high enough to make them liable to tax after the various allowances 'and reliefs had been granted) and only some of those persons whose incomes were above the effective exemption limit but who were exempt because of the operation of allowances, etc. The Census did not, therefore, go far enough for my purposes and this explains the need for adopting the four methods specified for estimating non-'agricultural incomes.
The figure of £15m. mentioned might perhaps be described as an intelligent guess. It was arrived at after careful consideration of the data available from national income and balance of payments sources.
Dr. Geary asked the grounds for the figures for the remainder of income tax and sur-tax not covered by the distribution for these taxes. The figure for tax on companies' undistributed profits is derived from National Income and Expenditure, 1959 (Pr. 5717). The figure for tax on unearned incomes is derived from a pro-jection based on the 1950-51 Census of Incomes. The figure of £l-4m. is a residual.
Drink Tobacco Private Motor
Vehicles Entertainments
0/
/o
.—.
30 —
Working Population
Agriculture
0/
/o 30 30
25 30
Non-agriculture
/o
55 45
35 55
Other (in-cluding
ex-persons with incomes not at work)
/o
15 25
10 15