Exchanges No. 20
Decadal Variability and Predictability
Part 2: Monsoons and Pacific Sector
Weakening of the ENSO Monsoon Rainfall Relationship
-Possible Role of the Atlantic Circulation ?
Volume 6 No. 2
June 2001
[image:1.595.47.553.34.632.2]Exchanges
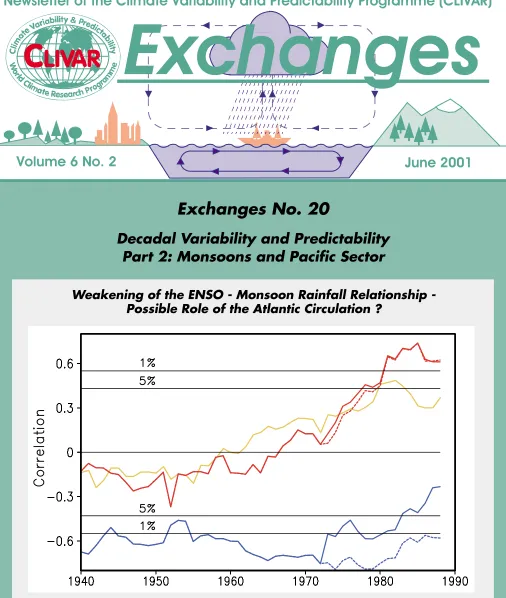
Figure 1 from paper ‘Possible Roles of Atlantic Circulations on the Weakening Indian Monsoon Rainfall -ENSO Relationship’ by C. P. Chang et al.:Correlation (based on a 21-year sliding window) between Indian summer monsoon rainfall and summer NINO3 SST (blue solid), winter western European SAT (red solid), and winter central Eurasian SAT (yellow). Dashed lines are the result of removing 1983 and 1997. The 1% and 5% significance levels are indicated as horizontal lines.
The paper appears on page 5.
Editorial
Dear CLIVAR community,
For many Europeans and North Americans ‘Mon-soon’ and Pacific may sound very exotic and far away. But in fact more than half of the world’s population is strongly influenced by monsoonal rainfall and a large number of them live around the world largest ocean basin, the Pa-cific. Thus, an important fraction of the CLIVAR pro-gramme deals with phenomena related to these two key words. Two Principal Research Areas: Variability of the Asian-Australian Monsoon System and Variability of the American Monsoon Systems deal with the two largest monsoon systems of the world. Better understanding of the range of variability of these climate phenomena lead-ing to improved climate predictions is one of the major goals associated with these CLIVAR projects.
In addition, the variability of the monsoon systems interacts strongly with the ENSO phenomenon, the most dominant and prominent mode of climate variability within the Pacific as well as on global scales. Thus, the climate variations in the Pacific sector play a key role for global climate variability on interannual as well as on longer time-scales. We have seen considerable progress in understand-ing and predictunderstand-ing ENSO for the benefit of the adjacent nations within the Pacific. The WCRP Tropical Ocean Glo-bal Atmosphere (TOGA) project established a firm foun-dation of observations and modelling and CLIVAR con-tinues to build on its success with a focus on “Extending and Improving ENSO predictions”. Ocean observations and coupled modelling are key tools to improve on the accomplishments made through TOGA. With respect to the role of the oceans in the global climate ocean, the World Ocean Circulation Experiment (WOCE) has delivered tre-mendous new insights into the oceans’ mean structure and circulation and has stimulated a steady improvement of our modelling capabilities. Especially, when dealing with long-term climate fluctuations and anthropogenic change, the long memory of the ocean is crucial. Amongst others, this has let to the second CLIVAR focus within the Pacific to investigate the decadal variations within this region.
Although the last years have already shown consid-erable progress in our understanding of these climate phe-nomena and mechanisms, considerable gaps still exist in our observational database as well as in our modelling ca-pabilities and naturally in our understanding of all these phenomena.
Several decadal workshops in the past year have amply demonstrated the accomplishments of the past years. In February addition an international Pacific imple-mentation workshop (see article beginning on page 29), started the process of refining the CLIVAR Initial Imple-mentation Plan published in 1998 and of co-ordinating and enhancing national contributions to the research in this area.
As a consequence, CLIVAR Exchanges has dedicated two issues related especially to problems to long-term cli-mate variability. The first one in January of this year fo-cused primarily on global issues and on the Atlantic sec-tor. This one now emphases monsoons and the Pacific. We hope that we can present you a very interesting mix of papers, different views and opinions that should stimu-late scientific discussions.
As a result of an article in the last issue, we are pub-lishing here some correspondence relating to it. We en-courage this type of contribution, since Exchanges is not a peer-reviewed journal, thus, some scientific discussion on recent results is natural, necessary and documents the vi-tality of CLIVAR research.
We have more good news to report. Firstly, CLIVAR was very well received during the annual review of the components of the World Climate Research Programme, the meeting of the WCRP Joint Scientific Committee. Many of you contributed to the presentation, with new interest-ing scientific results and eye-catchinterest-ing figures. Secondly, the ICPO is in the process of recruiting new staff members who will join the office in summer. The first will start in June, Dr. Yan Zhongwei got his PhD in Atmospheric Physics from Beijing in 1989 on “Northern hemisphere climatic jump in the 1960s”. From 1999-2000 worked with P. Jones and T. Davies at University of East Anglia on climate extremes in Europe and China and most recently he was at University College London working on climate extremes. Zhongwei will take responsibility in the ICPO for the work of the Asia-Australia Monsoon panel under the new leadership of Julia Slingo and Peter Webster, for CLIVAR research in Africa and for all issues relating to climate indices and extremes
You will find also a report of the May meeting of the CLIVAR Scientific Steering Group held in Toulouse. This meeting (the tenth) demonstrated clear progress towards CLIVAR implementation in all science and geographical areas but also highlighted the enormous challenge of in-ternational co-ordination of such a diverse project. An es-sential tool in this will be SPRINT - a Searchable PRogramme InformaTion database on the CLIVAR web site. The structure is now in place but its contents are as yet sparse. A major challenge in the coming months will be to fill SPRINT with detailed information on national plans and on CLIVAR-relevant data sets and products.
Finally, with this issue we are mailing copies of the WMO annual Climate Review. We hope you will find it interesting that you all enjoy this issue of Exchanges high-lighting the progress on decadal variability with the Indo-Pacific region. Note, that a call for papers for the next two issues can be found on page 14.
Antonio J. Busalacchi
Earth System Science Interdisciplinary Center (ESSIC) College Park, MD, USA
[email protected] Jürgen Willebrand
Institut für Meereskunde, Kiel, Germany [email protected]
Co- Chairman CLIVAR SSG
The Laboratoire d’Etudes en Geophysique et Oceanographie Spatiales (LEGOS) in Toulouse, France, provided a stimulating environment for the tenth session of the CLIVAR SSG which took place 15-18 May 2001. Our host, Dr. Christian LeProvost, organized several briefings on the French Mercator ocean forecasting and data assimi-lation system. This approach to routine oceanographic nowcasting is a very important contribution to the CLI-VAR research agenda as it pertains to the evolving state of the world ocean as well as seasonal climate prediction.
Internationally, the implementation of CLIVAR is well underway. Implementation is proceeding via a com-bination of regional climate and monsoon initiatives fo-cused on the Americas, the Asian-Australian monsoon sys-tem, and African climate and through initiatives organized around problems specific to the Pacific, Atlantic and South-ern Ocean basins and adjacent regions. The global perspec-tive for CLIVAR is provided by the CLIVAR Ocean Obser-vations Panel, the Working Group for Seasonal to Interannual Prediction, and the Working Group for Cou-pled Modelling (WGCM). The major links between natu-ral variability and anthropogenic climate change within CLIVAR continue to occur among the WGCM, the Work-ing Group on Climate Change Detection (jointly sponsored with the WMO Commission on Climatology) and collabo-ration with IGBP/PAGES on past climate.
This past year the 52nd Session of Executive Council of the World Meteorological Organization as well as the Joint Scientific Committee of the WCRP both indicated that they were very impressed and pleased with the progress of CLIVAR to date. In particular, the WMO Executive Coun-cil was encouraged with the steps taken towards imple-mentation of a number of specific regional activities, namely: VAMOS, the Asian-Australian monsoon system, and African climate variability. Bearing in mind the con-siderable potential for socio-economic benefits of progress in these activities, the Council urged all members in the regions concerned to participate. Other specific support-ive comments included the importance of PIRATA in CLI-VAR studies.
Although much of CLIVAR implementation is be-ing organized regionally, the SSG reconfirmed the impor-tance of the global integration of the programme by devot-ing the first day of its meetdevot-ing to issues of global
impor-tance. This included a presentation by Chet Koblinsky on efforts by the CLIVAR Ocean Observations Panel to com-plement and integrate across the existing basin panels, to see that sustained and near-sustained observations in both the upper layers and deep ocean needed to support CLI-VAR research are implemented, and to identify require-ments for increased emphasis on ocean assimilation and surface fluxes.
On the second day of the SSG, regional and basin implementation progress and issues were discussed. High-lights include workshops and implementation plans for the Pacific and Southern Oceans, a workshop on decadal vari-ability and predictvari-ability, the initiation of CLIVAR activi-ties in Africa, and a Chapman Conference on the North Atlantic Oscillation.
Bob Weller reported on a very productive Pacific im-plementation planning workshop. Among the topics dis-cussed were the recent commitments to repeats of key WOCE sections, the operational status of TAO/Triton ob-servations and the use of these data in predictive models, and a number of regional Pacific process studies in the plan-ning phase.
Martin Visbeck, the new chair of the Atlantic Panel, reported on the very successful NAO Chapman Confer-ence in Ourense, Spain and subsequent panel meeting. Highlights include the rapid development of Argo deployments in the North Atlantic, funding of a major UK initiative on Atlantic Thermohaline Circulation and Abrupt Climate Change, continuation of the PIRATA array into an extended phase, and coordination with the ACSYS/CLIC initiative for an Arctic-Subarctic Flux Array for the moni-toring of freshwater inflow.
Doug Martinson next presented implementation progress from the Southern Ocean stemming from a work-shop held in Perth, Australia, in November, 2000. High-lights include commitments made to repeat sections across the Drake Passage and from Tasmania to Antarctica. Chal-lenges for the region include the need for better understand-ing of changes in the character of the Antarctic Circumpolar Wave and links to temperate latitudes, Argo resourcing and deployments, repeat hydrography in the Pacific sector, and improved air-sea fluxes.
With respect to monsoon and regional climate ac-tivities, CLIVAR continues to benefit from Roberto Mechoso’s leadership on behalf of VAMOS. Earlier this year, the 4th meeting of the VAMOS Panel was held in Mon-tevideo, Uruguay (see page 32 for a summary). New VA-MOS initiatives include a joint CLIVAR-VAVA-MOS/GEWEX study of the South American monsoon within the La Plata River Basin (PLATIN). A preliminary science and imple-mentation plan for a North American Monsoon Experiment
(NAME) has been drafted. Other VAMOS developments include a field campaign planned for South America in 2002/03 to study the American Low Level Jets (ALLS), and the extended study of the low-level cloud region in the eastern tropical/subtropical Pacific (VEPIC). Much of this progress was reported in a recent special issue of Exchanges devoted to VAMOS.
In 2001, the SSG welcomes Peter Webster and Julia Slingo as new co-chairs of the Asian-Australian Monsoon Panel and in so doing thanks the outgoing chairs Stuart Godfrey and Bill Lau for their years of service and leader-ship of the panel. Research areas of interest to the panel include changes in the ENSO-monsoon relationship, the importance of intraseasonal variability, and the zonal SST mode in the Indian Ocean. Among the challenges for the panel is the need to develop an integrated approach im-plementation of CLIVAR requirements in the Indian Ocean.
One of the more noteworthy developments of the past year has been the formation of the CLIVAR Variabil-ity of the African System (VACS) Panel. Chris Thorncroft, co-chair, with Laban Ogallo, of VACS, reported on the first meeting held in Nairobi, Kenya in January, 2001. VACS im-plementation is being developed around three key ques-tions:
•
What causes African climate variability (AVC) and how is this related to other parts of the globe?•
How well do current dynamical models simulate this variability and relationship?•
What are the deficiencies in the models that account for inadequacies in simulating ACV locally and in a global context?This past year saw the Working Group on Climate Change Detection (WGCCD) host workshops in Africa and the Caribbean (see page 34) for the purpose of producing indices of climate change using daily meteorological data. In addition, as a result of the WGCCD efforts, an inven-tory of daily meteorological time series was produced for 30 African countries. Standard software was provided for quality control and calculation of indices for use in the workshops and for wider distribution. Approximately 40 scientists from the meteorological services in these two re-gions gained experience with data quality and homogene-ity checks, and the calculation and analysis of climate in-dices. As a result of these workshops the concept of free exchange of “elaborated” (i.e., indices), rather than “raw” data, to promote the creation of global data sets for use in climate studies, was realized.
Much of the discussion of the CLIVAR activities on seasonal to interannual prediction revolved around the importance of developing a synergy between the CLIVAR basin and monsoon panels’ plans for observations and process studies and the activities of the Working Group on Seasonal to Interannual Prediction (WGSIP). As discussed by Steve Zebiak, the WGSIP has been involved in evaluat-ing ensemble prediction methods, continued diagnostics
of intraseasonal variability, development of standards for model simulation and prediction outputs, and means by which other components of CLIVAR could take advantage of the numerical experiments undertaken by WGSIP.
A special session at this year’s SSG was devoted to the application and applicability of CLIVAR science. Tim Palmer organized a series of presentations representative of applied climate research and actual climate applications being performed at ECMWF, the IRI, and the University of East Anglia. As a result of the ensuing discussion, over the next year the various CLIVAR working groups and panels will be identifying potential applications and partnerships emerging out of the basic research agenda and accomplish-ments within CLIVAR.
The SSG was pleased to note the initiation and strengthening of a number of CLIVAR and CLIVAR rel-evant initiatives including, but not exclusively, the afore-mentioned UK study of rapid climate change, continua-tion and initiacontinua-tion of a large number of European Union-sponsored projects, and the formation of a US CLIVAR Project Office. A particular area of focus for CLIVAR this past year was increased communication across the breadth of the program. Major strides were made as a direct result of the dedication of the scientific officers within the ICPO who have worked closely with each CLIVAR panel and chairperson. For example, the ICPO recently brought on Carlos Ereño to assist with CLIVAR implementation in South America.
In summary, CLIVAR implementation is making progress on a number of fronts. The CLIVAR research agenda as it pertains to observations, modelling, and proc-ess studies is moving forward at a healthy pace. That is not to say the program is without important challenges, among which include the need for continued dedicated resources at the national levels, issues pertaining to air-sea fluxes, data management, Northern Hemispheric bias to observations, WOCE-CLIVAR transition, coordination across the modelling components of the programme, con-tinued interactions with GEWEX and CEOP, and the need to bring closer the natural variability and anthropogenic change portions of CLIVAR.
C.-P. Chang, Patrick Harr and Jianhua Ju Department of Meteorology
Naval Postgraduate School Monterey, CA 93943, USA [email protected]
This is a summary of a paper to appear in J. Climate. The negative correlation between Indian Monsoon Rain-fall (IMR) and ENSO, presumably through an anomalous Walker cell driven by tropical East Pacific sea-surface tem-perature (SST) anomalies, has weakened rapidly since the late 1970s (Kumar et al., 1999, or K99). This weakened rela-tionship is defined by the correlation between June-Sep-tember All-India rainfall and NINO3 (5oS-5oN, and 150o W-90oW) SST. This correlation (reproduced from K99 in Fig. 1 (page 1), and truncated at left) has been consistently around the 1% significance level from 1856 until the 1970s. Webster and Palmer (1997) related this interruption of the ENSO-monsoon relationship to the chaotic nature of the ENSO-monsoon, while K99 viewed the rapid weakening of the correlation as systematic and proposed that it may be due to changes in the Pacific Walker circulation and the warming of the Eurasian Continent. These issues are addressed in this pa-per using the 1949-98 data of SST, surface air tempa-perature (SAT), and wind, and velocity potential fields of the NCEP/ NCAR Reanalysis. Also, the Department of Energy SAT data are used for the period 1856 - 1990.
Although the Walker cell during recent (1978-98) El Niño events moved southeastward with its downward branch moved away from the Indian Ocean to the mari-time continent/Australia, the composite warm- and cold-event differences before and after 1977/78 have very simi-lar patterns. This is because the cold-event Walker cell was shifted northwestward from 1950-77 to 1978-98, moving its upward branch closer to India. The shifts in both warm and cold events are consistent with the increase of the decadal-mean tropical East Pacific SST in the late 1970s (Trenberth and Hurrell, 1994), which results in no shift of
the within-period anomalous circulation. Therefore, the interdecadal change of the Walker cells is unlikely to play an important role on the weakening ENSO-monsoon rela-tionship.
Since it is expected that the monsoon rainfall will be decreased by El Niño and increased by warm winter-spring Eurasian surface temperature, the generally warmer Eura-sian surface in recent decades may give rise to a wetter monsoon even in the presence of an El Niño. This was in-deed observed in the composite of El Niño events during 1981-97 by K99, who argued that the effect of Eurasian sur-face temperature has dominated that of ENSO during re-cent decades. However, this implies that during cold events the ENSO effect should be stronger. Alternatively, relatively (within 1978-97) cold Eurasian winters should exert a weaker influence. Thus, there should not be a significant net change of ENSO-IMR correlation within the period of 1978-98.
For 1950-77, the correlation between IMR and the preceding winter Eurasian SATs (Fig. 2a, page 17) is weak over the entire domain. But during 1978-98 (Fig. 2b) sig-nificant positive correlation occurs over a large area of western Eurasia with the maximum centred near 50o N-60oN, 0o-20oE, which shall be called western Europe (wE). This is consistent with the results of Bamzai and Shukla’s (1999), who were surprised to find that the only significant inverse correlation between the 1973-94 winter snow cover and the subsequent Indian summer monsoon rainfall oc-curred over western Europe. For the 1950-77 spring, the correlation (Fig. 2c) continues to be very weak over the midlatitudes, but positive correlations over localized sub-tropical areas around northern India and the Himalayas seem to support the hypothesis that snow cover over Tibet and the Himalayas influence the monsoon strength. How-ever, for the 1978-98 spring (Fig. 2d) the correlation in this area is weak or even negative, so the Himalayan/Tibetan relationship disappears. On the other hand, the IMR-SAT correlation during the 1978-98 spring over most of midlatitude Eurasia remains weakly positive. The overall pattern suggests a possible continent-scale meridional thermal contrast effect (across about 30oN) on the ensuing monsoon.
Fig. 3: The 500 hPa streamfunction difference between summer Indian monsoon wet years and dry years for (a) 1950-1977 and (b) 1978-1998 (contour interval 1x10⁶ m2 s-1). Negative values are shaded. The wet and
dry years were identified by monsoon rainfall anoma-lies exceeding one standard deviation.
[image:5.595.39.357.602.795.2]The correlation between winter wE SAT and the sub-sequent IMR had been small until the most recent decades when it became significantly positive for the first time in more than a century (Fig. 1, page 1). This drastic change occurs around the time of the weakening of the monsoon-ENSO relationship. The composite preceding winter 500 hPa streamfunction differences between wet and dry mon-soons during 1950-77 (Fig. 3a, page 4) exhibit an organized Pacific-North America (PNA) teleconnection pattern, which is indicative of the strong relationship with ENSO. During 1978-98 (Fig. 3b), the PNA pattern is nearly absent over North America, and the most organized pattern is an anomalous North Atlantic westerly jet stream that extends from northeast North America to northwest Eurasia dur-ing the winters preceddur-ing a wet Indian monsoon. There-fore, during these winters the jet stream is shifted to a more northerly location, which gives rise to an anomalously warm midlatitude Eurasia with less storm activity (there-fore less snow cover or higher SAT). This would be a favorable condition for a subsequent wet Indian monsoon. Since the largest variation of the storm track is located in western Europe, the strongest signal of the winter SAT-IMR correlation during 1978-98 should occur there, rather than closer to South Asia.
There is a large difference in the influence of the wE winter SAT signals between the two decadal periods. The signals are confined to western Europe during 1950-77 (Fig. 4a, page 17) but extend across most of Eurasia during 1978-98 (Fig. 4c). Furthermore, during 1950-77 the signals de-creased rapidly during spring (Fig. 4b), but during 1978-98 they persisted into spring across a large region of Eura-sia (Fig. 4d). These results support the interpretation that in 1978-98 western Europe is the „gateway“ for winter storm anomalies that affect the spring Eurasian SAT and the subsequent monsoon. The trend of the Eurasia-induced thermal contrast effect on the IMR may be seen from the 21-year sliding correlation between the IMR and the pre-ceding winter SAT averaged over the central Eurasia area 40oN-70oN, 50oE-95oE. This correlation (Fig. 1) and the very similar correlation for spring (not shown) also become in-creasingly positive in recent decades. However, the corre-lation remains below the 5% level, apparently because the strong winter wE signal has spread over the much larger central Eurasian region. This result also indicates that the Eurasian meridional thermal contrast effect on the mon-soon rainfall emerges only during recent decades.
The difference between winter mean 500 hPa streamfunction during 1978-98 and during 1950-77 reveals two wave patterns (Fig. 4e, page 17). A long wave is found over northern latitudes with trough axes over the Atlantic and near 60oE, and a short-wave teleconnection pattern exists across northern Africa and southern Asia. Therefore, westerlies across the North Atlantic turn northeastward to-wards western Europe, which is a noted feature of the posi-tive phase of the North Atlantic Oscillation (NAO) (Hurrell, 1995), a regional manifestation of the Arctic Oscillation (AO) (Thompson and Wallace, 1998). The positive phase
has been unusually dominant over recent decades. The short-wave teleconnection exhibits a down-shear tilt so that its momentum transport favors the strengthened mean westerlies to the north. This is consistent with an anoma-lous storm track and the eastward extension of correlation between IMR and wE winter SAT during 1978-98. The vari-ation of the anomalous 500 hPa streamfunction gradient in northern Eurasia may also explain the weakening of the wE signal between 40oE-60oE and the increase farther east (Figs 4c-d) as due to changes of the baroclinic conditions for storm development.
We have shown that the weakening of the ENSO-IMR relationship may be due to the strengthening positive phase of NAO/AO and associated jet stream/storm track patterns over the North Atlantic and northern Eurasia dur-ing recent decades. It may be noted that this weakendur-ing is mostly due to the summer warm events of 1983 and, to a lesser extent, 1997 (1997 contributes only to the last two data points in Fig. 1). For both years, the influence of a warm Eurasian surface opposes the effect of a warm ENSO event, with 1983 having the highest positive NAO index in the twentieth century. If these two years are removed (Fig. 1), the ENSO correlation for the recent decades will return to the high (1%) level. However, there is little influ-ence on the correlation of the winter wE SAT with the mon-soon rainfall. Thus, the effects of circulation changes over the North Atlantic in the recent decades are robust and the disruption of the ENSO-IMR relationship is probably not accidental.
Acknowledgements
This work was supported by NOAA Office of Global Pro-grams under Contract NA01AANRG0011. We wish to thank Mike Wallace, Neville Nicholls and Tim Li for valu-able discussions.
References
Bamzai, A., and J. Shukla, 1999: Relation between Eurasian snow cover, snow depth, and the Indian summer monsoon: An observational study. J. Climate, 12, 3117-3132.
Hurrell, J.W., 1995: Decadal trends in the North Atlantic Oscilla-tion: Regional temperatures and precipitation. Science, 269, 676-679.
Kumar, K.K., B. Rajagopalan, and M.A. Cane, 1999: On the weak-ening relationship between the Indian monsoon and ENSO. Science, 284, 2156-2159.
Thompson, D.W., and J.M. Wallace, 1998: The Arctic oscillation signature in the wintertime geopotential height and tem-perature fields. Geophys. Res. Lett., 25, 1297-1300.
Trenberth, K.E., and J.W. Hurrell, 1994: Decadal atmosphere-ocean variations in the Pacific. Climate Dynamics, 9, 303-309. Webster, P.J., and T.N. Palmer, 1997: The past and the future of El
Ronghui Huang
Institute of Atmospheric Physics
Chinese Academy of Sciences, Beijing 100080, China [email protected]
1. Introduction
East Asia is a region of strong monsoons with rain-fall mainly concentrated in the summer season. As in other monsoon regions , the decadal variation of climate in East Asia is also significant (see Huang and Wang, 1996). In or-der to explain the decadal variability of the summer mon-soon rainfall in East Asia and its possible causes, a data set of the daily precipitation and temperature at 160 stations in China for 50 years from 1950-1999 and NCEP/NCAR reanalysis data are used to look at the characteristics of the decadal variation of climate in East Asia and its associa-tion with the SST anomalies in the tropical Pacific.
2. Decadal Variability of Summer Monsoon Rainfall in East Asia
The decadal fluctuation of summer (June-August) monsoon rainfall is more obvious than the decadal varia-tion of surface temperature in East Asia. From the decadal-mean anomaly distributions of summer precipitation in the 1950s, the 1960s, the 1970s, the 1980s and the 1990s (1991-1999), it can be found that the anomaly distributions of summer monsoon rainfall in the periods of the 1980s and the 1990s were obviously different from that in the 1970’s in East Asia. Compared with that in the 1970s, the summer monsoon rainfall obviously increased in the Yangtze River valley, but opposite phenomena appeared in North China and the Yellow River valley, and prolonged severe droughts occurred in North China during the periods from the 1980s to the 1990s.
The decadal variation of summer monsoon rainfall may be seen from the interannual variations of summer precipitation in various region of China. The analysed re-sults show that the interannual variations of summer pre-cipitation in North China, the Yangtze River valley and South China before 1976 were very different from those after the late 1970s. Thus, the differences between the sum-mer precipitation anomalies (percentage) averaged for 1977-1999 and those averaged for 1967-1976 at 160 stations in China are analysed (see Figure 1a). As shown in Fig.1(a), there are large differences between the summer precipita-tion anomalies averaged for 1977-1999 and those averaged for 1967-1976 in North China and the Yangtze River valley. From 1977 to 1999, the summer precipitation decreased continuously in North China and severe droughts occurred frequently in this region, but in the Yangtze River valley, the summer precipitation increased obviously and serious floods were frequently caused there.
3. Decadal Variation of SST Anomalies in the Tropical Pacific and Its Impact on the Summer Monsoon Rain-fall in East Asia
[image:7.595.35.399.567.793.2]In order to investigate the cause of the decadal vari-ability of summer precipitation in East Asia, the ten-year running mean SST anomalies in the tropical Pacific and its impact on the summer monsoon rainfall in East Asia are analysed. The analysed result shows that the SST anoma-lies appeared an obvious decadal variability in the equato-rial central and eastern Pacific. The equatoequato-rial central and eastern Pacific was cooling in the 1970s and warming re-markably in the 1980s and the 1990s. Thus, the difference between the SST anomalies averaged for 1977-1999 and those averaged for 1967-1976 in the Pacific is also analysed (see Figure 1b). As shown in Fig.1b, an obvious El Niño-like SST anomaly pattern appeared in the tropical central
and eastern Pacific from 1977 to 1999. This may explain that the “decadal El Niño event” appeared to occur from 1977 to 1999, while the “decadal La Niña event” occurred in the period of 1967-1976. Therefore, there may be a “decadal El Niño-like cycle” in the decadal variability of SST anomalies in the tropical Pacific.
Huang and Wu’s (1989) investigation on the interannual variations of summer monsoon rainfall in East Asia showed that when the equatorial central and eastern Pacific is in a warming episode, the summer monsoon rain-fall is strong in the Yangtze River valley, but it is weak in North China, Thus, droughts used to occur in North China, but floods frequently appear in the Yangtze River valley in the warm episode of the equatorial central and eastern Pacific.
The above-mentioned analyses show that the decadal variability of summer monsoon rainfall may be closely association with the decadal variation of SST anomalies in the tropical Pacific.
4. Decadal Variability of Water Vapour Transport in East Asia
The influence of SST anomalies in the tropical Pa-cific on the decadal variability of summer monsoon rain-fall may be clearly seen from the anomaly distributions of water vapour transport flux. The anomaly distribution of water vapour transport flux calculated by using the NCEP/ NCAR reanalysis data show that in the period of 1967-1976, the trade wind along the equator was strong, the cross-equatorial flow over the Indo-China Peninsula was strong and the southwest monsoon flow was also strong in East Asia. Therefore, a large amount of water vapour were trans-ported into North China from the tropical western Pacific, the South China Sea and the Bay of Bengal.
However, in the period of 1977-1999, the trade wind became weak, and the westerly wind anomalies appeared along equator, the cross-equatorial flow over the
Indo-China Penusula was weak, and the southwest monsoon flow was also weak and the northerly wind anomalies ap-peared in East Asia. Therefore, a large amount of water vapour was transported into the Yangtze River valley, but the water vapour transport by Asian monsoon flow became weak in North China. This caused the remarkable decrease of summer precipitation in North China and the increase of summer precipitation in the Yangtze River valley from the late 1970s to the 1990s.
5. Conclusions
The results presented in this paper show that the decadal variability of summer monsoon rainfall is very obvious in East Asia. This decadal variability may be closely association with the decadal variability of SST anomalies in the tropical Pacific. The result analysed by using the observed SST data shows that the decadal El Niño-like pat-tern of SST anomalies occurred in the tropical central and eastern Pacific from the late 1970s to the late 1990s. This decadal ENSO-like cycle had a large impact on the decadal variability of summer monsoon rainfall in Est Asia through the water vapour transport by Asian monsoon flow.
Acknowledgement
The author is thankful to Drs. V. Mehta and J. Comcowich for providing me this good opportunity to present this paper in the NASA/IPRC Workshop on Decadal Climate Variability held in Honolulu in January 8-12, 2001. This work was supported by the National Key Program for Developing Basic Research in China-G1998040900.
References
Huang, R.H., and Y.F. Wu, 1989: The influence of ENSO on the summer climate change in China and its mechanism. Adv.
Atmos. Sci., 6, 21-33.
Huang, R.H., and H.J. Wang, 1996: Observational facts and simu-lation of the climate and environment changes in East Asia due to the global warming. In: Global Environmental
Secu-rity, Eds. Y. Suzhki, K. Ueta and S. Mori, Springer Express,
[image:8.595.36.373.65.285.2]112-134.
R. H. Kripalani, Ashwini Kulkarni and S. S. Sabade Indian Institute of Tropical Meteorology
Pashan, Pune 411008, India [email protected]
Introduction
One of the objectives of the CLIVAR Project is to de-scribe and understand climate variability on decadal time-scales through the collection and analysis of observed in-strumental data.
Seasonal variation of rainfall is the most distinguish-ing feature of the monsoonal regions of the world. A major portion of the annual rainfall over most of the Asian do-main occurs during the summer monsoon period (June – September). The year-to-year variability in the monsoon rainfall occasionally leads to extreme situations of droughts and floods affecting the agricultural output and the national economy. Hence the variations in seasonal monsoon rain-fall may be considered a measure to examine climate vari-ability / change over the Asian monsoon domain.
Our recent studies have shown that monsoon rain-fall over South and Southeast Asia exhibits decadal vari-ability with certain epochs of above and below normal rain-fall. The epochs tend to last for about 3 decades. Further these studies have also revealed that the impact of El Niño (La Niña) is more severe during the below (above) normal epochs than the above (below) normal epochs. Thus the impact of ENSO events is modulated by the decadal vari-ability in monsoon rainfall (Kripalani and Kulkarni, 1997a; 1997b). This article examines the decadal monsoon rainfall variability over South and East Asia.
Data and Method of Analysis
i. Monthly station rainfall data for 120 stations over East Asia (China, Japan, Mongolia, Korea) has been extracted from numeric data package “The Global Historical Cli-matology Network” prepared by the Carbon Dioxide Information Analysis Center, Oak Ridge National Labo-ratory, USA. Recent data has been updated from “Monthly Climatic Data for the World” prepared by NOAA, USA in co-operation with WMO.
ii. Based on correlation analysis and Empirical Orthogonal Functions regional seasonal (June to September) time se-ries for coherent regions over north China (36o – 41o N, 109o – 124o E) and southern Japan (31o – 36o N, 130o – 141o E) are prepared for the 118-year period (1881-1998).
Since India constitutes a major portion of South Asia, monsoon rainfall for India has been downloaded from the website of the Indian Institute of Tropical Meteorology (http://www.tropmet.ernet.in/). A long homogeneous
summer monsoon rainfall series has been prepared for the period 1871-1999 for the country as one unit.
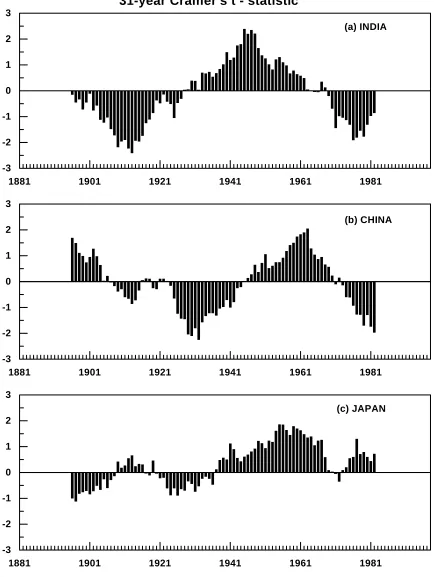
Rainfall series over India, China and Japan for the period 1881-1998 are subjected to statistical tests. Long term changes are examined with the Mann-Kendall rank statis-tic, while the short-term climate fluctuations have been studied by applying Cramer’s test for the running means (WMO, 1966). No significant long-term trends are detected. However, the Cramer’s statistic, which compares the means of the subperiods with the mean of the whole period, re-veals interesting results.
Results and Discussion
The Cramer’s statistic with varying window lengths (11-, 21-, 31-year) convey similar information, however with larger window lengths that patterns become smoother. Hence, the 31-year Cramer’s statistic for India, China and Japan are presented in Figure 1 (page 10). The most strik-ing features are the epochs of above and below normal rain-fall in each series.
The Indian series shows major turning points around 1895, 1930 and 1963 with the period 1895-1930 (1930-1963) depicting below (above) normal rainfall. China shows major turning points around 1906, 1945 and 1972 with the period 1906-1945 (1945-1972) depicting below (above) nor-mal rainfall. Chen et al. (1992) have noted that rainfall over north China has generally been decreasing since the 1950s especially in the 1980s and shows an apparent trend to-wards a more arid climate. Figure 1b shows these features.
The most interesting feature is that the turning points for China follow those of India about a decade later. This time-lag seesaw between India and China was suggested by Fu and Flether (1988). Monsoon rainfall over India has entered into an above normal epoch with a turning point around 1990 (Kripalani and Kulkarni, 1997b – this may be a possible reason that none of the El Niños after 1990 have had any adverse impact on Monsoon rainfall over India). Hence, one can speculate that Monsoon rainfall over China may enter / may have entered into an above normal ep-och around the year 2000. These cyclic oscillations appear to be a part of some natural variability, hence the trend towards arid climate speculated by Chen et al. (1992) over China may not be true. Generally the epochs tend to last for around three decades over India and China. For Japan the major turning point is around 1937 with the period before 1937 depicting subdued below normal epoch, while the period after 1937 depicts above normal rainfall activ-ity. Over Japan the epochs tend to last for about five dec-ades. More details on this study are available in Kripalani and Kulkarni (2001).
Though the reasons for this decadal variability are not clear, Chen et al.(1992) attribute the thermal contrast between the continent and the adjacent ocean to be the pri-mary factor for the decadal-scale variations of monsoon activity over China. During recent years it has become clear that there is a strong interdecadal variability in the ENSO cycle. Hence, the Pacific ocean’s influence on monsoon should vary interdecadally as well (Webster et al., 1998).
However, our analysis (Kripalani et al., 1997; Kripalani and Kulkarni, 1999) suggest that the decadal variability over India is more associated with events in the Northern Hemi-sphere mid-latitudes than over the tropical oceanic regions.
While the often-cited anthropogenic factors (global warming, deforestation, air pollution, etc.) may play some role in the regional extreme weather conditions, they are
1881 1901 1921 1941 1961 1981
-3 -2 -1 0 1 2 3
(c) JAPAN
1881 1901 1921 1941 1961 1981
-3 -2 -1 0 1 2 3
31-year Cramer's t - statistic
(b) CHINA
1881 1901 1921 1941 1961 1981
-3 -2 -1 0 1 2 3
[image:10.595.67.503.72.649.2](a) INDIA
not likely to contribute to the decadal / epochal or oscilla-tory behaviour of the rainfall regimes.
References
Chen, L.X., M. Dong, and Y.N. Shao, 1992: The characteristic of interannual variations on the east Asian monsoon. J. Met.
Soc. Japan, 70, 397-421.
Fu, C., and J. Fletcher, 1988: Large signals of climatic variation over the ocean in the Asian monsoon region. Adv. Atmos.
Sci., 5, 389-404.
Kripalani, R.H., and A. Kulkarni, 1997a: Rainfall variability over southeast Asia – connections with Indian monsoon and ENSO extremes: new perspectives. Int. J. Climatol., 17, 1155-1168.
Kripalani, R.H. and A. Kulkarni, 1997b: Climatic impact of El Niño / La Niña on the Indian monsoon: A new perspective.
Weather, 52, 39-46.
Li Chongyin and Mu Mingquan
LASG, Institute of Atmospheric Physics, CAS, Beijing 100029, China
1. Introduction
According to analyses in the SSTA, a dipole oscilla-tion of the Indian Ocean SSTA was indicated (Sagi et al., 1999), which represents the reverse variation feature of mean SST between (10oS-10oN, 50oE-70oE) region and (10o S-0o, 90oE-110oE) region. This dipole was regarded as one to be not always related to the ENSO. Webster et al. (1999) also suggested that the Indian Ocean dipole in 1997-98 was independent of the ENSO and caused by strong atmos-phere-land-sea interaction. Usually, the dipole is not only shown in the variation of SST, but also in the variation of subsurface ocean temperature (SOT) of the Indian Ocean (Anderson, 1999).
In fact, the importance of SSTA in the Indian Ocean and its influence on summer rainfall in the middle and lower reaches of the Yangtze River have been indicated early (Luo et al., 1985; Chen, 1991). But the Indian Ocean SSTA as a dipole need to be studied further, particularly the influence of the dipole on the Asian monsoon circula-tion and climate.
The SST data (1900-1997) used in this paper are ob-tained from the Hadley center in UK, which are monthly 5o x 5o grid point data and have been used in some studies (Parker et al., 1994; Smith et al., 1998). The spatial-tempo-ral features of the Indian Ocean dipole were studied by using above data (Li and Mu, 2000). The influences of the Indian Ocean dipole on the Asian monsoon circulation will be studied by using NCEP-NCAR reanalysis and other data further. In order to represent this dipole, we take the dif-ference of averaged SSTA between in the (5oS-10oN, 50o
E-65oE) region and the (10oS-5oN, 85oE-100oE) region as the dipole index, which will be better since some Islands and the Laut Jawa sea have been ruled out the definition do-main.
2. Influences of Indian Ocean Dipole on Asian monsoon circulation
The ENSO has been regarded as important signal and factor to cause interannual climate variation. The se-ries of studies in relation to the impact of the ENSO on climate have been completed (Namias and Cayan, 1981; Rasmusson and Wallace, 1983; Li, 1995). In another paper, the data analyses have clearly showed that the Indian Ocean dipole is related closely to the ENSO mode (Mu and Li, 2000), although it is not understood yet that which di-pole is more initiative and important in the interaction. But at least we can suggest that the Indian Ocean dipole also plays an important role in atmospheric circulation / cli-mate variation and anomalies over the globe, particularly through its interaction with the ENSO. In the following, the analyses will show some important impacts of the In-dian Ocean dipole on Asian monsoon circulation emphati-cally.
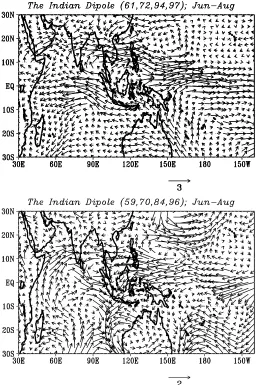
In order to reveal the feature of Indian Ocean di-pole and its influence on monsoon circulation, we respec-tively take 4 years (1961, 1972, 1994 and 1997) with larger positive index and 5 years (1958, 1959, 1960, 1970 and 1996) with larger negative index to engage in composite analy-ses. The anomalous circulation patterns at 850hPa in sum-mer (June-August) for positive phase and negative phase of the Indian Ocean dipole are shown in Fig.1, respectively. It can be seen that there is different pattern in Asian mon-soon region for different phase of the dipole. Correspond-ing to positive phase, there are anomalous southeasterly wind over the equatorial Indian Ocean, anomalous west-erly wind over Indian Peninsula and anomalous westwest-erly wind over the region from Bay of Bengal to the South China
Influence of the Indian Ocean Dipole on Asian Monsoon Circulation
Kripalani, R.H. and A. Kulkarni, 1999: Climatology and variabil-ity of historical Soviet snow depth data : some new per-spectives in snow-Indian monsoon teleconnections.
Cli-mate Dynamics, 15, 475-489.
Kripalani, R.H., A. Kulkarni, and S.V. Singh, 1997: Association of the Indian summer monsoon with the Northern Hemi-sphere mid-latitude circulation. Int. J. Climatol., 17, 1055-1067.
Kripalani, R.H., and A. Kulkarni, 2001: Monsoon rainfall varia-tions and teleconnecvaria-tions over South and East Asia. Int. J.
Climatol., 21, (in press).
Webster, P.J., V.O. Magaña, T.N. Palmer, J. Shukla, R.A. Thomas, M. Yanai and T. Yasunari, 1998: Monsoons: Processes, pre-dictability and the prospects for prediction. J. Geophys. Res., 103, 14451-14510.
Sea. This means that the summer monsoon over the South China Sea and Indian Peninsula are stronger for positive phase of the Indian Ocean dipole. But in negative phase, there are anomalous weaker southerly wind over the equa-torial western Indian Ocean, anomalous weaker northwest-erly wind over the equatorial eastern Indian Ocean, anoma-lous westerly wind over the southern Indian Peninsula, anomalous easterly wind over the region from the Bay of Bengal to the South China Sea. This means that the sum-mer monsoon is weaker over the South China Sea region but stronger over the southern India for negative phase of the Indian Ocean dipole.
In order to show the influence of the Indian Ocean dipole on the Asian summer monsoon further, some corre-lation coefficients of the Indian Ocean dipole index with the geopotential height at the middle-high troposphere are calculated by using the NCEP reanalysis data (1958-1997). It is known that the anticyclone in upper troposphere over the Tibetan plateau (called Tibetan high or South Asian high) is an important component of the Asian summer monsoon system, the intensity of South Asian high can
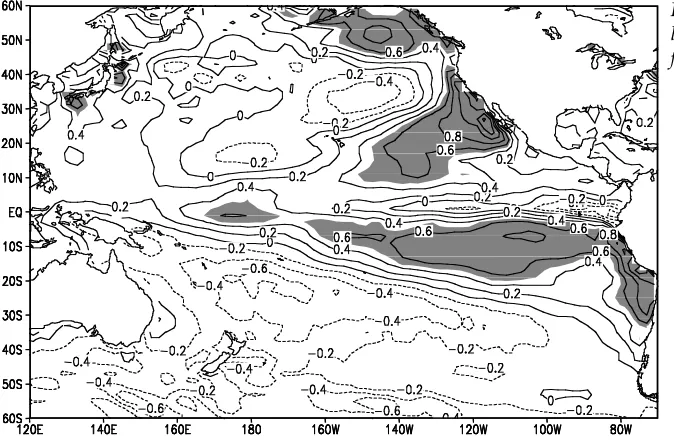
partly represent the activity of the Asian summer mon-soon. In Fig.2a, the distribution of correlation coefficient of the Indian Ocean dipole index with the geopotential height at 200hPa over the globe is shown. The strong nega-tive correlation center over the Tibetan Plateau shows that the dipole index has negative correlation with the inten-sity of the South Asian high. In other words, the South Asian high is weaker for positive phase of the Indian Ocean dipole; but corresponding to negative phase of the dipole, the South Asian high is stronger and to the west. The In-dian Ocean dipole will still impact on the Asian summer monsoon (especially the East Asian summer monsoon) through the South Asian high (Tao and Zhu, 1964).
The subtropical high over the northwestern Pacific is also an important component of the East-Asian sum-mer monsoon system, and it can cause serious climate anomalies in East Asia (Huang and Yu, 1972; Tao et al., 1998). According to the data analysis, it is also clear that the subtropical high over the North Pacific is related to the Indian Ocean dipole. As shown in Fig.2b, the subtropi-cal high is weaker for positive phase of the Indian Ocean dipole; but corresponding to negative phase of the Indian Ocean dipole, the subtropical high is stronger. Over the
Fig. 1: The circulation patterns at 850hPa in summer (June-August) over the southern Asia, corresponding to positive phase (a) and negative phase (b) of the Indian Ocean dipole, respec-tively.
[image:12.595.35.294.64.449.2] [image:12.595.305.559.355.718.2]East-Asian continent, the correlation is positive. There is anomalous ridge (trough) over the East-Asian continent region corresponding to positive (negative) phase of the Indian Ocean dipole.
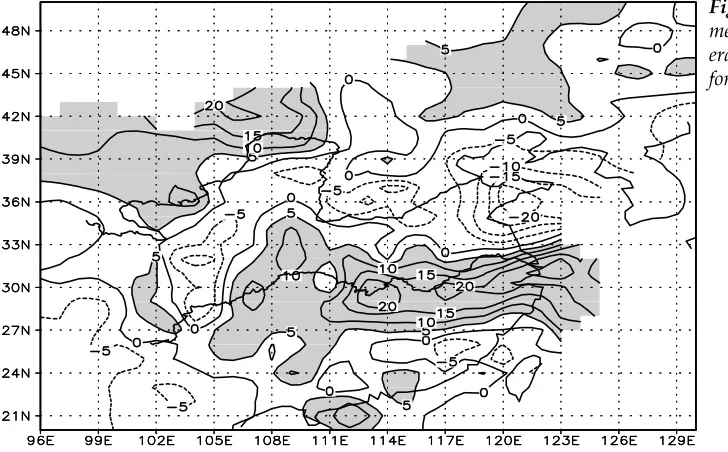
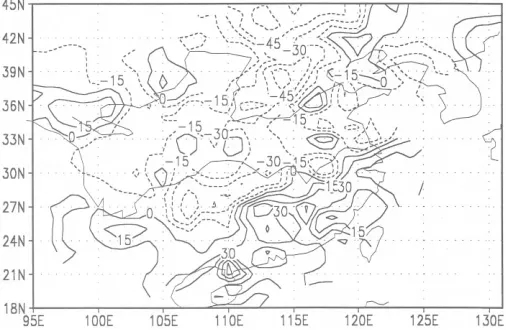
The summer precipitation anomalies in Eastern China result mainly from summer monsoon activity and its anomaly. The precipitation anomalies in Eastern China can also represent the influence of the dipole on Asian sum-mer monsoon. The difference of the precipitation
anoma-lies (%) during summer (June – August) in China corre-sponding to positive phase and negative phase of the In-dian Ocean dipole is shown in Fig.3, which is calculated for 4 strongest positive phase years and 5 strongest nega-tive phase years, respecnega-tively. Although the Indian Ocean dipole is weaker in summer generally, it is still shown for the positive phase of the Indian Ocean dipole that there is more summer rainfall in southeastern China/southern China and northeastern China, but is less summer rainfall in the other regions of China ( particularly in northern China ). For negative phase of the Indian Ocean dipole, the precipitation pattern is inversion.
In Fig.2, we can still find the strong correlation zone in the 40-50oS latitudes over the southern Indian Ocean and the western coast of North America. This means that the variations of atmospheric circulation and climate in those regions are also related to the Indian Ocean dipole. Corre-sponding to positive (negative) phase of the Indian Ocean dipole, there is an anomalous trough (ridge) at upper tropo-sphere over the western coast region of North America and the weather and climate in the United States, particularly in the western region, will be impacted prominently. For positive phase of the Indian Ocean dipole, there are anoma-lous easterly winds in northeastern Australia and the cy-clonic circulation in southwestern Australia and in west-ern South Africa; for the negative phase of the dipole, there are anomalous easterly winds in southeastern Australia and an anticyclonic circulation in South Africa.
3. Omen signification of the Indian Ocean dipole
When we analyse the correlation of the Indian Ocean dipole index with geopotential height, an obvious lag cor-relation is shown. The variations of atmospheric circula-tion and climate in some regions are lagging to the varia-tion of the dipole index, so that, the Indian Ocean dipole index can be a predictive signal of the climate variation in some regions. This may be very important and variable.
In Fig. 4, the distributions of correlation coefficients of the dipole index leading 5 months to global geopotential height at 200hPa and 700hPa (similar with that at 500hPa) are shown, respectively. It is clear that there is an obvious PNA pattern over the eastern Pacific / the North America region and a negative center over the Tibetan Plateau. This means that the positive (negative) phase of the Indian Ocean dipole can be regarded as a factor to predict the ap-pearance of inverse (direct) PNA pattern and weak (strong) situation of the Tibetan high after 5 months. Although the geopotential height is not best to use in the tropics, the strong correlation over the global tropics can be believed. This means that the easterly wind will be enhanced (weak-ened) in all tropical troposphere after positive (negative) phase of the Indian Ocean dipole for 5 months.
[image:13.595.37.290.68.233.2]Therefore, it can be suggested that the Indian Ocean dipole may be a predictor for atmospheric circulation and climate variations although the further research in relation to this respect is necessary.
[image:13.595.39.287.423.739.2]4. Conclusion
Based on above data analyses, some interesting re-sults on the influence of the Indian Ocean dipole on Asian monsoon are obtained, the major results can be sum up as following:
1. Through impacting the wind field in the lower tropo-sphere, the Indian Ocean dipole will directly affect the Asian summer monsoon. Corresponding to positive phase of the Indian Ocean dipole, summer monsoon is stronger in India and South China Sea; but summer monsoon is weaker in the South China Sea and stronger in southwestern part of Indian peninsula for negative phase of the Indian Ocean dipole.
2. Corresponding to positive (negative) phase of the In-dian Ocean dipole, the Tibetan high over the northwest-ern Pacific is weaker (stronger) and the subtropical high is also weaker (stronger). The influence of the Indian Ocean dipole on the Tibetan high and the subtropical high is another way to affect the Asian-summer mon-soon, particularly the East Asian summer monsoon. 3. The Indian Ocean dipole can impact on summer rainfall
in eastern China certainly.
4. The Indian Ocean dipole can also lead atmospheric cir-culation and climate anomalies in North America, Aus-tralia and South Africa regions.
5. The positive (negative) phase of the Indian Ocean di-pole can be regarded as a factor to predict the appear-ance of inverse (direct) PNA pattern and weak (strong) situation of the Tibetan high after 5 months.
Acknowledgements
This work was supported by the National Key Basic Science Program in China (Grant No. 1998040903).
References
Anderson, D., 1999: Extremes in the Indian Ocean. Nature, 401, 337-339.
Chen, L., 1991: Influence of zonal difference of the SSTA from Arabian Sea to South China Sea on the precipitation in the middle-lower reaches of the Yangtze River. Chinese J.
Atmos. Sci., 15, 33-42.
Huang, S., and Z. Yu, 1961: On the structure of the subtropical high and some associated aspects of the general circula-tion of atmosphere. Acta Meteor. Sin., 31, 339-359. (in Chi-nese).
Li, C., 1995: Introduction to Climate Dynamics, 227-282, China Meteorological Press, Beijing. (in Chinese).
Li, C., and M. Mu, 2000: Temperature dipole in the equatorial Indian Ocean and its influences on Climate, CEVP, Au-gust 7-11, 2000, Shanghai, China.
Luo, S., Z. Jin, and L. Chen, 1985: Correlation analyses of the SST in the Indian Ocean / the South China Sea and the pre-cipitation in the middle-lower reaches of the Yangtze River.
Chinese J. Atmos. Sci., 9, 336-342.
Mu, M., and C. Li, 2000: Indian Ocean dipole and its relationship with ENSO mode, Acta Meteor. Sin., submitted.
Namias, J., and D.R. Cayan, 1981: Large-scale air-sea interactions and short-period climate fluctuations. Science, 214, 868-876.
Parker, D.E., P.D. Jones, C.K. Folland, and A. Bevan, 1994: Interdecadal changes of surface temperature since the late nine-teenth century. J. Geophys. Res., 99, 14373-14399. Rasmusson, E.M., and J.M. Wallace, 1983: Meteorological aspects
of El Niño /Southern Oscillation. Science, 222, 1195-1202. Saji, N.H., B.N. Goswami, P.N. Viayachandrom, and T. Yomagada, 1999: A dipole mode in the tropical Indian Ocean. Nature, 401, 360-363.
Smith, M.S., R.E. Livezey, and S.S. Shen, 1998: An improved method for analysing sparse and irregularly distributed SST data on a regular grid: The tropical Pacific Ocean. J.
Climate, 11, 1717-1729.
Tao, S., and F. Chu, 1964: The 100 mb flow patterns in Southern Asia in summer and its relation to the advance and retreat of the west-Pacific subtropical anticyclone over the far East.
Acta Meteor. Sin., 34, 396-407. (in Chinese).
Tao, S., Q. Zhang, and S. Zhang, 1998: The great floods in the Yangtze river valley in 1998. Climate and Environmental
Research, 3, 290-298. (in Chinese).
Webster, P.T., A.M. Moore, J.P. Loschning, and R.R. Leben, 1999: Coupled ocean-atmosphere dynamics in the Indian Ocean during 1997-98. Nature, 401, 356-360.
CLIVAR Exchanges Call for contributions
We would like to invite the CLIVAR community to sub-mit papers to CLIVAR Exchanges for the next two is-sues.
The next one which will appear in September will be dedicated to issues related to climate change prediction, detection and attribution. Since one of the main foci of CLIVAR is related to anthropogenic change and the Third Assessment Report of the Intergovermental Panel on Climate Change (IPCC) has recently been finalised, we would like to highlight the recent accomplishments in CLIVAR related research on this sector.
The deadline for this issue is August 5, 2001.
Secondly, the last issue of this year will be dedicated to climate research in the Southern Ocean area. CLIVAR’s focus on Southern Ocean Climate Variability has recently been fostered by a meeting in Perth (see Exchanges No.18) and will soon be organised through a Southern Ocean Implementation Panel. Thus, scientific input for this part of the CLIVAR programme will stimulate the development for a strong Southern Ocean component within CLIVAR.
The deadline for this issue is November 5, 2001.
Guidelines for the submission of papers for CLIVAR Exchanges can be found under:
M. Rajeevan
India Meteorological Department Pune-5, INDIA. 411 005
Mean monsoon rainfall over India as a whole dur-ing the period, June-September is 88 cm with a coefficient of variation of 10%. Indian summer monsoon rainfall (ISMR) exhibits large inter-annual variations, which gen-erate profound socio-economic impact on many spheres of national activities. Therefore the long-range prediction (sea-sonal prediction) of summer monsoon rains over India is very useful. The Indian Meteorological Department (IMD) has been using the statistical approach successfully for mon-soon seasonal prediction for many decades.
Studies based on data analysis (Ajaymohan and Goswami, 2000, Webster et al., 1998) and numerical mod-els, have suggested that mean monsoon circulation may not be entirely forced by the boundary conditions but is also governed by internal dynamics to some extent, which ultimately limits the predictability of ISMR. The statistical models are based on the assumption that the association measured by the correlation coefficient (CC) between pre-dictor and the predictant, computed based on past data would persist in future also. However, secular variations between the predictors and ISMR have been noted (Parthasarathy et al., 1991; Hastenrath and Greisher, 1993). These variations have been found to be linked to changes in the global and regional circulation patterns. These secu-lar changes therefore pose serious challenge to long-range forecasting. Analysis of more than 20 known predictors has revealed that many of the predictors have lost the signifi-cant relationship with ISMR during the recent years (not shown).
Epochal changes in Indian monsoon empirical pre-dictability for the last 100 years have been examined using a statistical model developed with 100 years of data (1901-2000). Five predictors (NW India Minimum temperature in May, N.H.Temperature (January+February), Argentina Pressure (Spring), Darwin Pressure Tendency and Niño 3 SST Index tendency (MAM-DJF)) for the period 1901-2000 have been used to develop a statistical model. These pre-dictors represent the ENSO forcing, land surface conditions over Eurasia and the intensity of the heat low over NW India. The principal component analysis (PCA) of these 5 predictors was made and the resultant 3 significant princi-pal components were further used to develop a multiple regression model. The results are shown in Fig.1 (page 18), which shows the 11 year moving correlation between a) the first principal component and ISMR b) correlation co-efficient between the actual and hindcast ISMR or skill of the model. The 11 year running mean of standard devia-tion anomaly (subtracted from long term mean of 10%) of ISMR is also shown.
The correlation coefficient (C.C.) between the first principal component (P.C.) and ISMR reflects the general relationship between the predictors and ISMR. This rela-tionship was weak in 1930s and 1940s. During the recent years also this relationship was found to be weak. During the 1960s to 1990s this relationship was however very strong. Obviously, the skill of the model also shows simi-lar type of variations. The model skill was positive during 1960s to 1990s. However, the model skill was found to be negative during 1930s and 1940s and also during the re-cent years. It is also interesting to note that the standard deviation of ISMR was found to be smaller (or ISMR re-mains within normal limits) during 1930s and 1940s and again during the recent years. It is to be mentioned that ISMR was normal successively for last 12 years since 1989. Therefore the periods of normal monsoon rainfall coincide with the periods of weaker relationship between the pre-dictors and ISMR and also negative model skill. This is curious because it is generally believed that statistical mod-els do not show good skill when the inter-annual variation of monsoon is very large. However, here we have seen that good positive model skill was observed when the inter-annual variability of ISMR was also very large. This is be-cause the predictor-ISMR relationship was also stronger during those periods when the inter-annual variability was very large. Thus stronger boundary forcing-ISMR coupling leads to large inter-annual variations of ISMR. When this coupling becomes weak, monsoon tends to remain normal as observed in the recent years. But during these periods empirical models based on these boundary forcing param-eters will show poor predictive skill.
References:
Ajaymohan, R.S., and B.N. Goswami, 2000: A common spatial mode for intra-seasonal and inter-annual variation and predictability of the Indian summer monsoon. Curr.
Sci-ence, 79, 1106-1111.
Hastenrath, S., and L. Greisher, 1993: Changing predictability of Indian monsoon rainfall anomalies? Proc. Indian. Acad.
Science, 102, 35-47.
Parthasarathy, B., K. Rupa Kumar, and A.A. Munot, 1991: Evi-dence of secular variations in Indian monsoon rainfall-circulation relationships. J. Climate, 4, 927-938.
Webster, P.J., V.O. Magaña, T.N. Palmer, J. Shukla, R.A. Tomas, M. Yanai, and T. Yasunari, 1998: Monsoons, Processes, Pre-dictability, and the prospects for prediction. J. Geophys .Res., 103, 14,451-14510.
Roger Lukas
University of Hawaii, Honolulu, Hawaii, USA [email protected]
Much progress has been made in observing, under-standing and predicting ENSO, and attention has turned towards decadal variability of the coupled ocean-atmos-phere system in the Pacific sector. Decadal variability is as important as ENSO to observe, understand and predict because it has significant effects on climate in many places around the world, because these effects may combine with those of ENSO to produce climate extremes, and because these natural decadal variations must be taken into account in attempting to identify anthropogenic changes to the Earth’s climate.
Among other hypotheses about Pacific decadal vari-ability, it has been suggested that decadal variability in the North Pacific interacts with ENSO through subduction of upper ocean thermal anomalies in the subtropics (possibly forced by ENSO), and their subsequent re-emergence in the eastern equatorial Pacific upper ocean (Gu and Philan-der, 1997).
A number of recent model and empirical studies of decadal variability of the North Pacific Ocean have made unwarranted assumptions that salinity doesn’t vary, or that any variability is explained by a time invariant T-S tionship. A slightly more sophisticated assumption is a rela-tively stable T-S relationship, below the surface mixed layer, that varies regionally and possibly seasonally. Thus, knowl-edge of temperature is considered sufficient to determine the density field in the ocean interior. However, the Earth’s hydrological cycle is subject to climate variability that in-cludes salinity variations not simply correlated with tem-perature variations (e.g. Lukas and Lindstrom, 1991; Webster and Lukas, 1992). In fact, I show here that the T-S relationship in the North Pacific subtropical gyre varies on climate time scales.
There are very few long-term observations of the Pacific Ocean that can be used to quantify and improve our understanding of decadal modes of climate variabil-ity, and most concern only near-surface variations. Long-term observations of temperature profiles are available, but their space-time distribution has varied on climate time scales, making interpretation difficult at best. As suggested above and shown later, conclusions about ocean dynamics and thermodynamics based on temperature alone are po-tentially very misleading. All but a handful of the long time series of subsurface salinity are along the coasts, rather than in the deep ocean interior. A notable exception is the time series from Ocean Station Papa in the northeast Pacific. The Hawaii Ocean Time-series (HOT) program was established,
in part, to help address these deficiencies (Karl and Lukas, 1996).
The HOT Station ALOHA is 100 km north of Oahu, Hawaii at 22°45’N, 158°W (Fig. 1, page 18) in approximately 4800 m of water. The site has been occupied 10-12 times each year from October 1988 through January 2001. Sta-tion visits last about 3 days, and include 36 hours of 3-hourly “burst” CTD profiling of temperature and salinity over the upper 1000 m, required to average out the ubiqui-tous baroclinic tideswhich are a strong source of noise for ocean climate studies. Many other observations, including carbon cycle related biogeochemistry, are made during each cruise (Karl and Lukas, 1996).
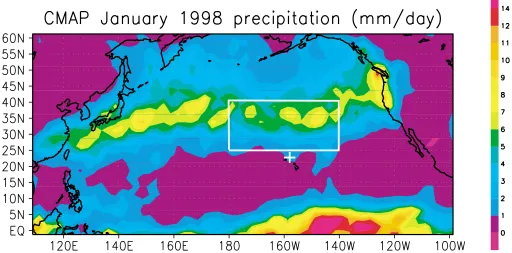
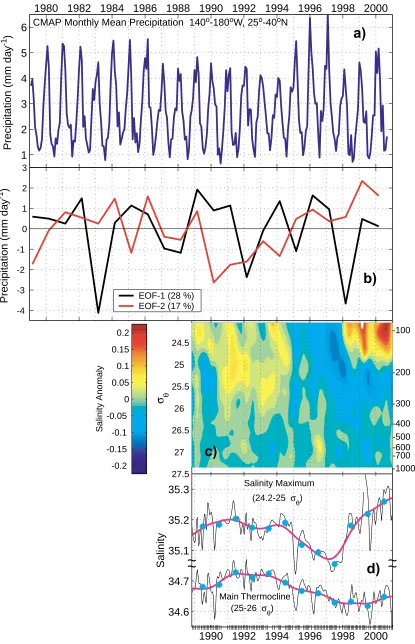
The annual mean North Pacific sea surface salinity (SSS) shows an elongated maximum (>35‰) centred along 25oN, from about 150oE to 135oW. This salinity maximum lies under a zonal band where there is a net loss of fresh-water from the ocean to the atmosphere, on average, but the SSS maximum is about 500 km north of the maximum freshwater loss. This is due to the northward Ekman flow driven by the easterly Trade Winds, and to the cumulative loss of freshwater along the trajectory of the surface water parcels. The meridional SSS gradient reverses under the region of net loss due to southward flow of fresher waters from the storm track region (c.f. Fig. 1, page 18) under the influence of the midlatitude westerlies. The SSS maximum is in a region of convergence associated with the Subtropi-cal Front, where SST anomalies have a relative maximum (Nakamura et al., 1997). At this front, waters are subducted into the pycnocline during late winter each year, forming the shallow salinity maximum of the central North Pacific Ocean observed at ALOHA. Wind, rainfall and evapora-tion are subject to interannual and decadal variaevapora-tions, and these cause low frequency salinity changes near the Sub-tropical Front that appear with some delay at ALOHA, as shown below.
Variation in summertime rainfall over the central North Pacific (CNP) is relatively small, but there are pro-nounced differences in the winter season peak rainfall rate and its timing (Fig. 2a, page 19). During the first half of the 1980s, CNP winter rainfall is relatively high and relatively low during 1990-94. From 1995-1997, winter rainfall is rela-tively high, with two of the highest years in the record. The monthly departures from the 1979-1997 climatology (not shown) reveal that events of a month or two domi-nate, which is consistent with storm track variability. There is, however, an underlying decadal variation, with a peak in the mid-1980s, a minimum in 1990, and another peak in 1996. This decadal variation is relatively small in
e
Chang et al.: Possible Roles of Atlantic Circulations on the Weakening Indian Monsoon Rainfall - ENSO Relationship, page 5:
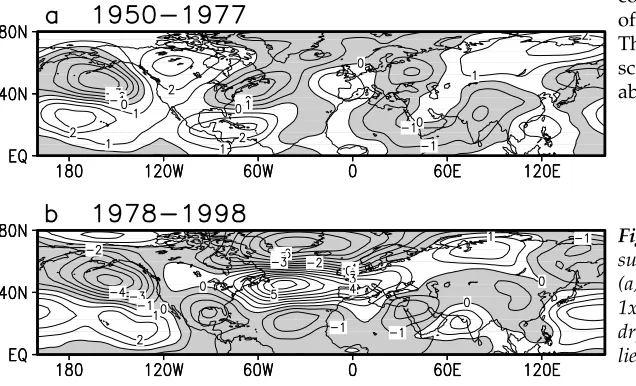
Fig. 4: Distribution of correlations between winter western European SAT index and the 1950-1977 (a) winter and (b) spring global SAT, and the 1978-1998 (c) winter and (d) spring global SAT. Correlation significant at 5% and above are shaded red for positive values and blue for negative values (contour interval 0.2). Panel (e) contains the 500 hPa streamfunction difference between the 1978-1998 and 1950-1977 periods (contour interval is 1x10⁶ m2 s-1, negative values are shaded).
[image:17.595.112.506.105.342.2] [image:17.595.123.492.392.728.2]Epochal Variation of Indian Monsoon Rainfall Predictability
-6 -4 -2 0 2 4 6
1906 1909 1912 1915 1918 1921 1924 1927 1930 1933 1936 1939 1942 1945 1948 1951 1954 1957 1960 1963 1966 1969 1972 1975 1978 1981 1984 1987 1990 1993
Year
STDDEV Anomaly ( %)
-1 -0,8 -0,6 -0,4 -0,2 0 0,2 0,4 0,6 0,8 1
Correlation Coefficient
stddvanom ccpc1(-) fcskill Rejeevan: Epochal Variation of Indian Summer Monsoon Rainfall Predictability, page 15:
[image:18.595.42.557.113.403.2] [image:18.595.40.552.503.756.2]R. Lukas: Freshening of the upper Thermocline in the North Pacific subtropical Gyre associated with decadal Increase of Rainfall, page 16:
Figure 1: Daily average rainfall (mm/day) for the month of January 1998. The region enclosed by the box in the central North Pacific is used in subsequent figures. The white cross indicates the location of the Hawaii Ocean Time-series station.
Figure 2: (a) Time series of monthly rainfall (Xie and Arkin, 1997) over the North Pacific area indicated in Fig. 1. (b) Time series of the first two EOFs of winter rainfall over the entire North Pacific. (c) Time series of salinity anomaly versus potential density. The scale along the right axes indicates the mean depth of the corresponding isopycnal surface. (d) Time series of layer- averaged salinity for the salinity maximum layer and the main thermocline. Light lines connect individual cruise values. Heavy lines are smoothing cubic splines. Closed circles are annual averages. Tick marks along the time axes indicate the timing of individual HOT cruises.
1980 1982 1984 1986 1988 1990 1992 1994 1996 1998 2000
1 2 3 4 5
6 CMAP Monthly Mean Precipitation 140o-180oW, 25o-40oN
Precipitation (mm da
y
-1 )
-4 -3 -2 -1 0 1 2 3
Precipitation (mm da
y
-1 )
EOF-1 (28 %) EOF-2 (17 %)
Salinity Anomaly
-0.2 -0.15 -0.1 -0.05 0 0.05 0.1 0.15 0.2
24.5
25
25.5
26
26.5
27
27.5
-700 -100
-200
-300
-400 -500 -600
-1000
σ θ
1990 1992 1994 1996 1998 2000 34.6
34.7 35.1 35.2 35.3
~
~
~
~
Salinity
Salinity Maximum
(24.2-25 σθ)
Main Thermocline
(25-26 σθ)
||| || ||||||||||||| | | ||||||||| |||| | ||| |||||| || | | ||| |||||| |||| ||||| | ||||||||||||||||| | ||||||||| ||||||||| || ||| |||||||| | |||