An Examination of the Public Transport
Information Requirements of Users
Brian Caulfield and Margaret O’Mahony
Abstract—This paper focuses on the provision of public trans-port information in Dublin, Ireland. It examines both existing and potential methods of accessing information, with particular focus on the implementation of various intelligent transport systems applications. One of the main objectives of this paper is examining the stages a passenger goes through when deciding to undertake a public transport trip and in what form they require information at each stage. This paper defines these stages as “pre-trip to destination,” “at-stop,” “onboard,” and “pre-trip to origin” (this is the return journey). Each of these four stages is examined in this paper. A web-based survey was used to collect data on passenger preferences and describes the methods of information delivery each passenger requires at each stage. This paper primarily deals with the respondents’ stated preference for public transport in-formation and does not examine revealed preferences. The survey also details results of passengers’ opinions of the different infor-mation provision formats such as call centers, mobile phones, the Internet, and paper-based methods. This paper concludes with the results of this exploratory research.
Index Terms—Passenger information, public transport, real-time information.
I. INTRODUCTION
T
HE SOURCES of information people may use when plan-ning a trip by public transport are examined in this paper. The four stages of a public transport trip are defined along with the types of information that may be available to them at each of these stages. A web-based survey was used to collect exploratory data on respondents’ perceptions of public transport information and their preferences for a passenger information system.The public transport system in Dublin, Ireland, is made up of three modes, namely 1) bus; 2) light rail; and 3) heavy rail. The main bus operator, i.e., Dublin Bus, operates a fleet of 1100 and provided 149 million passenger journeys in 2003 [1]. The bus system consists of 12 radial quality bus corridors (QBCs), providing passengers with a high quality of service and com-parable transit time with that of the private car [2]. The Dublin Area Rapid Transit (DART) system is a heavy rail suburban system that in 2002 provided 22 million passenger journeys [1]. In 2004, a new mode of transport was introduced when the light
Manuscript received March 7, 2006; revised May 24, 2006, July 11, 2006, August 25, 2006, and August 28, 2006. This work was supported by the De-partment of Transport under the Transport Research Programme administered by the Higher Education Authority. The Associate Editor for this paper was A. Hegyi.
The authors are with the Centre for Transport Research, Department of Civil, Structural, and Environmental Engineering, Trinity College Dublin, 2 Dublin, Ireland (e-mail: [email protected]; [email protected]).
Digital Object Identifier 10.1109/TITS.2006.888620
rail transit system called Luas became operational. The system launched in 2004 offers the first two lines of a planned light rail network.
Section I examines the different methods of providing public transport passenger information, which are subsequently exam-ined in the survey, drawing from both Irish and international examples. Section II discusses the purposes of the survey. In Section III, the data collection technique is described, as well as some of the characteristics of the sample. The results of the survey are provided in Section IV. This paper concludes with policy recommendations.
II. PASSENGERINFORMATIONSYSTEMS
A variety of public transport information systems are used worldwide. A web-based survey was used to collect tion on passengers’ preferences for public transport informa-tion. Respondents to the survey were given a number of such systems to evaluate. The following sections detail some of the systems, which are currently available in Dublin, and also include examples from other countries.
A. Internet
In Dublin, to date, no integrated website that provides pas-sengers with an integrated source of passenger information exists. Thus, the Internet services provided by other public transport authorities were used to derive the attributes of a passenger information website for this survey. In Gothenburg, Sweden, the public transport authority hosts a comprehensive website providing integrated passenger information and real-time location of public transport vehicles across the network. Since the launch of the website in 1995, the number of visitors to the website has grown from 100 000 to 1 200 000 in 2001 [3]. Transport for London, U.K., also provides passengers with a comprehensive Internet service with a complete multimodal multioperator journey planner, which is available on the Inter-net and mobile phones [4]. Seattle, WA, also has an extensive Internet service, which, since its launch in 2000, has had over 7 500 000 requests for real-time departure times with 79% of these requests occurring on weekdays [5].
B. Real-Time Passenger Information (RTPI) Displays
RTPI displays provide passengers with information on the es-timated time of arrival of their vehicle via a passenger informa-tion display (PID). To date, in Dublin, all of the Luas and DART stops/stations provide RTPI, and three of the 12 QBC routes
provide RTPI. The current bus-based system is part of a pilot project, and a decision on its extension is pending. However, research conducted by the authors on this system demonstrates that the passengers are pleased with the information provided by this pilot service [6]. All of the Luas stops are equipped with PIDs. The Luas PID provides information on the expected wait time, which is displayed on a screen and relayed via audio speakers [7]. This is similar to the DART system. However, the DART, as yet, does not provide audio announcements on wait times.
Internationally, RTPI displays have been widely used to provide passengers with transport information for bus and rail. The London Buses “Countdown” system is one of the largest RTPI systems in the world with over 2000 stops equipped with RTPI displays. San Francisco, CA, also has an extensive system of on-street RTPI displays for bus, trolley bus, and light rail. This system has been in development since the late 1990s, and operators have estimated that there has been a 5% increase in patronage on their rail services since the real-time systems came on line [8].
In Dublin, onboard RTPI displays are currently provided on both DART and Luas services. DART provides a scrolling display detailing the name of the next stop, while Luas provides the same information as well as details of connecting services.
C. Mobile Phone Technology
Mobile phones have been used internationally to send and receive, via Short Message Service (SMS), passenger infor-mation. Currently, in Dublin, two operators provide passenger information via mobile phones. Dublin Bus provides a service called “BUSTXT,” whereby passengers can receive static in-formation on the departure times of buses from their terminus. The only real-time service is provided on the DART service. This system provides passengers with real-time information on the time of arrival of trains at the required stations. To receive real-time information, passengers simply send a message to the operator indicating which station they are at, and within seconds, they receive the departure times of the next three trains in each direction (south and north bound). Irish Rail launched this service in May 2004, and each SMS costs 0.30 Euro. In London, Transport for London provides similar real-time information on vehicle arrival times and journey planners to mobile phones [9]. In Seattle, it is also possible to access real-time information through Wireless Application Protocol via mobile phones. Since the launch of this system in 2001, it has had on average 3500 requests for departure times during the first few months in 2001 [5].
D. Information Kiosks
Information kiosks are manned/unmanned structures that provide passengers with information on public transport. They can be equipped with RTPI displays and route maps to pro-vide passengers with an integrated source of information. On the recommendations of a public consultation in Gothenburg, unmanned kiosks with RTPI displays were installed in 1996; these kiosks received an upgrade in 2000 [3]. In Gothenburg,
the kiosks have been strategically placed adjacent to transfer points to facilitate passengers using more than one mode or service to complete their journey. San Antonio, TX, has also utilized information kiosks as a means to provide passenger information, and since 2000, 40 of these kiosks have been introduced in various locations around the city. These kiosks provide passengers with not only public transport information but information on traffic conditions as well [10].
E. Paper-Based Information
In Dublin, paper-based timetables are available from all op-erators, detailing the departure time from the terminus of each of the services. These timetables are generally only available at stations or directly from the operators. Onboard information in the form of maps on the side of the vehicle is available on all DART and Luas vehicles, but this is not available on buses. Bus stops in Dublin provide passengers with time of departure from the origin stop of the service or the expected frequency of the service by time of day.
III. WEB-BASEDSURVEY
As stated previously, one of the main aims of this paper is to ascertain, at each stage of a public transport trip, a passenger’s requirements of a passenger information system and the form in which this information is required.
For the purposes of this paper, public transport was split into four stages.
Stage One: pre-trip information from origin to destination; Stage Two: at-stop information;
Stage Three: onboard vehicle information; Stage Four: pre-trip information for return trip.
At each of these four stages, survey respondents were of-fered different methods of acquiring passenger information, the results of which are outlined below.
A. Data Collection
TABLE I
DEMOGRAPHICS OF THERESPONDENTS
B. Use of Web-Based Surveys
The use of web-based surveys has increased dramatically, which is mainly due to their ability to collect large amounts of data without interviews, to process results without data entry, and to eliminate stationery and postage costs [12]. However, one must take into account the biases that a web-based survey introduces, that is, that not all individuals have access to the Internet. In Ireland, the rates of Internet usage is ever increasing; in 2003, 39.4% of households in Dublin had access to the Internet [13], and in 2004, 43% of Irish adults currently use the Internet from any location (work or home, etc.) [14].
Web-based surveys have been increasingly adapted for trans-port studies, for example, in stated preference (SP), travel diaries, and travel behavioral studies [15]–[18]. The benefits (as discussed) of web-based surveys are becoming more widely known, and therefore, their use is increasing. In the area of SP survey implementation, the use of web-based surveys is also growing, where along with the disadvantages of survey bias and coverage error, there can be considerable advantages when using a web-page approach. Benefits, such as the elimination of response coding and digitizing error, and the possibility of including images and sound, make it attractive as a surveying tool. Another significant benefit is the possibility to automati-cally randomize the games presented in each situation, enabling the avoidance ofsequence effect [19]. Further information of this approach may be found in Louiveret al.[20].
IV. SURVEYRESULTS
The survey results detail the three main purposes of the survey, namely 1) an individual’s current attitudes to passenger information; 2) an importance ranking of the different attributes of the information provision options; and 3) the form in which information is required at each of the stages of a public transport trip.
A. Summary of Results
The demographics of the sample are outlined in Table I. More females than males completed the survey (38% male and 62% female). The majority of respondents (78%) were aged 34 and under. The results for the current mode of transport used demonstrated that a high percentage of the group use public transport with 31% and 16% using bus and rail, respectively.
TABLE II
CURRENTINFORMATIONOPINIONS
The results for other modes, namely walking (25%) and car (21%), constituted a sizeable proportion of respondents. Far less used the other modes offered, namely cycle (3%), motor-bike (1%), and taxi (1%).
B. Attitudes Towards Current Information Provision
Table II outlines the respondents’ current sources of passen-ger information. The findings indicate that 35% of passenpassen-gers use their existing knowledge to obtain information, while 30% use the Internet. Paper timetables were placed third with 20% of respondents using this method. The other options of SMS, TV/radio, and call center were placed fourth, fifth, and sixth, respectively.
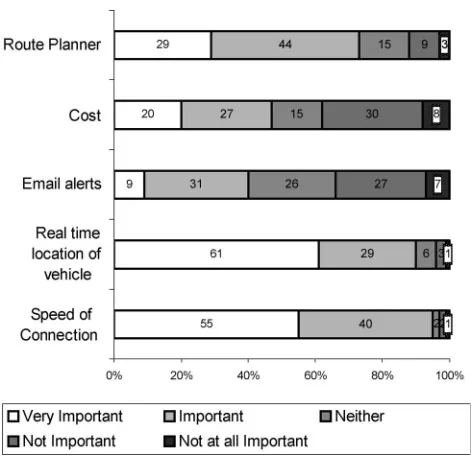
Fig. 1. Importance ratings of characteristics of information provision via the Internet.
Respondents were also asked to rate the quality of pas-senger information currently provided at stops/stations. When asked about the quality of the timetables provided, 68% either strongly agreed or agreed that the quality was poor. Moreover, 73% either strongly agreed or agreed that the quality of maps provided was poor. Finally, respondents were asked if the lack of information deterred them from using public transport. The majority of respondents disagreed with this statement (59% strongly disagreed/disagreed). A further 21% of respondents either strongly agreed or agreed that the lack of information deterred them from using public transport information. This 21% is a sizeable proportion of respondents and demonstrates that improvements to the system may attract more passengers. The results show that passengers found the current provision of information inadequate. However, it was not a strong enough factor to deter them from using the services.
C. Importance of Attributes of Public Transport Information Systems
Respondents were asked to rate the different characteristics of each of the information provision options. The results for each option are presented below.
1) Internet: The survey elicited respondents’ opinions on several characteristics of a public transport information web-site, the results of which are in Fig. 1. Respondents indicated that the speed of connection was very important, with an over-whelming 95% indicating it to be very important or important. The cost of connection was less influential than the speed of connection, with 47% stating it to be very important/important. Interestingly, 38% indicated that cost was not at all important/ not important.
[image:4.594.327.530.66.324.2]The services provided by the website were also rated. Over 90% of respondents indicated that a map with real-time location of the vehicle was either very important or important. Only 4% of respondents stated that this was either not at all important
Fig. 2. Importance ratings of characteristics of information provision via call centers.
or not important. A route planner was found to be very im-portant/important by 73% of respondents. Interestingly, only 40% of respondents stated that e-mail alerts on public transport services were very important/important, while 34% stated that they were not at all important/not important.
2) Call Center: The respondents’ ratings of the charac-teristics of call centers are shown in Fig. 2. As seen with the Internet, the speed of answering was shown to be more important than cost. Ninety-three percent of respondents stated that the speed of answering was either very important or important, whereas 82% stated that the cost of the call was very important/important. The higher emphasis on the cost of contacting a call center versus that of the Internet demonstrates that passengers may perceive the cost of phoning a call center to be more significant than logging on to a website, thus preferring the Internet over a call center; this is also demonstrated later with mobile phone options.
The method of call answering was also evaluated based on two answering options, namely 1) electronic answering; and 2) personal voice answering. The results reveal that personal answering is very important/important for 60% of respondents. However, 46% of respondents stated that electronic voice an-swering was neither important nor not important with a further 27% stating that it was not at all important/not important. The provision of real-time information was found to be one of the most important aspects of information provision via call centers, with 85% of respondents stating that it was very important/important.
Fig. 3. Importance ratings of characteristics of information provision via mobile phone.
real-time information at 85%. The cost of information provided via mobile phones was also found to be important with 84% of respondents stating that this characteristic was either very important or important. This result is similar to that observed for call centers in that the cost of information access is a considerable factor.
4) Paper-Based Information: In the previous section, the results demonstrated that passengers were not happy with the quality of at-stop/station paper-based information. This is reit-erated in this section as respondents reacted positively to the options offered, deeming them all to be very important, as seen in Fig. 4. The highest level of very important ranking was for the option of having booklets with bus or rail timetables, with 89% indicating it to be very important/important. The second highest level was for having combined booklets of bus and rail timetables with an 85% very important/important rating. The provision of maps with all stops/stations displayed had the third highest of 80% very important/important rating. Eighty percent of respondents indicated that it was very important/important that maps should have details of connecting services. Another issue covered in this section was the availability of this informa-tion at not just the stop/stainforma-tion but at multiple locainforma-tions around the city, with 86% indicating it was either very important or important.
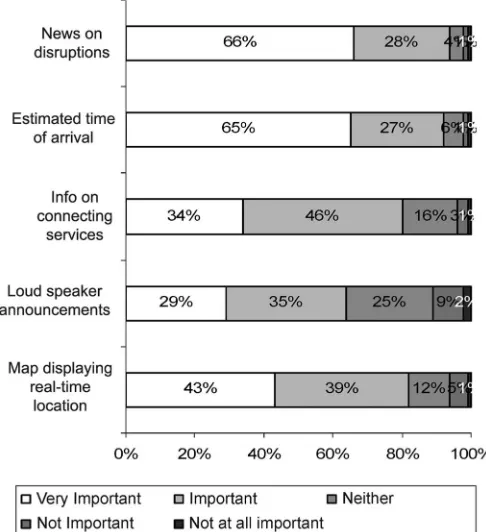
5) RTPI Displays: The levels of importance for each char-acteristic of an RTPI system are shown in Fig. 5. The results show that the most important characteristic to respondents (very important/important) is news on disruptions (95%), followed directly by estimated time of arrival (93%). The majority of respondents rated all five characteristics as very important/ important, with the lowest level of importance being attributed to loudspeaker announcement. Nevertheless, 64% of
respon-Fig. 4. Importance ratings of characteristics of information provision via paper-based systems.
Fig. 5. Importance ratings of characteristics of RTPI displays.
dents indicated that this characteristic was either very important or important.
V. RESULTS ATEACHSTAGE OF APASSENGERSTRIP
[image:5.594.63.263.66.329.2] [image:5.594.303.546.353.619.2]not been examined in relation to the proximity to the various methods of accessing information available to each respondent.
A. Pre-Trip Information From Origin to Destination
The information options offered to respondents for the first stage of a trip were 1) the Internet; 2) paper-based timetables; 3) call centers; and 4) SMS. The results in Table II demon-strate that paper-based timetables are the most popular option with 48% of the first preference and 25% second preference responses. The Internet was ranked second with 30% and 27% of the first and second preferences, respectively. The results show that mobile phone (17%) and call centers (5%) were the third and fourth preferred options. The lower rankings for SMS and call centers may be attributable to the cost associated with these forms of communication, as discussed earlier.
B. At-Stop/Station Information
The alternatives offered to respondents for this stage of a trip were 1) information kiosks; 2) paper-based timetables; 3) call centers; 4) SMS; and 5) RTPI displays. The results for this stage indicate that the majority of respondents have a preference for RTPI displays with 74% of first preference responses, as seen in Table III. Paper-based methods had the next highest number of first preferences with 12% and 39% of second preferences. Information kiosks were ranked third with 5% of first preferences and 36% of second. The remaining two options had similarly low first and second preferences, with SMS indicated to be slightly preferred to the call center option.
C. Onboard Bus/Train Information
The alternatives presented to respondents at this stage were 1) paper-based information placed on the inside of the vehicle; 2) call centers; 3) SMS; 4) onboard RTPI displays; and 5) asking the driver. The results for this stage are quite similar to the results in the second stage, with the onboard RTPI system achieving the highest number of first preference responses (68%), as seen in Table II. Similar to the previous results, paper-based methods had the second highest preference with 12% of first and 57% of second preferences. The remaining options achieved lower first preference levels as methods of accessing information, with asking the driver scoring 12%, SMS with 6%, and call centers with 3%.
D. Pre-Trip Information From Destination Returning to Origin
The choices given to respondents at this stage were 1) information kiosk; 2) paper-based timetables; 3) the Internet; 4) call centers; and 5) mobile phones. The results show that the Internet is the favored option at this stage with 64% of the first preference responses, as seen in Table III. Paper-based information again had the second highest number (26%) of first preferences and 31% of second preferences. A contributing factor to the Internet having the higher preference may be due to the sample taken, in that it was of office workers with access to the Internet. The next highest preference was for SMS with 7%
TABLE III
RESULTS OFSTAGE-BY-STAGEINFORMATIONPROVISION
of first and 19% of second preferences, followed by information kiosks with 6% and 18% of first and second preferences. The fifth placed option is the call center with 3% and 15% of first and second preferences.
VI. FRUSTRATIONLEVELSWITHPUBLICTRANSPORT
One of the main purposes for providing real-time public transport information to individuals is to reduce the levels of frustration they feel with public transport. With this in mind, individuals were asked if the lack of information on the where-abouts of their service caused them frustration. Individuals were asked if uncertainty as to when their service will arrive caused them frustration. Fig. 6 displays the results, broken down by the mode of transport most often used, car, public transport (any mode), and walk cycle. The results demonstrate that nonpublic transport users indicated that they found that this uncertainty to be very frustrating with 85% of car users and 73% of walkers/cyclists. This is compared to 72% of public transport users. Nevertheless, these results demonstrate that all users find this lack of information frustrating.
Fig. 6. Frustration with uncertainty of arrival.
Fig. 7. Frustration with not knowing if my bus/train has already passed.
that use public transport on a regular basis. The difference between response and the mode normally used is stronger by contrast in this question with 55% of public transport users, compared to 77% of car users, indicating that this was very frustrating.
VII. OPINION OFCURRENTLEVELS OF
PASSENGERINFORMATION
[image:7.594.46.272.292.480.2]One of the purposes of this paper was to get an overview of how individuals perceive the current quality of information in Dublin. Respondents were asked to rate the options on a five-point scale from “very good” to “very poor.” The results in Figs. 8–10, similar to those in Figs. 6 and 7, are segmented between car users, public transport users, and walking/cycling. The first option respondents were asked to consider was the quality of maps and bus stops/train stations. The findings in-dicate that all users inin-dicate that the quality of maps at bus stops/train stations was poor: As seen in Fig. 8, 52% of car users, 56% of walkers/cyclists, and 58% of public transport users found the maps to be either poor or very poor.
Fig. 8. Quality of maps provided at bus stops/train stations.
Fig. 9. Quality of timetables provided at bus stops/train stations.
At stop stations, timetables were also evaluated. The results show that all users indicate that the quality of timetables at bus stops/train stations was poor with 41% of car users, 45% of walkers/cyclists, and 42% of public transport users indicating that timetables were either poor or very poor.
Conversely, the results in Fig. 10 show the quality of public transport websites to be good or very good. As seen in Fig. 10, 45% of car users, 44% of walkers/cyclists, and 51% of public transport users found public transport websites to be either good or very good.
An important set of opinions to obtain for this paper was the current opinion of public transport in Dublin. The results in Table IV detail the findings when respondents were asked if they agree, disagree, or have no opinion on several statements.
[image:7.594.307.544.313.524.2]Fig. 10. Quality of public transport websites.
TABLE IV
CURRENTOPINIONS OFPUBLICTRANSPORT INDUBLIN
was already too expensive in the city. These results concur with the results in that 77% indicated that public transport has a bad image. Finally, given the focus of the research, respondents were asked if the lack of information deterred them from using public transport; 42% agreed that it did deter them from using public transport.
VIII. INCREASEDUSE OFPUBLICTRANSPORT
Respondents were also asked if they were provided with real-time information would they use public transport more fre-quently. Respondents were offered four options as to how much more public transport they would use, namely 1) “much more often 20%;” 2) “more often 10%;” 3) “some what more often;” and 4) “no change.” Table IV details the results broken down between public transport users, walking/cycling, car users, and the overall total number of respondents. The results are detailed below.
Much more often up to 20% more. As seen in the table, a total of 5% of respondents said that they would use public transport up to 20% more often. This result is broken down between the modes most often used. The results show that of this 5% of respondents that indicated they would use
TABLE V
INCREASEDUSE OFPUBLICTRANSPORT
public transport more often, 64% used public transport already. Of those that indicated that they would use public transport more, the results show that 18% were car users and likewise with walking/cycling.
More often up to 10% more. Table V shows that 21% of respondents said that they would use public transport up to 10% more often. This 21% is broken down between public transport users (52%), walking/cycling (20%), and car users (28%). This demonstrates that a considerable amount of car users would change to public transport.
Somewhat more often. The total number of respondents that said they would use public transport somewhat more often was 24%. This 24% can be broken down between public transport users (40%), walking/cycling (31%), and car users (29%).
No Change. Table V shows that 50% of respondents indicated that there would be no change in the number times they use public transport. This 50% is broken down between public transport users (55%), walking/cycling (19%), and car users (26%).
IX. HOWOFTENRESPONDENTSWOULDUSE
REAL-TIMEINFORMATION
Respondents were asked how often they would use real-time information were it to be introduced in Dublin. The results in Fig. 11 demonstrate across the three stages of passenger journey how often respondents would use these services. The results show that the at-stop stage, a third of respondents said they would use passenger information on a regular basis, and 20% said they would use it at the pre-trip planning stage from work to home. Of the three stages, pre-trip planning at home scored the lowest, with 38% saying they would seldom use passenger information at this stage.
X. INFORMATIONREQUIRED ATEACHSTAGE OF A
PASSENGERS’ JOURNEY
Fig. 11. How often respondents would use real-time information.
1) “pre-trip planning at home;” 2) “at-stop information;” and 3) “pre-trip planning from work to home.”
Table VI details the results from the regression analysis con-ducted upon the survey results. The four methods of obtaining passenger information in the survey were analyzed against the following dummy variables:
• multimodal trips; • mode currently used.
The table reports the regression coefficients and their corre-sponding t-values. The table is organized to show how the stage of the journey the respondent is on can affect their use of the various methods of obtaining passenger information. The results above provide interesting insights into what factors affected the respondent’s decisions in choosing between the various methods of obtaining public transport information. The following sections provide analysis of the results.
Internet. The results in Table V for the Internet show that in the morning, individuals are more likely to use the Internet to obtain public transport information. When comparing the mode used and the likelihood of using the Internet, it was found that Luas users were the most likely to use the Internet.
SMS. The findings demonstrate that individuals are more likely to use SMS to obtain passenger information on the first and second stages of their journey. Once again, the results demonstrate that Luas users were most likely to use SMS, with findings indicating that other rail users were also likely to use SMS. The results for bus users found that individuals planning their trip home were more likely to use SMS.
Call Center. The results for those undertaking a mul-timodal trip indicate that the only significant result was for those using the call center in the first stage of their journey. All of the results for the mode used were found to be significant. Once again, Luas users were found to be
TABLE VI
REGRESSIONRESULTS: COEFFICIENTS(t-VALUES)
the most likely to use a call center. For all of the modes examined, all of the results were found to be significant. The results at this stage found that Luas users in the first and third stages were most likely to use a call center, and at the at-stop stage, both bus and Luas users were the most likely to use a call center.
the bus were found to be the most likely followed by Luas and other rail users.
XI. CONCLUSION
This paper demonstrates that passengers in Dublin would like to see improvements in their public transport information system and have, as demonstrated in the results, indicated preferences to different forms of information provision. How-ever, when interpreting these results, one must be mindful that the sampling method chosen was nonrandom, and the results are intended to provide an overview of the passengers’ preferences.
The conclusions of this paper are as follows.
1) Currently, the majority of passengers in Dublin use their own existing knowledge or paper-based timetables to acquire public transport information.
2) At present, according to respondents, the information provided by operators in Dublin is not of a high quality, with the majority agreeing that they would like to see a higher quality of information provided.
3) The cost of using data sources such as SMS, call centers, and the Internet was illustrated to be very important to the respondents, if they were to use these applications. This may have resulted in the lower preference scores of these options.
4) The lack of certainty as to when their service would arrive was indicated as a factor that causes passengers frustration when using public transport.
5) The results on the current levels of quality of public trans-port information were indicated to be poor to average. 6) The provision of real-time information was shown to
be the most important method of information provision. Improved paper-based information also received a high rating by the respondents.
7) RTPI displays were found to be the most popular method of acquiring real-time information followed by SMS and call center.
8) At the pre-trip planning stage from work to home, the Internet was found to be the most popular method of acquiring public transport information; SMS was found to be the second choice, with call center the third. 9) The analysis has shown that those on multimodal
jour-neys, they were more likely to use public transport information.
10) Luas users were found to be the most likely to use SMS, the Internet, and call center.
11) The findings demonstrate that bus users at the “at-stop” stage are the most likely to use RTPI displays.
12) The results indicate that lack of certainty of the mode and increased trip complexity result in an increased likelihood that the respondent will require passenger information.
These findings are interesting and noteworthy in terms of investment allocation. It demonstrates that a package of infor-mation provision options is required and that investment in a single method of information provision may only satisfy the information requirements of part of a journey.
REFERENCES
[1] Córas Iompair Éireann,CIE Group Annual Report and Financial State-ments 2003, 2004, Dublin, Ireland.
[2] B. Caulfield and M. O’Mahony, “Evaluating the success of quality bus corridors in Dublin using an automatic licence plate recognition system,”
Transp. Res. Rec., vol. 1887, pp. 195–204, 2004.
[3] Gothenburg Traffic Information Centre, “Effects of real-time information in Gothenburg,” GOTIC, Gothenburg, Sweden, 19th GoTiC Rep., 2002. [4] G. Bailey, “Implemented travel information strategies, delivering
cus-tomer information to Londoners using new technology,” in Proc. 3rd UITP Conf. Travel Inf., Gothenburg, Sweden, 2003, [CD-ROM]. [5] S. D. Maclean and D. J. Dailey, “Wireless Internet access to real-time
transit information,”Transp. Res. Rec., vol. 1791, pp. 92–98, 2004. [6] B. Caulfield and M. M. O’Mahony, “The provision of on street passenger
information via real-time methods; A case study of Dublin,” inProc. RTIC IEE, 2004, pp. 1–10, 501.
[7] M. O’Mahony, “Light rail transit in Dublin,” inProc. 83rd Annu. Meeting Transp. Res. Board, Washington, DC, Jan. 2004, [CD-ROM].
[8] San Francisco Municipal Railway,Short Range Transit Plan, 2002-2021, 2001, San Francisco, CA.
[9] Transport for London,Annual Report 2002/03, 2003, London, U.K. [10] H. F. Weisberg, J. A. Krosnick, and B. D. Bowen,An Introduction to
Survey Research, Polling, and Data Analysis, 3rd ed. Newbury Park, CA: Sage, 1996.
[11] D. A. Dillman,Mail and Internet Surveys: The Tailored Design Method. New York: Wiley, 2000.
[12] K. Witt, “Best practices in interviewing via the Internet,” in Proc. Sawtooth Softw. Conf., 1998, pp. 15–37.
[13] Central Statistics Office. (2004, Apr. 13). [Online]. Available: http://www. cso.ie/pressreleases/prelcen02pser.html
[14] Commission for Communications Regulation, Irish Communications Market, Quarterly Key Data, Jun. 2004, Dublin, Ireland.
[15] A. C. Fayish and P. P. Jovanis, “Usability study of state wide web-based roadway weather information systems,” Transp. Res. Rec., vol. 1899, pp. 44–54, 2004.
[16] M. A. Stinson and C. R. Bhat, “An analysis of the frequency of bicycle commuting using and Internet-based survey,”Transp. Res. Rec., vol. 1878, pp. 122–130, 2004.
[17] B. R. DeSalle and A. P. Tarko, “Quality of highway safety information collection with an Internet-based survey tool,” inProc. 82nd Annu. Meet-ing Transp. Res. Board, Washington, DC, Jan. 2003, [CD-ROM]. [18] J. E. Marca, “The design and implementation of an on-line travel and
activity survey,” in Proc. 82nd Annu. Meeting Transp. Res. Board, Washington, DC, Jan. 2003, [CD-ROM].
[19] P. Iraguen and J. D. D. Ortuzar, “Willingness-to-pay for reducing fatal accident risk in urban areas: An Internet-based web page stated preference survey,”Accident Anal. Prev., vol. 36, no. 4, pp. 513–524, Jul. 2004. [20] J. L. Louiver, D. A. Hensher, and J. D. Swait,Stated Choice Methods,
Analysis and Application. Cambridge, U.K.: Cambridge Univ. Press, 2000.
Brian Caulfieldreceived the B.Sc. degree in man-agement and the MEcon.Sc. degree from Trinity College Dublin, Dublin, Ireland. He is currently working toward the Ph.D. degree at the same univer-sity, under the supervision of Prof. M. O’Mahony.
He is a Research Fellow with the Centre for Trans-port Research, Department of Civil Structural and Environmental Engineering, Trinity College Dublin. His research interests are transport economics and stated preference modeling techniques, environmen-tal impacts of transport, and impact of real-time transport information on public transport usage.