Estimation of soil erosion using USLE and GIS
in the locality of Tzicatlacoyan, Puebla, México
Erika María López-García
1, Edgardo Torres-Trejo
1,2,
Lucia López-Reyes
1,3, Ángel David Flores-Domínguez
4,
Ricardo Darío Peña-Moreno
1,5*, Jesús Francisco López-Olguín
61Postgraduate in Environmental Sciences, Institute of Sciences,
Benemérita Universidad Autónoma de Puebla, Puebla, México
2Department of Research in Agricultural Sciences, Institute of Sciences,
Benemérita Universidad Autónoma de Puebla, Puebla, México
3Research Center in Microbiological Sciences, Institute of Sciences,
Benemérita Universidad Autónoma de Puebla, Puebla, México
4El Colegio de Tlaxcala, Tlaxcala, México
5Center of Chemistry, Institute of Sciences, Benemérita Universidad
Autónoma de Puebla, Puebla, México
6Center Agroecology, Institute of Sciences, Benemérita Universidad
Autónoma de Puebla, Puebla, México
*Corresponding author: ricardo.pena@correo.buap.mx
Citation: López-García E.M., Torres-Trejo E., López-Reyes L., Flores-Domínguez Á.D., Peña-Moreno R.D., López-Olguín J.F. (2020): Estimation of soil erosion using USLE and GIS in the locality of Tzicatlacoyan, Puebla, México. Soil & Water Res., 15: 9−17.
Abstract: Deforestation and conversion of natural grasslands to agricultural land constitute two of the main threats to soil and water conservation, causing erosion, and likely, desertification. The objective of this study was to estimate the erosion of the soil in the locality of Tzicatlacoyan, applying the Universal Soil Loss Equation (USLE) through Geographic Information Systems (GIS). The results indicated that Tzicatlacoyan faces risk of soil erosion with an average annual rate of 117.18 t/ha∙year, due to natural factors and anthropogenic activities such as the use of agricul-tural land without appropriate conservation practices. Four classes of soil erosion risk were identified, according to the rate of erosion (A) in t/ha∙year: extreme risk (114 ≥ A ≤ 234.36), severe risk (59 ≥ A < 114), moderate risk (23 ≥ A < 59), and low risk (A < 23). Most of the area (180.96 km2, 64.83%) was characterised by the low risk of erosion, while a small part (11.64 km2, 4.17%) of the study area showed extreme risk. The results indicated that 13.33% of the territory of Tzicatlacoyan present values of soil loss exceeding tolerable. The assessment of the soil erosion using the USLE model and GIS might allow land users to make better decisions about the use and conservation of the soil and the ecosystem, adding scientific criteria to their traditional knowledge.
Keywords: erodibility; land degradation; soil loss prediction; water erosion
Supported by the National Science and Technology Council, CONACYT (Grant No. 601497).
There is an increase in the erosion rates in the highlands due to the lack of a sustainable land-use change process, in conjunction with natural factors such as rainfall and topography (Nachtergaele et
anthropogenic factors have significantly impacted the physical, chemical, and biological properties of the soil, leading to varied degradation levels (Aguirre et al. 2017). Lal (2015) indicated that 33% of the soils around the planet have been affected by processes of degradation (i.e., more than 4900 million ha). Soil erosion caused by water can produce environmental impacts such as disturbances in the regulation of the hydrological cycle, low yields in crop and livestock production, degradation of the plant cover, and loss of biodiversity, all of which favour the occurrence of natural disasters. In Mexico, 76% of the territory is affected to some degree by water erosion, 6.79% corresponds to the extreme level of erosion, 5.79% to severe, 26.37% to moderate, and 37.06% to low (Bolaños et al. 2016). The main causes of land degradation in Mexico, by degree of occurrence, are: urbanisation (57%), agricultural and livestock activities (35%), and loss of vegetation cover (7.4%) (Aguirre et al. 2017).
The Universal Soil Loss Equation (USLE) allows for the estimation of the annual loss of soil due to water erosion (Ali & Hagos 2016; Ostovari et al. 2016). For example, a series of models, based on factors of the USLE, were developed to estimate the soil erosion rates in the Sonora Desert. The vegeta-tion and management factor (C) and the support practice factor (P) were adapted as they provide information on a landscape scale in the areas that are vulnerable to erosion by human activities. These factors are detailed enough for adaptive manage-ment and restoration planning (Villareal et al. 2016). The objective of this study was to estimate the soil erosion by applying the USLE along with the Geographic Information Systems (GIS) in the locality of Tzicatlacoyan. Land degradation in forest areas within this locality, where a loss of biodiversity and a decrease in the quantity and quality of water available for crops were found (López-Teloxa et al. 2017).
MATERIAL AND METHODS
The study area has an extension of 279.11 km2, it is located in the Mixteca Poblana and Sierra del Tentzo, in the southern part of the state of Puebla, Mexico. The coordinates are between the parallels of 18°43' and 18°55' North latitude and the meridians of 97°55' and 98°10' West longitude, the altitude is between 1600 and 2600 m a.s.l. With an average annual precipitation of 714 mm, a minimum of 5 mm per month in the
dry season (November to April) and a maximum of 147 mm per month in the rainy season (May to Octo-ber). Regarding the temperature, the average annual temperature is 18.7°C, with a minimum of 16.7°C and a maximum of 30°C. The soil types are Rendzic Lep-tosol (50.5%), Calcaric LepLep-tosol (25%), Petric Calcisol (18.6%), Pellic Vertisol (2.5%), Haplic Phaeozem (2%), and Calcaric Regosol (1.4%), according to the World Reference Base for Soil Resources (IUSS Working Group WRB 2015). The vegetation type varies from oak forest, tropical deciduous forest, rosetophilous desert, cultivated land, scrub and grassland. It shares its northern border with the municipalities of Puebla, Cuautinchán, and Tecali de Herrera; its eastern border with the municipalities of Tecali de Herrera, Atoy-atempan, and Molcaxac; its southern border with the municipalities of Molcaxac, Zacapala, Huatlatlauca, San Juan Atzompa, and Huehuetlán Grande; and its western border with the municipalities of Huehuetlán Grande and Puebla (Figure 1).
Determination of the USLE factors. The Universal Soil Loss Equation (1) involves six basic parameters:
A = R × K × LS × C × P (1)
where:
A – average soil erosion per surface unit (t/ha∙year) R – rainfall and runoff erosivity factor (MJ∙mm/ha∙h∙year) K – soil erodibility factor (t∙ha∙h/ha∙MJ∙mm)
LS – slope length and slope steepness factor (–) C – vegetation cover, management, and culture
prac-tices factor (–)
P – mechanical practices factor (–)
R = 3.4880P – 0.000188P2 (2)
where:
P – average annual rainfall (mm)
Soil erodibility factor (K). Soil erodibility indicates the susceptibility of the soil loss due to the rainfall
and runoff, and is determined separately. Sixty-six sample points were chosen out of 6 different types of soil that were previously identified in the study area. The samples were physicochemically charac-terised in the laboratory to obtain the soil composi-tion based on the percentage of sand, clay and silt. With these parameters, it is possible to obtain the K values for each soil type by consulting the FAO database (Table 2).
[image:3.595.114.483.92.369.2] [image:3.595.63.290.533.730.2]Slope length and slope steepness factor (LS). To determine the LS factor, a Digital Elevation Model (DEM) was created from the level curves of the study area on a scale of 1 : 50 000 with contours Figure 1. Location map of the study area on the American continent, Mexico, centre of Puebla
Table 1. Mean annual rainfall and calculated rainfall ero-sivity (R) factor of the stations
Station name rainfall (mm)Mean annual (MJ∙mm/ha∙h)R factor
Huehuetlán el Grande 672.5 1257.76
Molcaxac 562.0 1062.77
Ahuatepec 597.1 1125.21
Balcón Diablo 724.7 1348.28
Teopantlán 739.4 1373.58
Tepexi de Rodríguez 733.8 1363.95
San Juan Coatzingo 590.7 1113.86
Xochitlán Todos Santos 555.3 1050.80
Tecamachalco 583.0 1100.18
Echeverría 913.8 1667.61
San Baltazar 714.9 1331.36
Africam Safari 500.0 951.36
Source: National Water Commission (CONAGUA 2018) for the period from 1951 to 2010
Table 2. Different soil types and their corresponding soil erodibility (K) factor
Soil type K factor
Petric Calcisol 0.026
Calcaric Leptosol 0.013
Rendzic Leptosol 0.007
Haplic Phaeozem 0.020
Calcaric Regosol 0.020
Pellic Vertisol 0.079
[image:3.595.306.530.629.731.2]and intervals of 20 m (INEGI 2016b). Afterwards, thematic maps of the environment were digitised using a digital display an ArcGIS (Ver. 10.5, 2016). The equation developed by McCool et al. (1989), Karamage et al (2016b), and Napoli et al. (2016) was used to build a map of the slopes (i.e., the S fac-tor) that was created from the DEM and classified into 5 slope classes with a cell size of 30 m, each of which was assigned an S factor value. The spatial distribution of the gradient of the slope was expressed as a percentage. The slope length (i.e., the L factor) was calculated using the DEM in ArcGIS 10.5 as the distance from the runoff point of the origin to the point where the slope steepness decreases sufficiently to cause the deposition.
The LS factor was obtained by multiplying the L and S factors, using the Raster Calculator from the Spatial Analyst Tools extension in ArcGIS 10.5 (Environment Systems Research Institute (ESRI) Inc., Redlands, USA).
Vegetation cover-management practice fac-tor (C). Factor C represents the average loss of the soil as a variable in time, related to the variables S, L, and R, each of which is weighted as a function of the erosion by the rain during the same period of time (Renard et al. 1997). To determine the C factor, the topographic map of the municipality of Tzicatlacoyan was elaborated upon using Landsat images (ETM satellite) from path 25 and row 47, which were processed through the False Colour Composition (FCC) of the bands. These satellite images were rectified to a 1 : 50 000 scale, allowing for the identification of the spatial distribution of the vegetation. Each land cover was assigned to its corresponding C factor. The classes are summarised in Table 5 according to the classification devised by Montes-León et al. (2011) and Ali and Hagos (2016). A map with a 30 m cell size grid was created from the allocation of the C factor values for each land-use in the area.
Support practice factor (P). The P factor expresses the effects of the conservation practices that reduce the amount and rate of the water runoff, and, conse-quently, reduce soil erosion. The P factor values were allocated over the land-use/land-cover map, according to the management practice (Ali & Hagos 2016) as shown in Table 3. After assigning the P factor values, the resulting map had a 100 m cell size grid.
Statistical analysis. The values obtained by ap-plying the USLE for the soil erosion and slope, were adjusted to a simple linear model to learn about the
dependence of the erosion to the slope of the terrain. The data analysis was performed using the statistical software Statgraphics Centurion XVI (Ver. 16.1.2.0, 2010). The level of significance was α = 0.05.
RESULTS AND DISCUSSION
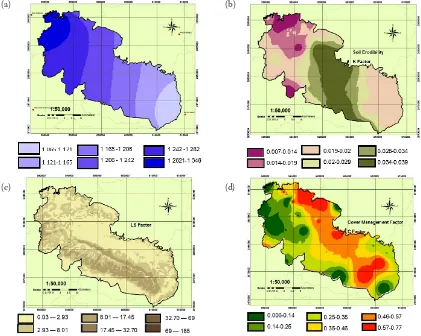
Rainfall and runoff erosivity factor (R) map. The average annual R factor value varied from 1065 to 1348 MJ∙mm/ha∙h, and the mean value was 1206.5 MJ∙mm/ha∙h year, which are higher than the values reported for semiarid areas, this is due to the intensity of the estimated mean annual rainfall (Montes-León 2011). Figure 2a shows the map of the R values; the lower values were found in the southeast of the study area (i.e., Atoyatempan); the middle values were found in the middle east zone (i.e., Sierra del Tentzo); where Sierra del Tentzo is found; the higher values were found at the north-west part. The distribution analysis for the R factor shows that it decreases as the topography in Sierra del Tentzo does too.
Vásquez-Méndez et al. (2010) found similar values for the soil erosion due to the runoff events that vary from 45 up to 1770 MJ∙mm/ha∙h∙year in the semiarid region of Santo Domingo Ranch in the municipality of Cadereyta, Queretaro, Mexico (2009), with an average around 390 MJ∙mm/ha∙h∙year; meanwhile, Napoli et al. (2016) reported a value of 922.6 to 2799.1 MJ∙mm/ha∙h∙year in the Chianti region of central Tuscany, Italy. Pham et al. (2018) reported values of the rainfall erosivity ranging from 1634 to 1732 MJ∙mm/ha∙h∙year on the A Sap basin, which suggests a high potential to produce runoff and ero-sion (Wei et al. 2007). The analysis of the R factor distribution on the study area shows that it decreases as the topography changes from the mountain areas to the lowlands of the tropical deciduous forest, rosetophilous desert and agricultural land.
Soil erodibility factor (K) map. Figure 2b shows the distribution of the K factor values. As can be ob-Table 3. Conservation practice (P) factor
Land use/land cover P factor
Cultivated land 0.8
Settlement 0.0
Oak forest 0.9
Rosetophilous desert 0.8
Scrub and grassland 0.8
[image:4.595.304.533.113.207.2]served, the range values for Pellic Vertisol soils were 0.019–0.029 t∙ha∙h/ha∙MJ∙mm; for Rendzic Leptosol soils, the range was 0.014–0.039 t∙ha∙h/ha∙MJ mm, on the other hand, Calcaric Leptosol soils, located in the Sierra of Tentzo, showed a range of the erod-ibility factor from 0.02 to 0.039 t∙ha∙h/ha∙MJ∙mm. The study area has higher K values, which suggest higher erosion rates. Ostovari et al. (2016) published the K factor values for the province of Simakan, Iran that range between 0.015 to 0.045 t∙ha∙h/ha∙MJ∙mm for Calcareous soils. Ali and Hagos (2016) reported erodibility values ranging from 0.09 to 0.02 t∙ha∙h/ ha∙MJ∙mm, these authors also indicated that higher K factor values were measured in Chromic Vertisols, Pellic Vertisols and Calcic Xerosols. Finally, Addis and Klik (2015) reported that the K factor for Lep-tosols, Cambisols, and Vertisols in Ethiopia ranged from 0.0217 to 0.033 t∙ha∙h/ha∙MJ∙mm, probably due to the forest cover that increases the organic matter content, which consequently lowers the K-factor in Ethiopia.
C factor and LS factor maps. According to the results of Panagos et al. (2015), the main parameters that contribute to soil erosion risk are the slope length factor (LS) and the vegetation cover and management factor (C). The study area is located at the highest altitude in the mountain range of Sierra del Tentzo, the DEM data for this region showed that the terrain is very steep and rugged.
[image:5.595.78.499.97.433.2]The LS factor ranged from 0.03 in the plain areas up to 185 in the mountainous area (Figure 2c). Within the study area, around 110.59 km2 showed a slope between 0–9%. The highest slope gradient was between 42–66% for an area of 14.11 km2 (Table 4), which represents an area with a high potential for erosionability (Ali & Hagos 2016). The C factor values varied between 0.005 and 0.75, as is shown in Table 5 and Figure 2d. The map showed the lowest values in the northeast region (0.006–0.25) which contains a forest, pastures and meadows. Most of the study area has values that range from 0.35 to 0.77, and contains agricultural land as has been reported previously (Shabani et
Figure 2. Rainfall-runoff erosivity factor R (a), soil erodibility factor K (b), slope length and slope steepness factor LS (c), and crop and cover management factor C (d) maps
(a)
(c)
(b)
al. 2014; González-Arqueros et al. 2018). These C factor values confirm that the study area has been highly impacted by human activities that has led to the degradation of the forests which have been transformed into agricultural land and induced grassland (Figure 3).
Soil erosion measurements and average annual soil loss map validation. A map for the rate of the
[image:6.595.65.533.113.213.2]soil loss was created by applying the general formula based on the previously calculated factors R, K, S, L, C, and P (Figure 4a). The soil loss estimated at Tzicatlacoyan varies from 0.00–234.36 t/ha∙year. According to the amount of soil loss (A), the area was divided into four ordinal classes: Extreme risk 114 ≥ A ≤ 234.36, severe risk 60 ≥ A < 114, moder-ate risk 23 ≥ A< 59, and low risk (A < 23), (Table 6). It was estimated that 64.83% of the area has a low erosion rate, from 0 to 23 t/ha∙year, being mainly in the flat areas. The estimated soil losses ranging from 23 to 59 t/ha year were found to be in 22.02% of the Table 4. Slope gradient classes, area in km2, area covered in percentage, slope gradient (S) factor
Class Slope gradient (%) Area (km2) Area covered (%) S factor
1 0–9 110.53 39.60 0.65
2 9–17 85.20 30.52 2.8
3 19–28 44.44 15.92 4.25
4 28–42 24.83 8.89 7.25
5 42–66 14.11 5.05 16
[image:6.595.64.291.261.359.2]Total 279.11
Table 5. Vegetation cover, management, and culture practi-ces (C) factor values
Land use/land cover C factor
Cultivated land 0.75
Settlement 0.005
Oak forest 0.10
Rosetophilous Desert 0.25
Scrub & Grassland 0.25
Tropical deciduous forest 0.50
Source: Montes-León et al. (2011), National Map of
Poten-tial Erosion
Table 6. Soil erosion rates (A) in the study area
A (t/ha∙year) Erosion Area (km2) Area (%)
A < 23 low 180.96 64.83
23 ≥ A< 59 moderate 61.46 22.02
60 ≥ A < 114 severe 25.58 9.16
114 ≥ A ≤ 234.36 extreme 11.64 4.17
[image:6.595.305.532.428.501.2] [image:6.595.62.383.524.776.2]study area, mainly corresponding to Sierra del Tentzo and the valleys. The highest values for the estimated soil loss range from 114 to 234 t/ha∙year was found in 4.17% of the study area and was marked as an ex-treme erosion risk. The soil loss results from human activity human activity, such as the cleaning of the agricultural land by fire and mining activities carried out on areas that are sensitive to erosion. A closer look at Figure 4a shows that the severe erosion rates are associated with a higher slope gradient factor, with coverage of the holm oak forest, deciduous forest, and rosetophilous desert. Areas of bare land or degraded grassland and shrubs are characterised by an extreme soil erosion rate, this correlates with the steepness of the slope that facilitates the transport of particles with a lower amount of energy and rain intensity, due to the topographic conditions and soil coverage. Im-mediate conservation measures are needed in such places. Figure 4b shows the correlation between the slope of the study area and the rate of erosion; it can be easily observed that the slope has a pronounced effect on the rate of the extreme soil erosion.
CONCLUSIONS
[image:7.595.91.493.96.398.2]This study evaluated the effectiveness of the USLE model using the GIS software, simulating the loss of soil to diagnose land-use management with planning purposes. In this regard, the application of the model identified the spatial distribution of the soil loss. Most of the study area was characterised by a low rate of soil erosion, while a small part (i.e., 37.22 km2) was identified as presenting soil erosion rates from severe to extreme. Around 13.33% of the territory of Tzicat-lacoyan was affected by soil loss values that exceed tolerable levels. In addition, 22.02% of the total area (i.e., 61.46 km2), was subject to moderate erosion with more than 41 t/ha∙year of annual losses. Severe to extreme erosion rates are associated with higher slope factor values, or with the degraded bare soil, pasture, or shrubs. The resulting map of the soil erosion is an important indicator of the sustainability for farmers and, above all, for the authorities that are responsible for the planning, management and protection of the territory. Even though farmers are familiar with the Figure 4. Spatial distribution map of the average annual soil loss (A, t/ha∙year) for the study area – the larger soil loss risk is located within the NPA Sierra del Tentzo, especially at the abrupt zones which show slopes with a steepness larger than 60% (a), and the estimation of the soil loss due to the slope steepness (b)
Soil erosion rate (A, t/ha∙year)
Soil loss = 27.01 +0.05373 slope2; P < 0.001 r = 0.9472; P < 0.001
r2 = 89.71%
Soil lo
ss (t/ha∙ye
ar)
Slope (%)
(a)
areas prone to erosion, they are not able to evaluate these phenomena from a quantitative point of view, therefore, implementation of management strate-gies is only based on their subjective assessments. On the other hand, quantitative assessments of the erosive processes constitute valuable support to local authorities for land-use management, as well as for proposals for public policies that might affect the area of study. It is necessary to prioritise hydric erosion controls in Tzicatlacoyan, in order to imple-ment measures that limit surface runoff by storing water in the soil through infiltration in the area of Sierra del Tentzo. The increase in soil moisture will support denser vegetation and prevent wind erosion.
Acknowledgements. The authors dedicate this work to
Edgardo Torres-Trejo, an invaluable collaborator, who died at the time this work was reviewed, as well as Eduardo Torres Ramírez for his valuable input on the preparation of this manuscript. The authors also thank the staff of the Map Library of the Benemérita Universidad Autónoma de Puebla for the technical assistance and collection of digital material (Department of Research in Agricultural Sciences, Institute of Science, BUAP). We would also like to acknowledge the comments of the anonymous reviewers, whose contributions have greatly improved the quality of this document.
References
Addis H.K., Klik A. (2015): Predicting the spatial distribu-tion of soil erodibility factor using USLE nomograph in an agricultural watershed, Ethiopia. International Soil and Water Conservation Research, 3: 282–290.
Aguirre Salado C.A., Miranda Aragón L., Pompa García M., Reyes Hernández H., Soubervielle-Montalvo C., Flores Cano J.A., Méndez Cortés H. (2017): Improving identifi-cation of areas for ecological restoration for conservation by integrating USLE and MCDA in a GIS-environment: A pilot study in a priority region Northern Mexico. ISPRS International Journal of Geo-Information, 6: 262. Ali S.A., Hagos H. (2016): Estimation of soil erosion using
USLE and GIS in Awassa Catchment, Rift Valley, Central Ethiopia. Geoderma Regional, 7: 159–166.
Becerra M.A. (1999): Runoff, Erosion and Conservation of Soils. Texcoco, Autonomous University Chapingo: 369–375. (in Spanish)
Bolaños González M.A., Paz Pellat F., Gaistardo C., Car-los O., Argumedo Espinoza J.A., Romero Benítez V.M., de la Cruz Cabrera J.C. (2016): Erosion map of Mexico soils and its posible implications for soil carbón pool. Terra Latinoamericana, 34: 271–288.
CONAGUA (2018): The Weather Stations REPDA Database; National Commission of Water: México City, México. Available at https://app.conagua.gob.mx/consultarepda. aspx
IUSS Working Group WRB (2015): World Reference Base for Soil Resources 2014. Update 2015. International Soil Classification System for Naming Soils and Creating Legends for Soil Maps. World Soil Resources Reports No. 106. Rome, FAO.
González-Arqueros M.L., Navarrete-Segueda A., Men-doza M.E. (2018): Modeling biophysical and anthropo-genic effects on soil erosion over the last 2000 years in central Mexico. Land Degradation & Development, 29: 1885–1895.
INEGI (2016a): The Hydrographic Network Database 1: 50 000.
2nd Ed., Aguascalientes, National Institute of Statistics and
Geography. Available at https://www.inegi.org.mx INEGI (2016b): The Topographic sets Database 1 : 50 000.
Aguascalientes, National Institute of Statistics and Ge-ography. Available at https://www.inegi.org.mx
INEGI (2016c): The Vector Data Set for Land Use and Vegetation. Scale 1 : 50 000. V Serie (Union Layer). Aguas-calientes, National Institute of Statistics and Geography. Available at https://www.inegi.org.mx
Karamage F., Zhang C., Ndayisaba F., Shao H., Kayiranga A., Fang, X., Nahayo L., Muhire Nyesheja E., Tian G. (2016a): Extent of cropland and related soil erosion risk in Rwanda. Sustainability, 8: 609.
Karamage F., Zhang C., Kayiranga A., Shao H., Fang X., Ndayisaba F., Nahayo L., Mupenzi C., Tian G. (2016b): USLE-based assessment of soil erosion by water in the Nyabarongo River Catchment, Rwanda. International Journal of Environmental Research and Public Health, 13: 835.
Lal R. (2015): Restoring soil quality to mitigate soil degrada-tion. Sustainability, 7: 5875–5895.
López-Teloxa L.C., Cruz Montalvo A., Tamaríz Flores J.V., Pérez Avilés R., Torres Ramírez E., Castelán Vega R. (2017): Short-temporal variation of soil organic carbon in different land use systems in the Ramsar site 2027 ‘Presa Manuel Ávila Camacho’ Puebla. Journal of Earth System Science, 126: 95.
McCool D.K., Foster G.R., Mutchler C.K., Meyer L.D. (1989): Revised slope length factor for the Universal Soil Loss Equation. Transactions of the ASAE, 32: 1571–1576. Montes-León M.A.L., Uribe Alcántara E.M., García Celis E.
(2011): National Map of Potential Erosion. Tecnología y Ciencias del Agua, 2: 5–17.
Infor-mation Database for Land Degradation Assessment at Global Level. Land Degradation Assessment in Drylands, Volume 17, Technical Report, Rome, FAO.
Napoli M., Cecchi S., Orlandini S., Mugnai G., Zanchi C.A. (2016): Simulation of field-measured soil loss in Mediter-ranean hilly areas (Chianti, Italy) with RUSLE. Catena, 145: 246–256.
Ostovari Y., Ghorbani-Dashtaki S., Bahrami H.A., Na-deri M., Dematte J.A.M., Kerry R. (2016): Modification of the USLE K factor for soil erodibility assessment on calcareous soils in Iran. Geomorphology, 273: 385–395. Panagos P., Borrelli P., Poesen J., Ballabio C., Lugato E.,
Meusburger K., Montanarella L., Alewell C. (2015): The new assessment of soil loss by water erosion in Europe. Environmental Science & Policy, 54: 438–447.
Pham T.G., Degener J., Kappas M. (2018): Integrated uni-versal soil loss equation (USLE) and Geographical In-formation System (GIS) for soil erosion estimation in A Sap basin: Central Vietnam. International Soil and Water Conservation Research, 6: 99–110.
Renard K.G., Foster G.R., Weesies G.A., McCool D.K., Yoder D.C. (1997): Predicting Soil Loss by Water: A Guide to Conservation Planning with the Revised Universal Soil
Loss Equation (RUSLE). Agriculture Handbook No. 703, Washington, D.C., USDA.
Shabani F., Kumar L., Esmaeili A. (2014): Improvement to the prediction of the USLE K factor. Geomorphology, 204: 229–234.
Vásquez-Méndez R., Ventura Ramos E., Oleschko K., Hernández Sandoval L., Parrot J.F., Nearing M.A. (2010): Soil erosion and runoff in different vegetation patches from semiarid Central Mexico. Catena, 80: 162–169. Villarreal M.L., Webb R.H., Norman L.M., Psillas J.L.,
Rosenberg A.S., Carmichael S., Sparks P.E. (2016): Mod-eling landscape-scale erosion potential related to vehicle disturbances along the USA–Mexico border. Land Deg-radation & Development, 27: 1106–1121.
Wei W., Chen L., Fu B., Huang Z., Wu D., Gui L. (2007): The effect of land uses and rainfall regimes on runoff and soil erosion in the semi-arid loess hilly area, China. Journal of Hydrology, 335: 247–258.