Influence of summer management practices and date
of harvesting on organic acids concentration and sugar
concentration in grapes of
Vitis vinifera
L., cv. Riesling
Lubomír Lampíř*, Jiří Žaloudek
Department of Horticulture, Faculty of Agrobiology, Food and Natural Resources,
Czech University of Life Sciences in Prague, Prague, Czech Republic
*Corresponding author: lampir.lubomir@seznam.cz
Abstract
Lampíř L., Žaloudek J. (2018): Influence of summer management practices and date of harvesting on organic acids concentration and sugar concentration in grapes of Vitis vinifera L., cv. Riesling. Hort. Sci. (Prague), 45: 211–218. The impact of summer canopy management was investigated in Vitis vinifera L.,cv. Riesling. Sugar and organic acid concentrations were measured for the six defoliation treatments. Titratable acidity (TA) was measured twice before harvest and once at the date of harvest. The same measurements were done twice during wine ageing. The young wine was measured for concentrations of malic, tartaric and volatile acids. Treatments with appropriate defoliation, where shortened lateral shoots (up to two leaves) were retained, supported the process of wine grape ripening to the greatest extend in the cool climate of the Czech Republic, while treatments with almost no defoliation yielded the worst results. The TA decreased during fruit ripening after veraison and continued to decrease during wine maturation. The tendency of decreasing with time was shown for the malic to tartaric acid ratio as well. Concentrations of volatile acids were sufficiently low in each of the treatments.
Keywords: wine production; defoliation; titratable acidity; malic acid; tartaric acid; volatile acidity
Titratable acidity. Acidity is an important com-ponent of wine taste, its balance and complexity; it also defines chemical stability and pH (Silva et al. 2015). High titratable acidity (TA) and low pH in grape must is responsible for acid hydrolysis of non-volatile flavour precursors from grape skins, which is essential for the development of a complex flavour profile during vinification and subsequent ageing of wine (Winterhalter et al. 1990). Low pH in must or wine also prevents or delays phenol-ic oxidation by maintaining phenolphenol-ic compounds in their non-ionised state, rendering them less susceptible to oxidation (Volschenk et al. 2006). Vitis vinifera is a plant species with very specific composition of acids. It is the only one commercial fruit species with notable amounts of the tartaric acid (Ulrich 1970), which represents the most im-portant component within the acid pool of leaves and berries of V. vinifera in terms of quantity and,
tar-taric acid is often found at higher concentrations than malic acid (Volschenk et al. 2006). The later the harvest starts, the lower the concentration of malic acid, which is being practiced in colder areas in order to achieve the desired fruit taste of wine (Clarke, Rand 2001). During fermentation, both of these acids undergo microbial breakdown, which gradually reduces their concentration. Malate can be biologically decomposed in a process referred to as malolactic fermentation, unlike tartrate, which is not metabolised during the process; in young wines, tartrate precipitates in the form of wine crystals (Volschenk et al. 2006). Volatile acids are another group of acids present in wine. This par-ticularly applies to acetic, butyric, formic and pro-pionic acids; their concentrations are monitored in wine since they can spoil wine quality. According to the legislation, the maximum of volatile acids in white wine is 1.1 g/l(Balík 2004).
Sugar concentration. Glucose and fructose are
the sugars present in grapes and juices to the great-est extent (Eyduran et al. 2015). Soluble sugars begin to accumulate in grape berries at veraison (Ruffner 1982). Accumulation of hexose sugars in flesh and skin of berries and of potassium and phenolics in skin is characteristic for the ripening of grape berries (Coombe 1987; Topalovic, Milukovic-Petkovs-ek 2010). Sugar is transferred into berries via phlo-em in the form of sucrose which is then converted into fructose and glucose at almost equal amounts through the activity of invertase, while small amounts of sucrose remain present in the berries too. A small amount of glucose is also produced by utilization of malate, which is referred to gluconeogenesis (Sweet-man et al. 2009; Amiani et al. 2016).
Influence of acids and sugars on wine quality.
Acid concentration is an important quality factor of wine fruit. High or extremely low acid levels negatively affect the suitability of wine-grapes for vinification. Excessive tartness is usually correlated with low sugar concentrations while low acidity can be accompanied either by low or high sugar con-centrations; whatever the case, unbalanced and flat wines are produced (Ruffner 1982). Exogenous factors – notably temperature – are responsible for the acid content in ripening grapes; continu-ously warm conditions are enhancing malic acid consumption during ripening period, which results in lower acidity at maturity. Berries with minimum levels of malic acid can be considered over-ripe or senescent (Robinson, Harding 2006).
Canopy management and its effect on wine yield and quality. Partial defoliation of vine trees
is advisable to improve aeration of the canopy and increase light penetration. This is beneficial for dis-ease control and accumulation of colouring com-pounds in berries. Although leaf surface area posi-tively correlates with sugar concentration in grapes, partial defoliation can be carried out without affect-ing the entire amount and quality of the yield (Feng et al. 2015). Kliewer (1970) observed that around 8–10 cm2 of leaf surface area per gram of fruit is
required to get crops without decreasing the sugar concentration in the vine fruit. Hunter, Visser (1988) proved that remaining leaves of partially de-foliated vines increase their proportional photosyn-thetic activity, chiefly in their basal and middle ar-eas, thus compensating for the loss of leaves; partial defoliation can optimise the contribution of photo-synthetates and even increase the yield. The timing and extent of defoliation are crucial factors for the yield and quality of wines. Defoliation made shortly after postanthesis or to a rather large extent signifi-cantly restrains both the yield and the sugar concen-tration of grapes while keeping TA and pH of fruits relatively intact; the later the postanthesis vines are defoliated, the lower the impact on yield and sugar concentration (Kliewer 1970). Early cluster zone defoliation – during bloom or shortly after – lowers fruit set and causes fruitlet abortion (Vasconcelos et al. 2009; Sabbatini, Howell 2010), but, in some cases, it can practised to enhance quality of wine composition (Tardáguila et al. 2008; Intrigli- olo et al. 2014; Moreno et al. 2017). Defoliation plays an important role in the accumulation of sugar and aromatic compounds in berries; to some extent, canopy management can be used to regulate micro-climate to produce wine with the desired composi-tion (Marais et al. 1999; Intrigliolo et al. 2014).
MATERIAL AND METHODS
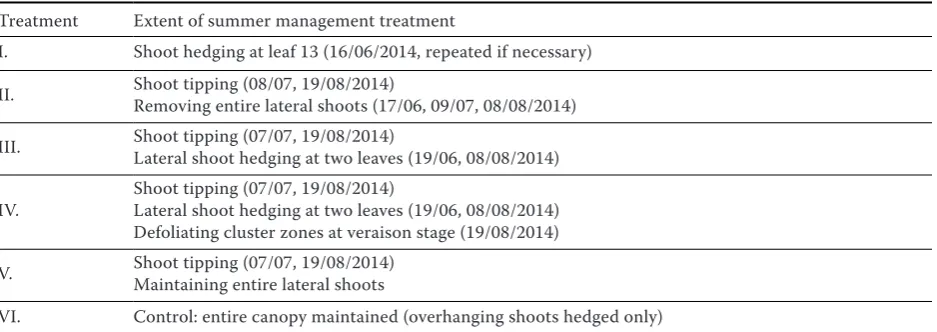
The 27-year-old vineyard is located in Mělník Chloumek. It is situated on a southern slope, 225 m above the sea level, on basic clay-sand brown soils, with the long-term average temperature of 8.7°C, sum of active temperatures of 2,745°C and long-term average precipitation of 547 mm (Kraus et al. 2005). The culture was grown using a conventional system with pesticides and artificial fertilisers. The Riesling cl. 239 Gm vines were trained using the Rhine-Hessian training system – trees had two lat-eral one-year-old shoots with 8–10 spurs (Kraus 2010). The agrotechnical maintenance was carried out as suggested by Kraus (2010). Six treatments were carried out and differed in terms of intensity of summer defoliation (Table 1). Each treatment con-sisted of five vines. The treatments were repeated four times at the same time and in the same place.
Sampling prior to the harvest and on the har-vest date. On 1, 8 and 17 Oct 2014, samples of all
treatments were collected to detect changes in TA in the must of the grapes during ripening and after final harvest. Several berries (small amount) were taken from the vine on each treatment.
At the day of harvest, harvested grapes were pro-cessed into wine must. Subsequently, sugar concen-tration and TA were measured in the must followed by filling the must into into 50 l glass demijohns. 12 demijohns of samples (six treatments, two rep-etitions) were left to yeast and generate sediment for 2 days in darkness at around 10°C. On 19 Oct, the wine was racked off the sediment for the first time and the samples were inoculated by wine yeast Saccharomyces cerevisiae, Lalvin R – HST strain, with the peak of fermentation in three days and end in 10 days. The must was let to generate sediment
once again. The second action of racking wine off sediment was finished on 4 Nov. The wine was now treated with 4 g potassium metabisulphite per 1 hl, bottled, and put into darkness at around 10°C. The samples from 4 Nov 2014 and 12 Jan 2015 were analysed on 12 Nov 2014 and on 19 Jan 2015, re-spectively.
Sugar concentration determination. A
hydro-meter is a measuring tool made from glass and widely used by wine producers and quality control-lers to estimate sugar content in wine on the basis of Archimedesʻ principle and specific gravity of liquids. All values were measured by a calibrated hydrome-ter where 1°NM grade (a grade of standardized glass hydrometer, Czech measurement method) equates to 1 kg/hl of sugar concentration in the must at 15°C (1°NM = 1 kg/hl of sugar concenteration). In case that temperature differs from the calibration of aerometer, appropriate corrections are applied. Internationally used Oechsle method measures a difference between the densities of water and must in g/l; converting °NM into °Oe precisely is not possible as, unlike °NM, the German °Oe measure-ment does not incorporate „non-sugars“. Interpre-tation tables and explanations of various measur-ing methods can be found in books for Czech wine producers, e.g. in Malík (2003).
[image:3.595.65.534.589.755.2]On 17 Oct 2014 (the day of harvest), must was filled into a graduated cylinder up to the brim and must temperature was measured. The hydrometer was dipped slowly into the must, and left floating freely while being prevented from contact with the sides of the cylinder. Care was also taken that the upper part of the tool did not dip deeper into liquid than nec-essary, as any wetting and therefore gaining weight, Table 1. Experimental summer management treatments in Riesling vines, carried out in 2014 in Mělník-Chloumek, Czech Republic
Treatment Extent of summer management treatment
I. Shoot hedging at leaf 13 (16/06/2014, repeated if necessary)
II. Shoot tipping (08/07, 19/08/2014) Removing entire lateral shoots (17/06, 09/07, 08/08/2014)
III. Shoot tipping (07/07, 19/08/2014)Lateral shoot hedging at two leaves (19/06, 08/08/2014)
IV. Shoot tipping (07/07, 19/08/2014)Lateral shoot hedging at two leaves (19/06, 08/08/2014) Defoliating cluster zones at veraison stage (19/08/2014)
V. Shoot tipping (07/07, 19/08/2014)Maintaining entire lateral shoots
would bias the results. The values were taken from the scale hitting the lower meniscus of the liquid and cor-rected for the temperature of 15°C.
Titratable acidity detection. The amount of
TA (volatile and non volatile acids, titratable acid salts) was determined in fresh must before final harvest and in time of harvest (three times – 1, 8 and 17 Oct 2014) and, subsequently, in wine during ageing (two times – 4 Nov 2014 and 12 Jan 2015). Concentrations of both malic and tartaric acids and volatile acidity were determined as well. All the analyses were carried out according to the EEC Regulation 2676, 2676/90 (1990). Czech accredited laboratory LIPERA s.r.o. carried out the analyses.
The Statgraphics application was used for statis-tical evaluation of data.
RESULTS AND DISCUSSION
Sugar concentration of harvested grapes
In addition to the amount of foliage left, exposure to the sun was an important factor for the accu-mulation of sugar (Table 2). The highest sugar con-centration was detected on treatment IV involving defoliation in the cluster zone, while the second highest one was observed on treatment III. An unanticipated, higher amount of the sugar content was detected on treatment VI, while treatment V showed the lowest sugar content among all of the treatments (Table 2). Symptoms of fungal diseases were observed on treatments V and VI.
The detection of highest sugar accumulation on treatment IV, one that involves fruit zone defolia-tion, corresponds with the findings of Tardáguila et al. (2008), Intrigliolo et al. (2014), Baiano et al. (2015), Moreno et al. (2017), and many others. Par-tial defoliation of shoots enables exposure of berries to enrich them with photosyntethates thanks to the enhanced photosynthetic activity of the remainder of leaves (Hunter, Visser 1988), which corresponds
with the best results obtained on treatments III and
IV, where the lateral shoots were not removed, but just
hedged at leaf 2. Hirano et al. (1994) proved that lat-eral foliage fastens the photosynthetic rate compared with primary foliage, which results in increased ac-cumulation of sugar. In addition, Vasconcelos and Castagnoli (2000) confirmed that lateral shoots accelerate fruit ripening and suggest that this tech-nique can improve fruit composition in short-season regions. Symptoms of fungal diseases were observed on treatments V and VI where all lateral shoots were retained; it even seems that fungal diseases influ-enced sugar concentration in berries on treatment
VI, where the amount of sugar almost reached values
of treatments III and IV. Canopy without defoliation causes excessive shading, poor air circulation and high humidity and hampers efforts at disease control (Baiano et al. 2015), which results in an incidence of disease and unbalanced, rather vegetative growth (English et al. 1989). Shaded canopy can be associ-ated with lower sugar concentration in grapes, which is also a cultivar-specific property (Guan et al. 2017). We suggest that a fungal disease could have been re-sponsible for the higher sugar concentration on treat-ment VI – the treattreat-ment could have been infected by Botrytis cinerea, which can, upon certain conditions, result in higher sugar concentration in the berries, which is a trait used in commercial production of bot-rytized wines (Sarrazin et al. 2007).
Acidity in berries
TA was on a constant decrease during the ripen-ing of grapes and wine ageripen-ing. However, only treat-ments I and VI exhibited the difference showing the decrease between values measured on 1 and 8 Oct. In all of the treatments, a decrease was detect-ed between the analyses of 8 and 17 Oct (Table 3). The highest TA was detected on treatments VI and
[image:4.595.62.531.677.719.2]V, while the lowest was seen on treatments IV and
Table 2. Soluble solids concentrations in must from Riesling grapes on six summer management treatments at harvest date (17 Oct 2014)
Experimental treatments HedI. Tip, LaRII. Tip, LaHIII. Tip, LaH, DefIV. TipV. ControlVI.
Sugar concentration (°NM) 16.5ab 16.0a 18.3c 18.5c 15.5a 17.5bc
Hed – shoot hedging at leaf 13; Tip – shoot tipping; LaR – removing entire lateral shoots; LaH – lateral shoot hedging at two leaves; Def – defoliating cluster zones at veraison stage; Control – maintaining entire canopy (hedging overhanging
III. The TA of particular treatments on the day of
harvest was negatively associated with sugar con-tents (Tables 2 and 3), except for the treatment VI. Treatment IV with defoliation in the cluster zone (19 Aug) showed the highest sugar concentration and the lowest TA. Smart et al. (1985) and Baiano et al. (2015) found association between defoliation in the fruit zone, higher sugar concentration, and lower TA in mature grapes. However, Intrigliolo et al. (2014) and Moreno et al. (2017) did not de-tect clear TA increases in shaded canopies in Spain, which can be explained by higher consumption of
malate due to higher temperatures in warm areas (Robinson, Harding 2006).
Acidity in young wine
In young wine, the amounts of acids continued to decrease (Table 4) but no change occurred in their sequence according to treatments compared with previous analysis. There were decreases between measurements in young wine on 12 Nov 2014, and on 19 Jan 2015 (Table 5). Tartaric acid took the big-Table 3. Titratable acidity in must at three dates during ripening of grapes, on six summer management treatments of Riesling vines
Experimental treat-ments
Titratable acidity (g/l)
1 Oct 2014 8 Oct 2014 17 Oct 2014 Mean value
I. Hed 10.5bc 10.2bc 9.4c 10.0c
II. Tip, LaR 10.9c 10.7c 10.0d 10.5d
III. Tip, LaH 10.2ab 9.9ab 8.9b 9.7b
IV. Tip, LaH, Def 9.6a 9.5a 8.4a 9.2a
V. Tip 11.9d 11.4d 10.5e 11.3e
VI. Control 12.9e 12.3e 11.5f 12.2f
for explanations see Table 2
Table 4. Titratable acidity (TA) means in ripening grapes and in ageing wines of cv. Riesling, at different dates of must and wine analysis
TA ripening (g/l)
Must analysis date
TA ageing (g/l)
Wine analysis date
1 Oct 2014 8 Oct 2014 17 Oct 2014 12 Nov 2014 19 Jan 2015
11.0e 10.6d 9.8c 7.6b 6.5a
TA ripening – means of all treatments, measured at the dates during ripening of grapes; TA ageing – TA means of all treatments, measured during wine ageing; letters following the figures in the columns indicate significant differences at
[image:5.595.63.530.126.250.2]p ˂ 0.01 by Tukey HSD test
Table 5. Wine titratable acidity during wine ageing, associated to various summer man. treatmentsof Riesling vines
Experimental treat-ments
Titratable acidity (g/l)
12 Nov 2014 19 Jan 2015 Mean value
I. Hed 7.5bc 6.3bc 6.9c
II. Tip, LaR 7.8cd 6.7c 7.2d
III. Tip, LaH 7.0ab 6.1b 6.5b
IV. Tip, LaH, Def 6.6a 5.4a 6.0a
V. Tip 8.5e 7.2d 7.8e
VI. Control 8.4de 7.4d 7.9e
[image:5.595.65.532.604.742.2]gest part in the acidity pool in all of the treatments. Its concentration was around 4.5 g/l of wine on 12 Nov 2014, and decreased to 3.5–4 on 19 Jan 2015, while malic acid was around 3.2 g/l (2.8–3.8 g/l), decreas-ing to 2.6–3.3 g/l (Table 6). The concentration of vola-tile acids was around 0.75 g/l (0.36–0.88 g/l) and de-creased to 0.3–0.75 g/l (Table 7), which fits the legal limits for these acids in wine (1.1 g/l) (Balík 2004).
On the first measurement (12 Nov 2014), the initial amounts of tartaric acid were higher than amounts of malic acid, but the ratios between the two varied between treatments. The highest amounts of tar-taric acid and subsequently the lowest amounts of malic acid were detected on treatment II and IV. A relationship was found between amounts of tartaric and malic acid: higher peaks of tartaric acid were bonded with low peaks of malic acid on particular treatments. The second measurement (19 Jan 2015) showed that the higher ratios between the two acids decreased (Table 6). A higher rate of decomposition was seen for tartaric acid compared with malic acid; the higher the peaks, the faster the process. It seems that young wine tends to buffer the difference be-tween amounts of tartaric and malic acids, lowering the ratio between the two. As a result, the tartaric acid to malic acid ratio decreased on the second measuring in all of the cases except for treatment III, where it was the tightest (Table 6). These findings correspond with those of Moreno et al. (2017) who detected a faster rate of decomposition of tartrate in wine than was seen for malate, compared with must. While malate decomposes during malolactic fermentation, which is a controlled process in wine production, used rather in red wines (Izquierdo-Cañasa et al. 2016), tartrate naturally precipitates as wine crystals (Volschenk et al. 2006), which
can explain the different rates of decomposition in young wine observed for these two acids.
CONCLUSION
Canopy management treatments in vineyards influ-ence organic acid and sugar concentrations in wine. The highest acid concentrations and occurring symp-toms of fungal diseases were detected in treatments with most of the canopy left intact. The most desir-able results were achieved in treatments involving shoot tipping and retaining lateral shoots shortened up to two leaves, along with eventual partial defolia-tion in the cluster zone at veraison stage (treatments
III, IV), wherever it was the case. Shortened lateral
shoots positively influenced sugar concentration in berries, and exposure to sunlight lowered TA and malic acid concentration. As in the cold climate of the Czech Republic, canopy management aims at max-imising sugar accumulation and lower TA in berries during their ripening, treatments III and IV can be recommended for Czech wine growers due to giv-ing the best results for these variables. TA decreased during vinification and continued to decrease during wine ageing, while the tartaric to malic acid ratio in young wine decreased with time.
References
Baiano A., De Gianni A., Previtali M.A., Del Nobile M.A., Novello V., de Palma L. (2015): Effects of defoliation on
quality attributes of Nero di Troia (Vitis vinifera L.) grape
and wine. Food Research International, 75: 260–269. Balík J (2004): Vinařství – návody do laboratorních cvičení.
[image:6.595.65.533.131.267.2]Brno, Mendel University in Brno.
Table 6. Tartaric and malic acid concentrations and tartaric to malic acid ratios in ageing wines of cv. Riesling, on various summer management treatments
Experimental treatments
Tartaric acid (g/l) Malic acid (g/l) Tartaric to malic acid ratio
12 Nov 2014 19 Jan 2015 12 Nov 2014 19 Jan 2015 12 Nov 2014 19 Jan 2015
I. Hed 4.4a 3.8a 3.1a 2.7a 1.44 1.39
II. Tip, LaR 5.3b 4.2b 2.8a 2.7a 1.89 1.58
III. Tip, LaH 4.0a 3.7a 3.6b 3.0ab 1.11 1.23
IV. Tip, LaH, Def 4.8ab 3.8a 2.8a 2.6a 1.75 1.47
V. Tip 4.4a 3.6a 3.8b 3.2b 1.17 1.11
VI. Control 4.3a 3.6a 3.5b 3.3b 1.23 1.08
Clarke R.O., Rand M. (2001): The Encyclopedia of Grapes. Websters International Publishers.
Coombe B.G. (1987): Distribution of solutes within the devel-oping grape berry in relation to its morphology. American Journal of Enology and Viticulture, 38: 120–127
EEC Regulation 2676 (1990): Community methods for the analysis of wine. Official Journal of European Communi-ties, L272: 1–192.
English J.T., Thomas C.S., Marois J.J., Gubler W.D. (1989): Microclimates of grapevine canopies associated with leaf removal and control of Botrytis bunch rot. Phytopathol-ogy, 79: 395–401.
Eyduran S.P., Akin M., Ercisli S., Eyduran E., Maghradze D. (2015): Sugars, organic acids, and phenolic compounds
of ancient grape cultivars (Vitis vinifera L.) from Igdir
province of Eastern Turkey. Biological Research, 48:1–8. Famiani F., Farinelli D., Frioni T., Palliotti A., Battistelli A.,
Moscatello S., Walker R.P. (2016): Malate as substrate for catabolism and gluconeogenesis during ripening in the pericarp of different grape cultivars. Biologia Plantarum, 60: 155–162
Feng H., Yuan F., Skinkis P., Qian M.C. (2015): Influence of cluster zone leaf removal on Pinot noir grape chemical and volatile composition. Food Chemistry, 173: 414–423. Guan L., Wu B., Hilbert G., Li S., Gomès E, Delrot S., Dai Z.
(2017): Cluster shading modifies amino acids in grape (Vitis
vinifera L.) berries in a genotype- and tissue-dependent
manner. Food Research International, 98: 2–9.
Hale C.R. (1962): Synthesis of Organic Acids in the Fruit of the Grape. Nature, 195: 917–918.
Hirano K., Nodal M., Hasegawa S., Okamoto G. (1994): Con-tribution of Lateral and Primary Leaves to the Development and Quality of ‚Kyoho‘ Grape Berry. Journal of the Japanese Society for Horticultural Science, 63: 515–521.
Hunter J.J., Visser J.H. (1988): Distribution of
14C-photo-synthetate in the shoot of Vitis vinifera L. cv Cabernet
Sauvignon II. The effect of partial defoliation. South African Journal of Enology and Viticulture, 9: 10–15
Intrigliolo D.S., Llacer E., Revert J., Estevec M.D., Climent M.D., Palaub D., Gómez I. (2014): Early defoliation reduces cluster compactness and improves grape composition in
Mandó, an autochthonous cultivar of Vitis vinifera from
southeastern Spain. Scientia Horticulturae, 167: 71–75. Izquierdo-Cañasa P.M., Mena-Morales A., García-Romeroa E.
(2016): Malolactic fermentation before or during wine aging in barrels. Food Science and Technology, 66: 468–474. Johnson L.A., Carroll D.E. (1973): Organic acid contents
of Scuppernong grapes during ripening. Journal of Food Sciences, 38: 21–24.
Kliewer W.M. (1966): Sugars and Organic Acids of Vitis
vinifera. Plant Physiology, 41: 923–931.
Kliewer W.M. (1970): Effect of time and severity of defoliation on growth and composition of ‚thompson seedless‘ grapes. American Journal of Enology and Viticulture, 21: 37–47. Kraus V., Foffová Z., Vurm V. (2005): Nová encyklopedie
českého a moravského vína 1. Prague, Praga Mystica. Kraus V. (2010): Rukověť vinaře. Prague, Nakladatelství Brázda. Malík F. (2003): Ze života vína. Filip Trend Publishing. Marais J., Hunter J.J., Haasbroek P.D. (1999): Effect of canopy
microclimate, season and region on Sauvignon blanc grape composition and wine quality. South African Journal of Enology and Viticulture, 20: 19–30.
Moreno D., Valdés E., Uriarte D., Gamero E., Talaverano I., Vilanova M. (2017): Early leaf removal applied in warm climatic conditions: Impact on Tempranillo wine volatiles. Food Research International, 98: 50–58.
Robinson J., Harding J. (2006): The Oxford Companion to Wine (3rd Ed.). Oxford University Press.
Ruffner H.P. (1982): Metabolism of tartaric and malic acids in Vitis: A review – Part A. Vitis, 21: 247–259
Sabbatini P., Howell G.S (2010): Effects of early defoliation on yield, fruit composition, and harvest season cluster rot complex of grapevines. HortScience, 45: 1804–1808. Sarrazin E., Dubourdieu D., Darriet P. (2007):
Characteriza-tion of key-aroma compounds of botrytized wines, influ-ence of grape botrytization. Food Chemistry, 103: 536–545. Silva F.L.N., Schmidt E.M., Messias C.L., Eberlin M.N.,
Frankland H., Sawaya A.C. (2015):
Quantitation of organic acids in wine and grapes by direct infusion electrospray ionization mass spectrometry. Ana-lytical Methods, 7: 53–62
Smart R.E., Robinson J.B., Due G.R., Brien C.J. (1985): Canopy microclimate modification for the cultivar Shiraz II. Effect on must and wine composition. Vitis, 24: 119–128. Sweetman C., Deluc L.G., Cramer G.R., Ford C.M., Soole
K.L.(2009): Regulation of malate metabolism in grape berry and other developing fruits. Phytochemistry, 70: 1329–1344.
Tardáguila J., Diago M.P., de Toda F.M., Poni S., Vilanova M. (2008): Effects of timing of leaf removal on yield, berry matu-rity, wine composition and sensory properties of cv. Grenache grown under non irrigated conditions. Journal International des Sciences de la Vigne et du Vin, 42:221–229.
Topalovic A., Milukovic-Petkovsek M. (2010): Changes in sugars, organic acids and phenolics of grape berries of cul-tivar Cardinal during ripening. Journal of Food Agriculture and Environment, 8: 223–227.
Ulrich R. (1970): Organic acids. In: Hulme A.C. (Ed.): The Biochemistry of Fruits and their Products, 1: 89–118. Vasconcelos M.C., Castagnoli S. (2000): Leaf canopy
Vasconcelos M.C., Greven M., Winefield C.S., Trought
M.C.T., Raw V. (2009): The flowering process of Vitis
vinifera: A Review. American Journal of Enology and
Viticulture, 60: 411–434.
Volschenk H., van Vuuren H.J.J., Viljoen-Bloom M. (2006): Malic Acid in Wine: Origin, Function and Metabolism
during Vinification. South African Journal of Enology and Viticulture, 27: 123–136
Winterhalter P., Sefton M.A., Williams P.J. (1990): Volatile C13 norisoprenoid compounds in Riesling wine are gener-ated from multiple precursors. Journal of Agricultural and Food Chemistry, 41: 277–283.