JOURNAL OF FOREST SCIENCE, 48, 2002 (9): 408–414
Along with the use of man power and gravitation horse skidding of timber was one of traditional methods of timber transport in the past centuries. The predominant logging method – short-length method – was accommo-dated to the practice and worked with shorter and lighter burdens as compared with the prevailing whole-stem log-ging method used in several last decades and related to the employment of machines with considerably greater pulling force.
The present role of draught horse in the forestry of the Czech Republic and elsewhere in Europe considerably differs from the former one. Now, horses can be used only at intermediate felling and with gradual transition to the near-natural management the utilization of horse power has also been considered for skidding in selection forests.
The only way of timber transport by horse in our condi-tions is its dragging across the forest soil surface. Proper-ties of ground surface and dragged stem are considerably variable and significantly affect – together with other factors – the required magnitude of drawing force. An analysis of force proportions at dragging timber (stem,
log) we arrive at a finding that drawing force F that is
required for initiation and subsequent maintenance of stem
in the dragging motion depends not only on load weight
G and on the character of contact friction surfaces, i.e.
terrain surface and stem surface, but also on the stem butt end shape, quality of debranching, dragging method, slope inclination, movement direction, etc.
Questions concerning the type of slopes on which one can safely do horse skidding were dealt with by
a number of Czech and foreign authors. RODRIGUEZ and
MAYER (1986) mention the slope inclination suitable for
animal skidding up to 30% discussing in greater detail also the rate of skidding and time required for individual
operations. HEINRICH (1987) presents maximum slope
inclinations for the employment of individual means of skidding.
SIMANOV (1993, unpublished) brings a simplified divi-sion of slope inclination boundaries for timber stability to spontaneous lengthwise displacement of stem and log as follows:
Dry weather 50–60%
Wet weather 35–45%
Snow 20–25%
Ice 10%.
Critical slope inclination for side movement of logs by rolling is claimed to be 10%.
The paper was prepared within the Research project of the Faculty of Forestry and Wood Technology, Mendel University of Agri-culture and Forestry No. MSM 434100005 Sustainable Forest Management from Concept to Implementation.
A contribution to the detection of sliding resistance and calculation
of critical slope inclination at timber dragging by horse
S. N
AVRÁTIL1, A. S
KOUPÝ21
ALLWOOD, a.s., Zlín, Czech Republic
2
Mendel University of Agriculture and Forestry, Faculty of Forestry and Wood Technology,
Brno, Czech Republic
ABSTRACT: The paper deals with the determination of sliding resistance at dragging timber by horse and with the calculation of critical slope inclination in situations of threatening spontaneous movement of timber. These are reasons why the horse should not be used in such conditions. Different conditions of skidding trail surface are considered in winter and summer periods of the year. Sliding resistance was determined by using an original methodology in which the acting forces are measured by strain gauges directly at the timber dragging by horse. It was found out that the coefficient of sliding resistance cannot be determined as one concrete figure but rather as an interval of values since it is considerably variable with the character of terrain and character of the surface of dragged log. This is why the critical slope inclination should be determined in a certain interval, too, in order to include the measure of acceptable risk. The measure of acceptable risk is defined by using an auxiliary coefficient of safety whose value should range in the interval from 0.5 to 1.0 as a value indirectly proportional to the magnitude of sliding resistance coefficient.
HOFFMAN (1992) states an optimum slope inclination
to be ranging between 15 and 30% in pulling direction when the horse is capable of performing best and a slope inclination dangerous for the animal to be exceeding 40% (30% at wet weather).
According to a simple survey published by FAO 2 (1977), timber skidding by horse is feasible only down
the hill with a maximum slope inclination of 30%. LE
-TOURNEAU (1987) gives account of general conditions for
individual technological activities of timber production in the forest discussing possibilities of the employment of forest machinery.
STREHLKE (1987) analyzes the problems of safety and
health at work in forestry and uses 20 items to outline directions the branch should further proceed.
RADVAN (1990) discusses limited possibilities for the
employment of horses.
WATERSON (1994) points out an increasing interest in
using horses in the forestry of Great Britain. BECK(1989)
published data on increasing applicability of horses for skidding in the territory of East Germany from 1,662 ani- mals in 1982 to 2,155 animals in 1987 with the total number of horses used at forest work ranging between 2,300 and 2,400.
The goal of this paper was to verify a newly proposed methodology for measuring the horse drawing force and a possibility of subsequent determination of the sliding
resistance coefficient for concrete conditions (NAVRÁTIL
2002) in order to detect one of the primary limiting factors for timber dragging by horse, which is the critical slope inclination with the threatening spontaneous movement of timber.
Safety of this often very hazardous work could be improved by respecting the critical slope inclination in conditions where the health and many times even the life of the animal and its operator are put into jeopardy.
MATERIAL AND METHOD
The measurements were made according to the
origi-nal method designed by NAVRÁTIL (2002). A measuring
apparatus was set up that made it possible to continually measure a drawing force produced by horse onto the choker in which the dragged log is fixed. The measuring apparatus consisted of strain gauge, analogue-to-digital converter, voltage transformer, power source and portable micro-computer. Measured data were primarily recorded in the Expert AD programme installed in the computer.
Practical measurements were carried out in Stand 705B. According to a recapitulation from the Control Book, it is an all-aged stand growing on the southern slope with spruce regeneration in the eastern part of working circle 10 and with apparent damage due to game, snow and air pollution.
The stand in question belongs in primary management group 53, group of forest types 6K, terrain group A (beara-ble terrains up to inclination 25% without obstacles), zone of air-pollution risk C and its total area is 8.98 ha.
Drawing force measurements were made with the use of spruce logs from timber felled in adjacent stands. The logs were in bark with perpendicularly cut butt ends and almost perfect debranching; their selection was made at random.
The basic measurement of horse pulling force was car-ried out on a skidding trail or on the surface similar to that of the skidding trail. The surfaces were chosen so that their slope was nearing a zero value. The measurements were made in both directions in order to eliminate small deflections from the plane.
The horse was walking towards the skidding trail stop-ping once to twice while on the way and getting into motion again.
The reason being rather a high frozen snow cover in winter, the measurements were made on a part of unused at that time main forest road with a layer of driven snow of approx. 5 cm, which was chosen right in the stand.
Summer measurements were made on three approxi-mately same tracks of horse movement right in the stand. The stem attachment for small end and butt end was changed on all tracks if the difference was recognizable on the log.
Each measurement was repeated 4 to 7 times and from these measurements those were chosen that were duly re-corded in the computer. There were at all times 2–5 sets of measured values fit for use.
Coefficient of sliding resistance (coefficient of fric-tion) ƒ was calculated by using the formula derived by
NAVRÁTIL(2002):
√ l2 – h2
F � –––––––
l
f = ––––––––––– (1)
h m � g – F � –– l where: F – drawing force (N),
l – choker length (m),
h – vertical distance between height of side rein attach-ment to the collar and height of choker attachattach-ment to the dragged log (m),
m – log weight (kg),
g – acceleration due to gravity (m/sec2).
The terms defined and used for a more precise descrip-tion of actual condidescrip-tions of timber dragging across the surface are as follows:
– sliding resistance: force acting against the direction of burden motion in the course of movement consists of the friction force of contact surfaces and the strength of resistance at grubbing of the butt end and branches remaining on the log into the ground;
RESULTS AND DISCUSSION
In order to be able to capture the diverse surface prop-erties and thus extend the range of measured values, the measurements were made both in winter and in summer.
In the winter period, there were twelve sets of draw-ing force values obtained for log draggdraw-ing by horse and nine sets of values for pulling the log by tractor winch. However, one set of values contained erroneous data and was incomplete and thus unfitted for use. This means that there were altogether 20 sets of measured data applicable for the calculation. All measurements were made with one spruce log – weight 499 kg, length 9.13 m.
In the summer period, the measurements were made with three logs – 134 kg (7.5 m), 164 kg (9.1 m), 490 kg (10.1 m). There was a total of 47 sets of measured values of which 8 contained erroneous data due to failures of the measuring apparatus; these data could not be used. This indicates that only 39 sets of values were fit for further processing. Spruce logs used in the experiment were at all times in bark.
Pulling by horse and pulling by simple hauling across the surface in general is considerably uneven and vari-able. Minimum values fall down to zero, which represents a movement interruption be it at whip’s command or due
to a stoppage enforced by maneouvering when passing by an obstacle. In contrast, maximum values are several times higher than the average ones the reason being greater force required for putting the burden from the still stand into the motion or for passing over an obstacle.
The courses of these measurements were tested by
the Grubbs test of extreme deviations (DRÁPELA, ZACH
2000). After the exclusion of extreme values basic statistic variables were calculated from each set of values from one measurement such as maximum and minimum value, arithmetic mean and standard deviation.
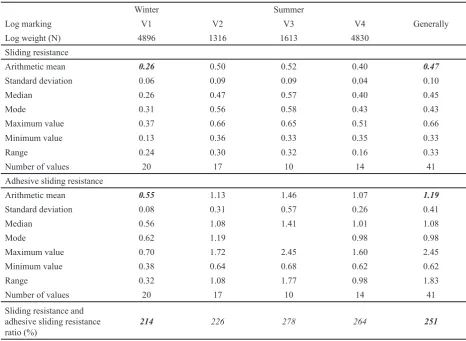
The obtained values were then used to calculate sliding resistance coefficients and their dispersion for each par-ticular surface. Individual values obtained are presented in Table 1.
The maximum values of drawing force detected at putting the body into motion and sliding resistance values calculated from them were subjected to further statistic processing as the values of adhesive sliding resistance.
The above results suggest a considerable variability of critical slope values linking up with a broad interval of adhesive sliding resistance coefficients for one skidding trail surface.
[image:3.595.70.537.405.746.2]The minimum values of variability range from 50% (lower sliding resistance coefficient) to 70% (higher
Table 1. Final values of sliding resistance coefficients
Winter Summer
Generally
Log marking V1 V2 V3 V4
Log weight (N) 4896 1316 1613 4830
Sliding resistance
Arithmetic mean 0.26 0.50 0.52 0.40 0.47
Standard deviation 0.06 0.09 0.09 0.04 0.10
Median 0.26 0.47 0.57 0.40 0.45
Mode 0.31 0.56 0.58 0.43 0.43
Maximum value 0.37 0.66 0.65 0.51 0.66
Minimum value 0.13 0.36 0.33 0.35 0.33
Range 0.24 0.30 0.32 0.16 0.33
Number of values 20 17 10 14 41
Adhesive sliding resistance
Arithmetic mean 0.55 1.13 1.46 1.07 1.19
Standard deviation 0.08 0.31 0.57 0.26 0.41
Median 0.56 1.08 1.41 1.01 1.08
Mode 0.62 1.19 0.98 0.98
Maximum value 0.70 1.72 2.45 1.60 2.45
Minimum value 0.38 0.64 0.68 0.62 0.62
Range 0.32 1.08 1.77 0.98 1.83
Number of values 20 17 10 14 41
Sliding resistance and adhesive sliding resistance
ice % 0% 2% 3% 5% 7% 9% 11% 12% 14% 16% 18% 19% 21% 23% 25% 27% 29% 31% 32% 34% 36% 38% 40% 42% 45% 47% 49% 51% 53% 55% 58% 60% 62% 65% 67% 70% 73% 75% 78% 81% 84% 87% 90% 93% 97% 100% ° 0 1 2 3 4 5 6 7 8 9 10 11 12 13 14 15 16 17 18 19 20 21 22 23 24 25 26 27 28 29 30 31 32 33 34 35 36 37 38 39 40 41 42 43 44 45 slo pe snow test road log o.b. log u.b..
lo am y sa nd (d ry ) st on y sa nd (d ry ) st on y (w et ) skidding trail log o.b. log u.b.
lo am y su rf ac e sa nd y su rf ac e gravelly surface lo am y su rf ac e compacted dr y un co m pa ct ed w et u nc om pa ct ed
gravelly surface loam
y sa nd (d ry ) sa nd y su rf ac e st on y sa nd (d ry ) in cl in at io ns su ita bl e fo r d ra gg in g by h or se frozen surface lim it of a ut on om ic , u nc on tro lla bl e lo g m ov em en t in cl in at io ns u ns ui ta bl e fo r d ra gg in g by h or se dr ag gi ng b y ho rs e is p os si bl e at a de qu at e pe ril lim it of sa fe d ra gg in g by h or se st on y (w et )
sliding resistance coefficients) of the mean value with maximum values reaching up to 140% of the mean value. We can simplify in general that the value of critical slope inclination angle calculated from the mean value of slid-ing resistance can be higher or lower by as much as 50%. It follows that the lower coefficients of sliding resistance show a greater risk of reaching the critical slope inclina-tion at the change of skidding condiinclina-tions.
In any individual case of assessing the production and technical conditions a certain deviation from the model situation must be taken into account. This is why it is necessary to count with a certain safety of use – as it is usual when using the common means of mechanization. The necessity of using the coefficient of safety follows out from the fact that a primary concern should be maximum reduction of injury for both the whip and the animal.
As said above, the coefficients of safety are usually ap-plied in machines for timber skidding in order to reduce the risk of vehicle turning over to minimum. The coefficients are different for different means of mechanization. With respect to the above described variability of values for individual coefficients of sliding resistance (coefficients of
friction) published by various authors as mean values NA
-VRÁTIL(2002) suggests to use such values of the coefficient
of safety that would not be constant but rather depending on the magnitude of the sliding resistance coefficient. This is based on a consideration that the greater the sliding resist-ance coefficient, the lower the risk of spontaneous timber displacement at the same change of slope inclination.
The values of proposed coefficients of safety ksaf for
individual values of mean sliding resistance range from 0.5 to 1.0 and issue from a simple equation
1
ksaf = ––––– (2)
2 – f
where: ƒ – coefficient of sliding resistance.
By this way a condition was fulfilled that the higher measure of risk of spontaneous movement of timber across the slippery surface is approximately equalling the actual measure of risk on dry terrains with rough surface.
The values of “friction coefficients” published by vari-ous authors can serve – with the use of the proposed coef-ficient of safety – to set up Table 2.
An important finding may be the fact that a consider-able difference in the measure of risk in the winter period results from the condition of snow cover.
However, the coefficient of sliding resistance and hence the subsequent values of critical slope inclination can be affected by a number of factors of which the most impor-tant ones are as follows:
– non-uniform character of soil cover – with possible oc-currence of tree species regeneration, undergrowth of shrubs or weeds that do not cover the soil continually but only at some places of the skidding trail;
– rugged terrain with depressions, fissures, obstacles such as stones, boulders, rocks (stumps) and the like results in a variable contact area of soil and stem, increasing momentary inclination of the stem;
– weather changes – there is a considerable difference between the sliding resistance coefficient of the same surface when it is dry, wet, frozen, covered with snow or with ice;
– variable shape of the stem – stem curving, imperfect debranching and other irregularities result in the vari-able contact area (stem-soil);
– variable kinds of tree bark and its surface – bark of tree species differs in roughness and the coefficient of friction reflects any – even partial – bark tears-off in the process of skidding timber that has not been de-barked;
– non-uniform horse pull – the stem is being put into mo-tion either continually or by tugs of variable vigour.
CONCLUSION
Practical measurements provided a reliable evidence that the proposed methodology for determining a draw-ing force at timber skidddraw-ing and value of sliddraw-ing resistance coefficient derived from it is applicable in the given condi-tions and gives trustworthy data for the given purpose.
It was found out that the coefficient of sliding resistance cannot be determined as one concrete value but rather as an interval of values since it is considerably variable with respect to the character of ground surface and character of the surface of hauled log.
Critical slope inclination must therefore be determined within a certain interval of values, too, when it is possible to include the measure of acceptable risk. The measure of acceptable risk can be determined by means of the auxiliary coefficient of safety whose value should range from 0.5 to 1.0 and should be indirectly proportional to the coefficient of sliding resistance.
References
BECK W., 1989. Zum Einsatz von Pferden im Ruckeprozess. Sozial.-Forstwirtsch., 39: 109–111.
DRÁPELA K., ZACH J., 2000. Statistické metody II. Brno, MZLU: 144.
FAO 2, 1997. Planning Forest Roads and Harvesting Systems, FAO Forestry Paper 2, Rome: 148.
HEINRICH R., 1987. Appropriate Wood Harvesting Techniques in Mountain Forestry in Developing Countries, Role of Forest Research in Solving Socio-economic Problems in the Hima-layan Region. IUFRO, Pakistan: 178–193.
HOFFMAN V., 1992. Untersuchung physischer Beanspruchun-gen des Pferdes bei Rückearbeiten. [Diplomarbeit.] Göttin-gen, Fachhochschule Hildesheim/Holzminden Fachbereich Forstwirtschaft in Göttingen: 68.
LETOURNEAU L.R., 1987. Selection of logging systems and machinery. In: FAO 78-Appropriate wood harvesting in planta-tion forests, Training material from the FAO/Finland Training Course, FAO Forestry Paper 78, Rome: 266.
RADVAN J., 1990. Kůň v lesním hospodářství, příručka pro kočí režijních potahů. Praha, SZN: 229.
RODRIGUEZ E.O., MAYER A., 1986. Wood extraction with oxen and agricultural tractors. FAO Forestry Paper 49, Rome: 92.
SIMANOV V., 1993/1994. Osnovy přednášek k předmětu těžba a technologie lesní výroby.
STREHLKE B., 1987. Safety in logging, in ergonomics applied to logging. FTP, 18, Helsinki: 87–94.
WATERSON J., 1994. The draught horse in UK forestry. Quart. J. For., 88: 309–313.
Received 11 July 2002
Příspěvek k určení vlečného odporu při přibližování dříví koňmi sloužícího k výpočtu
kritického sklonu svahu
S. NAVRÁTIL1, A. SKOUPÝ2
1ALLWOOD, a. s., Zlín, Česká republika
2Mendelova zemědělská a lesnická univerzita, Lesnická a dřevařská fakulta, Brno, Česká republika
ABSTRAKT: Práce se zabývá stanovením vlečného odporu při přibližování dříví koňmi a výpočtem kritického sklonu svahu, kdy hrozí samovolný pohyb dříví a který je hranicí, nad níž by se již nemělo využívat koně. Jsou zohledněny různé terénní podmínky, zejména pak stav povrchu přibližovací linky. K určení vlečného odporu byla použita originální metodika, při které jsou tenzometricky snímány síly přímo při vlečení dříví koněm. Bylo zjištěno, že koeficient vlečného odporu nelze stanovit jako jednu konkrétní hodnotu, ale jako interval hodnot, neboť je značně proměnlivý s ohledem na charakter povrchu terénu a charakter povrchu přibližovaného výřezu. Proto i kritický sklon svahu je vhodné uvádět v určitém intervalu, kdy je možné zahrnout míru přijatelného rizika. Míru přijatelného rizika umožní určit pomocný koeficient bezpečnosti, jehož hodnota by se měla pohybovat v rozmezí 0,5–1, a to nepřímo úměrně velikosti koeficientu vlečného odporu.
Klíčová slova: lesnická technika; přibližování dříví; koňský potah; vlečný odpor; kritický sklon svahu
Při soustřeďování dříví je nutné na kmen působit silou, která překonává třecí sílu a další odporové silové složky brzdící těleso. Faktorem, který vyjadřuje potřebnou ve-likost této síly vzhledem k charakteru povrchu a taženému dříví (kmen, výřez), je koeficient vlečného odporu, který se v odborné literatuře převážně ne zcela přesně označuje
jako součinitel tření f.
Jednou z možností, jak tento koeficient zjistit, je jeho výpočet ze skutečné tíhy výřezu a tažné síly nutné k jeho přemístění na rovině. Tažnou sílu přitom můžeme získat pomocí měřicí aparatury sestavené z tenzometrického snímače, analogově digitálního převodníku, měniče napětí, zdroje energie a přenosného mikropočítače.
Návrh metodiky sloužící ke zjištění tažné síly koně a výpočet vlečného odporu společně s výpočtem kritic-kého sklonu svahu byl základním úkolem práce.
Veškeré přístroje měřicí aparatury byly umístěny v brašnách na hřbetu koně. Naměřené hodnoty byly sbírány pomocí programového systému Expert AD, jenž je určen pro snímání časového průběhu mechanických nebo elektrických veličin, k jejich následnému hodnocení a dokumentaci.
Po vyloučení extrémních hodnot – tzn. hodnot s nápadně
hou vyskytnout z důvodu zastavení, ukončení pohybu, zaražení přibližovaného výřezu o překážku nebo různé poruchy měření a snímání hodnot, byly z každého souboru hodnot vypočteny základní statistické veličiny, jako jsou maximální a minimální hodnota, aritmetický průměr a směrodatná odchylka klouzavého vlečného odporu.
Maximální hodnoty tažné síly naměřené při uvádění tělesa do pohybu a z nich vypočtené vlečné odpory byly dále statisticky zpracovávány jako hodnoty vlečného odporu přilnavého.
Podle dostupných informací je tato metodika v oblasti lesního hospodářství v našich podmínkách ojedinělá. Na základě skutečných praktických měření se potvrdilo, že popsaná metodika je pro daný účel použitelná. Poskytuje odpovídající údaje, které jsou při obdobných podmínkách opakovatelné. Pro další účely je možné tuto metodiku dále rozvinout, popřípadě inovovat.
Dosahované výsledné hodnoty jsou přesné a zcela re-prezentativní pro skutečné podmínky měření.
Hodnota vlečného odporu přilnavého byla v intervalu od 0,38 do 0,70. Průměrná hodnota vlečného odporu přilnavého byla 0,55, což představuje 212 % vlečného odporu klouzavého.
Hodnoty všech měření klouzavého vlečného odporu na přibližovací lince pokryté jehličnatou hrabankou v letním období, které probíhaly se třemi různými výřezy, se pohy-bovaly v intervalu od 0,33 do 0,66. Aritmetický průměr byl 0,47.
Hodnoty přilnavého vlečného odporu u všech výřezů se pohybovaly v intervalu od 0,62 do 2,45 a průměrné hod-noty se u jednotlivých souborů měření pohybovaly mezi 1,07 až 1,46, což představovalo 226 až 278 % klouzavého vlečného odporu.
Výsledných hodnot by bylo možné využít při nasa-zování jednotlivých přibližovacích prostředků v těžebních technologiích a při volbě těžební metody v našich i za- hraničních podmínkách.
Zvláště pak šlo o stanovování limitujících faktorů přibližování dříví, jako je kritický sklon svahu, a tím
zajištění bezpečnosti práce a snížení rizika úrazu koně a jeho obsluhy.
V rámci výpočtů kritického sklonu svahu pomocí jed-notlivých reprezentativních hodnot, publikovaných pro různé povrchy terénu v literatuře, byla navržena možnost používání koeficientu bezpečnosti. Tento koeficient má sloužit ke snížení rizika samovolného pohybu, neboť podmínky přibližování jsou značně proměnlivé.
Respektování vybraných limitujících faktorů by v praxi mělo umožnit omezení často velmi rizikové práce koně a jeho obsluhy v podmínkách, kde je ohroženo jejich zdraví a mnohdy i život. Tyto předpoklady jsou plně v souladu se stále se zvyšujícími nároky na bezpečnost a hygienu práce.
Obecně lze uvést, že ve studiu problematiky publiko-vané v práci by bylo možné nadále pokračovat. Šetření by se mělo rozšířit na rozdílné povrchy a charaktery terénu a hlavně rozdílné dřeviny podle jejich individuální cha-rakteristiky. Dále by také bylo třeba se věnovat možnosti ověření tahové charakteristiky ve svahu a tahové charak-teristiky za použití rozličných přibližovacích pomůcek.
Corresponding author: