Abstract —This paper presents results of a simulation study to quantify the effect of zero sequence removal on the accuracy of transformer fundamental quantities estimated from ordinary voltage and current signals by linear fitting selected quantities as a function of loads. Unbalanced system conditions and asymmetrical loads are some of the common causes of zero sequence. Flow of zero sequence across a transformer is dependent on the winding configuration of the transformer and the system grounding conditions. As all possible combinations of winding and grounding configurations, and appearance of zero sequence cannot in practice be tested, in this study, a series of PSCAD model simulations was performed based on a typical power system with two transformers, transmission lines, industrial and domestic loads. The transformers were configured in different vector groups (Y-Y, Y-∆) and grounding states to replicate commonly encountered scenarios. System and load imbalances were created by asymmetrical loads on the transmission side and asymmetrical reactive power compensation on the consumer side respectively. The results indicates that the zero sequence removal result in good accuracy compare to estimation with zero sequence irrespective of the winding and grounding configurations.
Index Terms — Zero-Sequence, Turn Ratio, Impedance, PSCAD, Transformer
I. INTRODUCTION
ower transformers are one of the expensive and important equipment in power transmission and distribution networks. In order to avoid sudden transformer failures causing outages and collateral damages, early detection of the symptoms of such faults is necessary, so that planned maintenance and remedial measures can be carried out. There are number of methods available to assess the condition of a transformer both off-line and on-line. Due to the inherent advantage of round the clock service and early fault detection capability, on-line monitoring has attracted vast interest especially during last two decades and a number of solutions have been proposed and put into practice worldwide.
An on-line method to monitor the value of most central transformer parameters from current and voltage transformer
signals installed on transformer in service was presented before. Using a simple transformer model it is possible to deduce the transformation ratio and total winding impedance by linear fitting selected quantities as a function of loads. This concept is named as Transformer Explorer [1].
In the proposed quantity estimation, winding voltages and currents are necessary, and often the zero sequence is dropped during the transformation process of signals from the measured line voltages and currents. It is also preferred to exclude the zero sequence current and voltages as their appearance in the primary and secondary sides is dependent on earthed neutral points and presence of a delta winding [2-4]. Unbalanced system conditions and asymmetrical loads are some of the common cause of zero sequence. The fact that a power network being unbalanced can also be due to a transformer fault (e.g. change of short circuit impedance due to a winding buckling) itself which is to be detected by the Transformer Explorer. In such a case zero sequence removal may have a negative effect on the ability to detect the fault (sensitivity), which is one of the key questions answered in the presented results.
In this paper we modelled a typical power system with different configurations of transformers and some imbalances scenarios that create zero sequence on voltage and current signals. These signals are analyzed using Transformer Explorer to estimate turn ratio and short-circuit impedance in order to see how the zero sequence removal could affect the sensitivity of the propose methods.
II. PRINCIPLEOFON-LINEMEASUREMENTOF TURNRATIOANDIMPEDANCE
A. Equivalent Circuit and Transformer Fundamental Quantity
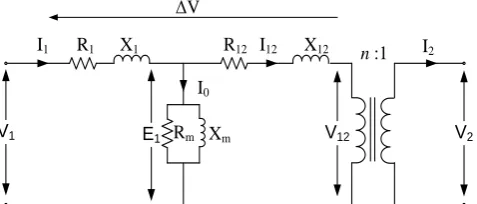
The transformer fundamental quantities can basically be derived from the equivalent circuit of a two winding transformer model presented in Fig. 1.
P
Influence of Zero-Sequence Removal on
Transformer Fundamental Quantity Monitoring
[image:1.595.308.547.651.753.2]Berly A. Mustaqim, Member, IAENG, Eka A. Ambarani, Member, IAENG,N. Abeywickrama, K. Srivastava and Suwarno, Member, IAENG
Fig. 1. Equivalent circuit of a two winding transformer referred to the primary side.
V1 V2
I1 R1 X1 R12 I12 X12
I0
Rm Xm V12
n :1 I2 ΔV
E1
Manuscript received March 6, 2016; revised March 31, 2016. This work was supported in part by the PT. PLN (Persero), State Electricity Company of Indonesia and ABB Corporate Research, Sweden.
B. A. Mustaqim and E. A. Ambarani are with the PT. PLN (Persero), State Electricity Company of Indonesia and the School of Electrical Engineering and Informatics, Institut Teknologi Bandung (e-mail: [email protected]; [email protected]; eka.annise@ gmail.com).
N. Abeywickrama and K. Srivastava are with the Department of Electrical System, ABB Corporate Research, Sweden (e-mail: nilanga.abeywickrama @se.abb.com; [email protected]).
The meanings of the symbols used in Fig. 1 are given below: n:1 : Transformer ratio.
R1, X1 : Primary resistance, leakage reactance.
R12, X12 : Secondary resistance, leakage reactance referred to primary side.
V1, V2 : Primary, secondary voltages. I1, I2 : Primary, secondary currents.
V12, I12 : Secondary voltage, current referred to primary side.
Rm, Xm : core loss resistance, magnetizing reactance.
From Fig 1, the primary current I1 has two components, one is magnetizing component Io and the other is load component (I12= I2/n). Rm represents core losses and Xm represents magnetizing reactance. These magnetizing current Io and load current I12 cause a voltage drop
∆
V in transformer.∆
V can be written as∆𝑉 = 𝑉1− 𝑉12= 𝑉1− 𝑛. 𝑉2 (1)
∆𝑉 = (𝑅1+ 𝑗𝑋1 + 𝑅12+ 𝑗𝑋12).𝐼𝑛2+ 𝐼𝑜. (𝑅1+ 𝑗𝑋1) (2) ∆𝑉 = 𝑍𝑤.𝐼𝑛2+ 𝐼𝑜. 𝑍1 (3)
Where
Zw is the total short circuit impedance which is (𝑅
1+ 𝑗𝑋
1+ 𝑅
12+ 𝑗𝑋
12).
Normally ∆V of a loaded transformer is dominated by load current I12 and I0 is typically < 1 % for large power transformer. However, under light load conditions, voltage drop created by the magnetizing current shares a significant portion of ∆V. With an assumption that magnetizing current (I0) remains fairly the same at higher load currents. The relationship between primary and secondary currents is linear and can be written as𝐼1 = 𝐼𝑛2+ 𝐼𝑜 (4)
From equation (4), we can estimate the turn ratio (n) that is usually measured off-line as the no-load voltage ratio. These two basic values: Turn Ratio (n) and short-circuit impedance (Zw) are hereafter be referred to as the Transformer fundamental quantities.
B. Calculation of Fundamental Quantity
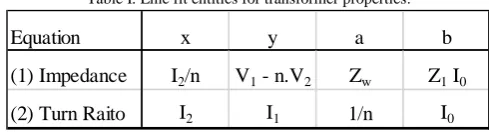
The fundamental quantities are obtained by linear fitting one parameter against the load current. Equations (3) and (4) are of the form y = ax + b, where a and b represent the transformer quantities. Thus a linear fit of a data set consisting of x and y pairs will yield the transformer quantities. Table I shows the meaning of the symbols for the two different equations.
The voltage and current signals, V1, V2, I1 and I2 are
Electronic Devices (IED), Digital Fault Recorder (DFR) or in this case are generated from Comtrade recorder in PSCAD simulation.
As shown in Fig. 2, Linear fit for turn ratio from current signals that we get from a data set (120 data points), one of the scenario using transformer configuration Y-Y with solidly grounded neutral.
C. Symmetrical Component Transformation and Zero-sequence Removal
A system of three unbalanced three-phase systems can be resolved in the following three symmetrical components:
• Positive Sequence: A balanced three-phase system with the same phase sequence as the original sequence. • Negative sequence: A balanced three-phase system with
the opposite phase sequence as the original sequence. • Zero Sequence: Three phasors that are equal in
magnitude and phase.
The voltage and current signals that we obtained consist of these three symmetrical components. To transform these signals into positive, negative and zero sequence, we need a unit phasor (or operator) that will rotate another phasor by 120o in the counterclockwise direction. The letter 'α' is used to designate such a complex operator of unit magnitude with an angle of 1200. It is defined by
𝛼 = 1∠120𝑜= 𝑒𝑗120𝑜
= −12+ 𝑗 √32 (5)
The three phase voltage and current signals that we measure can be written in terms of sequence components in the form of following matrix equation:
[ 𝑉𝑎 𝑉𝑏 𝑉𝑐
] = [11 𝛼12 𝛼1 1 𝛼 𝛼2] [
𝑉𝑎𝑜 𝑉𝑎1 𝑉𝑎2
] (6)
[𝐼𝐼𝑎𝑏 𝐼𝑐
] = [11 𝛼12 𝛼1 1 𝛼 𝛼2] [
𝐼𝑎𝑜 𝐼𝑎1 𝐼𝑎2
[image:2.595.306.542.99.274.2]] (7)
Fig. 2. Turn Ratio Fit (plot of LV current vs HV Current).
150 200 250 300 350 400 450 500 550 600 650 600
800 1000 1200 1400 1600 1800 2000 2200
Ihv (A)
Ilv
(A
)
Linear fit for Turn Ratio
y=ax+b; phase R
phase S phase T linear
Table I. Line fit entities for transformer properties.
Equation x y a b
(1) Impedance I2/n V1 - n.V2 Zw Z1 I0
[image:2.595.44.289.681.747.2]Due to the fact that the zero sequence impedance is in most cases not the same as the positive/negative sequence counterparts and it depends on earthed neutral points and presence of a delta winding. Sometimes it is necessary to remove the zero sequence current and voltage, which can be performed as followed:
[ 𝑉𝑎 𝑉𝑏 𝑉𝑐
] = [11 𝛼12 𝛼1 1 𝛼 𝛼2] [
𝑉𝑎𝑜 𝑉𝑎1 𝑉𝑎2
] − [𝑘1𝑘1 𝑘1] [𝑉𝑎𝑜
] (8)
[ 𝐼𝑎 𝐼𝑏 𝐼𝑐
] = [11 𝛼12 1𝛼 1 𝛼 𝛼2] [
𝐼𝑎𝑜 𝐼𝑎1 𝐼𝑎2
] − [𝑘1𝑘1 𝑘1
] [𝐼𝑎𝑜] (9)
Where,
𝑉𝑎𝑜 𝑎𝑛𝑑 𝐼𝑎𝑜 are the zero sequence voltage and current.
K1 is a setting parameter which can have values 1 or 0 and are
set by the end user in order to enable or disable the zero sequence voltage and current reduction.
III. THESIMULATIONMODELOFPOWERSYSTEM ANDTRANSFORMER
A. Simulation Setup
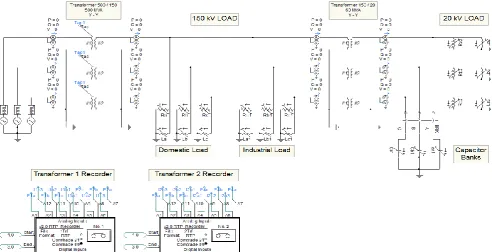
[image:3.595.59.273.133.222.2]The total system modelled in PSCAD software is shown in Fig. 4. There are two transformers with ratings 500/150 kV, 500 MVA and 150/20 kV, 60 MVA. In both secondary sides, there are industrial load and domestic loads. Reactive power compensation or capacitor banks are connected to 20 kV side with a capacity 6 MVAR.
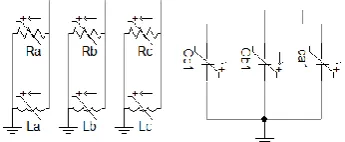
In order to create an imbalance system and load, the load model and capacitor banks are created per phase and represented by variable resistance, inductance and capacitance as shown in Fig. 3.
Fig. 3. Load and capacitor banks modelled as variable resistance, inductance and capacitance.
For the characteristics of industrial load, we assumed a constant consumption of 100 MW/phase connected to 150 kV. The variable loads are set to fluctuate with time having a peak value of 50 MW/phase on 150 kV side and 12 MW/phase on 20 kV side. The base power factor for the system is 0.85.
Using equation (10) and (11) we can estimate associated resistance and inductance for given power (P + jQ).
𝑃 =
𝑉𝐿−𝑁2𝑅 (10)
𝑄 = 𝑃 √
1cos 𝜑2
− 1 =
𝑉𝐿−𝑁2
𝜔𝐿 (11)
A three-phase transformer is modelled in PSCAD as three identical single-phase transformers. From these single-phase transformers, it is possible to create different winding configurations depending on the power, voltage or special needs required to simulate the system [5]. The technical data of each transformer is presented in Table II.
As shown in Fig. 4, voltage and current signals of both primary and secondary sides of both transformers are recorded using PSCAD Comtrade recorder, which can be read into Transformer Explorer application. As steady state signals are needed, initial transient part of each PSCAD simulation was avoided and only 2s in the latter part of the simulation period was recorded. As many Comtrade waveform files have to be recorded with varying load for each case studied, multiple run feature in PSCAD was used to perform parametric sweep [6]. For example, for each scenario mentioned in Table IV, 120 simulations (Runs) were performed.
B. Unbalanced Scenarios and Transformer Configurations The zero-sequence equivalent circuit of a three-phase transformer varies depending on the type of winding configurations, earthed neutral points and the core construction. In some configurations, zero-sequence current cannot flow in the winding [7].
In order to see how zero-sequence removal could affect the accuracy of turn ratio and impedance estimations, several realistic scenarios of system imbalances and different transformer configurations are investigated. Transformer configurations and imbalance scenarios are listed in Table III and IV. The last two scenarios are associated with a simulated fault of 4% increase in one phase resembling a mechanical fault in the form of a buckling.
[image:3.595.310.548.135.275.2]A constant imbalance on 150 kV load was simulated by setting a different load on phase A than the other two and a different load on phase B on the 20 kV side. On the other hand for variable imbalance, load on each phase was set to vary randomly.
Table II. Data for transformers.
Transformer T1 T2
Voltage (kV) 500 / 150 150/20
Power (MVA) 500 60
Base Frequency (Hz) 50 50
Leakage Reactance (pu) 0.125 0.1232
No Load losses (pu) 0.0001 0.0001
Copper Losses (pu) 0.0005 0.0005
Magnetizing Current (%) 0.5 0.5
[image:3.595.83.256.486.557.2] [image:3.595.273.552.697.766.2]Fig. 4. System Simulation with Y-Y Transformers with Solidly Grounded Neutral.
IV.SIMULATIONRESULTSANALYSIS
The voltage and current signals that we obtained from Comtrade recorder in PSCAD simulation are analyzed by Transformer Explorer. In order to enable or disable the zero sequence voltage and current reduction, parameter k1 in equations (8) and (9) are set by the user. With this function we can analyzed and compare the estimated turn ratio and impedance with or without zero-sequence.
Signals from both transformers were analyzed to see the influence of zero-sequence on the primary side and/or secondary side. Fig. 5 shows accuracy for impedance estimation for 150/20 kV transformer without fault. In case 1 and 4, the impedance estimation with and without zero-sequence exhibits not much difference, meanwhile another transformer configuration (e.g. case 2) results in a large error as large as three times the nominal value. However the estimated values become quite close to the nominal values upon zero sequence removal.
Impedance estimations for another with a transformer fault (4 % impedance increase in phase A) on 150/20 kV
In case 1 and 4, estimation with zero-sequence approaches the real fault value (~3.9 % compared to expected 4 %) and estimation without zero-sequence also shows a good sensitivity to the fault (~2.7 % vs expected 4 %), however lost one third of the sensitivity to the fault along with the zero sequence removal. Even if a very good sensitivity to faults Table IV. Imbalance Scenarios.
Scenario State
1 No Imbalance
2 Constant Imbalance on 150 kV load and no imbalance on 20 kV load
3 Constant Imbalance on 20 kV load and no imbalance on 150 kV load
4 Variable Imbalance on 150 kV load and no imbalance on 20 kV load
5 Variable Imbalance on 20 kV load and no imbalance on 150 kV load
6 Combination variable imbalance on 150 and 20 kV load
7
Variable Imbalance on 150 kV load and no imbalance on 20 kV load with 4% impedance increase (fault) in phase A of the monitored transformer
8 No Imbalance with 4% impedance increase (fault) in phase A of the
[image:4.595.305.549.327.668.2]monitored transformer
Fig. 5. Accuracy of Impedance estimation without fault on 150/20 kV Transformer.
transformer configurations can lead to very high errors in impedance and turn ratio estimations by Transformers Explorer, which eventually result in false alarms when exposed to system imbalances producing significant zero sequence in around the monitored transformer. Therefore zero sequence removal is recommended irrespective of the winding and earthling configuration.
Detailed result for each case on both transformers are shown in Table V and VI. The values shown in the tables are the largest percentage error, out of all simulated scenarios (see Table IV), compared to the corresponding nominal values. Actually in case of the simulated fault (4 % impedance increase), the percentage error is not really an error, instead Transformer Explorer is supposed to detect 4 % change in the impedance of the faulty phase.
Observing the results in Table V and VI, one can conclude the followings for each case:
Case 1: zero-sequence current or voltage don’t influence the estimated turn ratio and impedance for this winding configuration (Y-Y) with solidly grounded neutral points. Even with 0.42 % zero sequence the estimated turn ratio shows good accuracy (less than 0.1 %) compared to the nominal value. In case of the impedance, the estimated values also show good accuracy (˂ 0.25 %), increased impedance by 4 % is also detected as a 3.8 % increase with zero sequence and 2.5 % without zero sequence. Decrease in fault detection accuracy by about one third without the zero sequence is understandable as one third of the imbalance created by the
asymmetrical single phase fault (4 % impedance increase in phase A) is removed from each phase as the zero sequence.
No influence on the accuracy of estimated impedance and turn ratio with zero sequence is actually due to the fact that in case of a solidly grounded transformer the zero-sequence can flow on both sides of the transformer providing a continuous path.
Case 2: in contrast to the previous case, the estimated impedance with zero sequence exceeds the nominal value by three times (˃300 %), which is due to the elevated zero sequence impedance by three times the neutral to ground impedance on the secondary side compared to the zero sequence impedance on the primary side. Upon zero-sequence removal, the accuracy of estimated quantities returns to expected values (˂ 0.05 % for turn ratio and ˂ 0.25 % for impedance). This is primarily because of not accounting the uneven zero sequence current and voltages between the primary and secondary sides.
Case 4: this case with a delta winding in the secondary leads the turn ratio to a wrong estimation. The estimated turn ratio with zero-sequence deviates from the nominal value by 32.84 %, especially on the 150/20 kV transformer when scenario 4 occurs resulting in high zero sequence in the primary side signals and not on the secondary side terminal signals as the zero sequence only flows inside the closed delta winding. However, when the zero sequence current and voltage are removed, estimations show a good accuracy (˂ 0.06 %) for turn ratio and (˂ 0.25 %) for impedance.
Table V. Accuracy of estimated turn ratio and impedance of 500/150 kV transformer.
Case 3, 5, 6: these cases are of Y-Y configurations with different neutral grounding practices, which also leads to high inaccuracy in impedance estimations when zero-sequence is included, can be due to the fact that the zero-sequence current cannot flow in either winding (as the absence of a path through one winding prevents the zero sequence current). With zero-sequence removal, the estimations reached the same accuracy as in the other cases without zero sequence.
V.CONCLUSION
Influence of zero sequence current and voltage on transformer fundamental quantity (turn ratio and impedance) estimation was investigated and found that the estimated quantities can contain significantly high error if the zero sequence is not removed. With Zero-sequence removal, transformer fundamental quantities estimation can reach the required accuracy to detect changes (as per the IEEE standard [8]) in the turn ratio and impedance without producing false alarms, even with the presence of system imbalances on one or both side of a transformer. Although the parameter estimations for solidly grounded Y-Y connected transformer, which is not common, is not prone to zero sequence issue, it is advisable to remove the zero sequence in case if the grounding system is not good.
It has been shown that the fault detection ability is not affected by the zero sequence removal as a 4 % impedance increase can be detected convincingly. If such an impedance change is detected, recommendation would be to plan for an outage and perform advanced measurements like FRA to confirm the on-line diagnosis by Transformer Explorer.
REFERENCES
[1] T. Bengtsson, N. Abeywickrama, “On-line Monitoring of Power Transformer by Fundamental Frequency Signals”, 21, rue d’Artois, F-75008 PARIS, Cigre, 2012.
[2] Martin J. Heathcote, The J & P Transformer Book, 13th edition, 2003. [3] Turan Gonen, Electric Power Transmission System Engineering,
Analysis and Design, 1988.
[4] John J. Winders, Jr, Power Transformers Principles and Applications, 2002.
[5] Power transformers – Part I: General, IEC 60076-1. [6] Manitoba Research Center, User’s Guide PSCAD, 2010.
[7] P. Kundur, Power System Stability and Control, McGraw-Hill, 1994. [8] IEEE Guide for diagnostic field testing of electric power apparatus-Part