Computer vision and artificial neural network
techniques for classification of damage in potatoes
during the storage process
Krzysztof Przybył
2, Piotr Boniecki
1, Krzysztof Koszela
1*, Łukasz Gierz
3,
Mateusz Łukomski
11Institute of Biosystems Engineering, Poznan University of Life Sciences, Poznan, Poland
2Institute of Food Technology and Plant Origin, Poznan University of Life Sciences, Poznan, Poland
3Faculty of Machines and Transport, Poznan University of Technology, Poznan, Poland
*Corresponding author: [email protected]
Citation: Przybył K., Boniecki P., Koszela K., Gierz Ł., Łukomski M. (2019): Computer vision and artificial neural network techniques for classification of damage in potatoes during the storage process. Czech J. Food Sci., 37: 135–140.
Abstract: The research methodology consists of several stages to develop a noninvasive method of identifying the turgor of potato tubers during the storage. During the first stage, a graphic database (set of training data) has been created for selected varieties of potatoes. As a next step, special proprietary software called ’PID system’ was used together with a commercial MATLAB package to extract parameters defining the digital image descriptors. This included: hue space models, shape coefficient and image texture. Thirdly, Artificial Neural Network (ANN) training was conducted with the use of Statistica and MATLAB tools. As a result of the analysis, a neural model has been obtained, which had the greatest classification features.
Keywords: artificial neural networks; Haralick’s texture analysis; image analysis; storage of potatoes
Maintaining high product quality for as long as pos-sible requires optimal conditions for storage after harvest. In order to do so, the life processes of tubers must be minimized. Such factors like temperature and humidity have the biggest impact on the ensur-ing appropriate potato storage.
In order to ensure correct classification of products and reduce losses during their storage, efforts were focused on the sensory evaluation of potatoes with the use of modern techniques, such as computer image analysis and neural modelling. Computer image analysis is a method of segmenting objects and extracting the characteristics (numerical data) encoded in a digital image (Boniecki et al. 2013; Ko-szela et al. 2013; Przybył et al. 2014). Neural image analysis was used for classification of dried carrots
into different levels, and a genetic algorithm used in the process of drying carrots was designed based on regression analysis (Koszela et al. 2012). Image classification has been used in detection of damage in olives (Riquelme et al. 2008). It was noted that this technique has become an object of interest for scientists all over the world. This is confirmed by the verifiability of this method in solving the scientific and technological problems.
The aim of this study was to develop a method to as-sist the identification of either varieties and the turgor of potato tubers carried out based on the graphical data encoded in the form of digital images, obtained using algorithms interpret the image descriptors, using the modern tools (methods) such as: computer vision and artificial neural network techniques.
MATERIAL AND METHODS
Potatoe samples. The research covered five basic varieties of potatoes: Denar, Lord, Gala, Nandina and Vineta, which are more popular in Poland than in other countries. This is due to the fact that they possess such valued qualities as shape, colour of skin, pulp, fertility, resistance to viruses and storage durability.
Samples were collected at random from selected batches of each potato variety. The potatoes were placed in pallet boxes measuring 1.5 × 1.5 × 1.5 m. Every sample batch was placed in 6 different loca-tions of the technological storage room. Each sample was taken from three different layers of pallet-boxes (in accordance with the standard PN-R-74452).
The image acquisition process, coupled with the use of measurement and research equipment, allowed for the development of a graphical database. The collection of more than 21 000 images of 5 varieties of potatoes was obtained. The primary image was processed then by cutting the object from the image. The object on the secondary image was then placed under analysis.
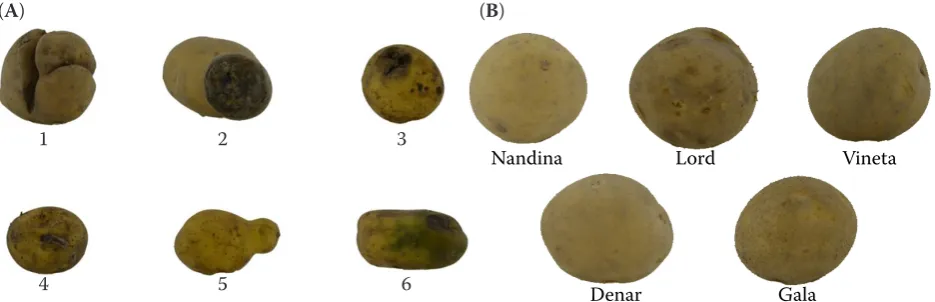
Before starting the process of generating the spe-cific numerical data of the object, damage to the tubers was identified organolepticly by experts us-ing manual methods (Figure 1). As a result, potatoes were divided into the following classes:
(1) Denar variety, (2) Gala variety, (3) Nandina variety, (4) Lord variety, (5) Vineta variety,
(6) damaged potatoes (1, 2, 3, 4, 5, 6).
Image aquisition. The measurement and research station was used for the acquisition of graphical
data-base from the research material. The parameters of the equipment were appropriately calibrated for making digital images (by standard PN-EN 12464-1: 2004). Measurement was performed using a CFM DT-1308 luxmeter. According to the norm, condition of light was checked using luminance distribution factor of 0.71, which means that it fully meets determined require-ments concerning rules of even lighting in rooms, among other things, in laboratory site (Przybył et al. 2016).
In order to obtain a set of image descriptors used an original IT application ‘PID system’, together with MATLAB software. Later STATISTICA software was used to analyse the test results. ‘PID system’ is original software written in environment called Microsoft Visual Studio using programming lan-guage C# (Przybył et al. 2016). ‘PID system’ was designed and manufactured in order to process and analyse images. It uses inbuilt open libraries AForge. NET (http://www.aforgenet.com/) as well as Open Source Computer Vision (http://opencv.org/). This software comprises a sequence of components hav-ing influence on the change of digital images. It also has a several dozen of functions, for example the one detecting edges from image or building learning databases ANN based on extracted features from image. It is a universal program, which has already found application in analysis – apart from potatoes – of fruit powders, among other things, strawberry powder (Przybył et al. 2018) and rhubarb powder.
[image:2.595.65.533.575.726.2]In classification, representative features of types of potato damage were gained. It was selected 102 spe-cific parameters determining, among other things, colour, shape and texture (Figure 2). All the same, the selected factors were used as input variables for simulator ANN.
Figure 1. Examples of images of defects (A) and various varieties of potatoes (B). (1) potato irregular, mechanically damaged; (2) bulb with a wet of rot; (3) bulb from dry of rot; (4) potato from mechanical damage and signs of rot; (5) developed secondary tubers; (6) the potato of rot and greening
1 2 3
4 5 6
(A) (B)
Nandina Lord Vineta
The first group of representative image features determined 4 geometric parameters (height, width, perimeter and area of the object) (variables: 1–4), 1 descriptor defining RGB described form a single number (Nowakowski et al. 2011) (variable: 5) and 48 descriptors of the image based on the histogram of colour space models, such as RGB (variables: 6–20), HSB and HSL (Hue–3 variables: min, max, mean), saturation (5 parameters), brightness (5 parameters), lightness (5 parameters) (variables: 21–38), and YCbCr (variables: 39–53) (Brancati et al. 2017). Circumference of the object was calculated using the third method of determining contour (Korohoda & Tadeusiewicz 1997). The area was calculated based on the number of pixels of the object.
The second group concerned shape factors, which are commonly used in image analysis. Shape fac-tors allow to distinguish the figures (objects) based on their shape, depicted in the digital image. As part of the research, 13 descriptors defining the shape of the empirical object were used, whose numerical values were obtained using ‘PID system’, i.e. Feret coef., circularity factor 1 and 2, Malinowska, Blair-Bliss, Danielsson, Haralick, Lp1, Lp2 and Mz coef., dimensionless shape factor, regular shape factor, compactness of shape factor (variables: 54–66) (Ko-rohoda & Tadeusiewicz 1997; Ercisli et al. 2012). The third group is defined by texture parameters, which were obtained using this software and the MATLAB environment with Haralick library. Image texture descriptors are based on the GLCM matrix (Gray-Level Co-occurrence Matrix) (Kumar et al. 2010). When specifying the texture features, GLCM calculates how often a pair of pixels of given values occurs over a strip of gray image (Clausi 2002). The measurements and statistics of representative features of texture (the value of the minimum and maximum) are based on the matrix GLCM, making a set of 36 variables such as: angular second mo-ment, contrast, correlation, sum of square variance, inverse difference moment pairs of pixels, sum of
average pairs of pixels, sum of variance, entropy, difference variance, difference entropy, and info. Measure of correlation 1 and 2, cluster prominence, cluster shade, dissimilarity, homogeneity, maximum probability and inverse difference normalized (vari-ables: 67–102) (Park et al. 2001; Lin et al. 2009). The purpose of process of image processing and analysis was to determine the geometric parameters and known factors of shape and texture (Figure 2).
Neural modeling. Artificial Neural Networks (ANN) make it possible to filter signals and elimi-nate noise (Arlorio et al. 2009). In classification problems, occurring during the process of generating models (testing, validation and verification), factors that affect the quality of the network parameters include: learning speed, size of mistake and abil-ity to generalize (Boniecki et al. 2013). In order to make an impartial evaluation of classification of food products in the agro-food sector, appropriate mathematical models are designed and developed which make it possible to support the decision-making processes using expert systems to identify fruit and vegetables (Koszela et al. 2014).
It is worth noting that classification of fruit and vegetables, including potatoes, by means of neural modeling can effectively assess their quality param-eters (Boniecki et al. 2012; Koszela et al. 2014).
The aim of designing neural models is to obtain in the process of simulation (on the basis of a set of representative features) such a model or models that have the greatest ability to classify damage and identify varieties of potatoes.
RESULTS AND DISCUSSION
Among the thousands of tested neural networks one was selected that was characterized by balancing the best quality of learning with the lowest valida-tion error (Buciński et al. 2009). It was the network of Multilayer Perceptron (MLP).
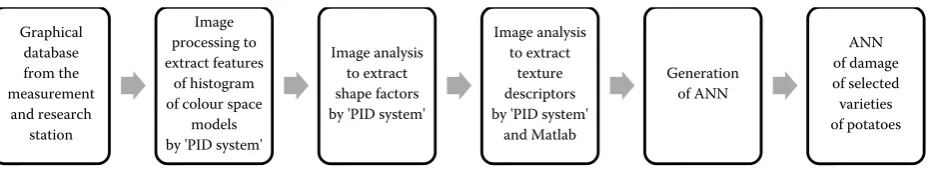
Graphical database from the measurement
and research station
Image processing to extract features
of histogram of colour space
models by 'PID system'
Image analysis to extract shape factors by 'PID system'
Image analysis to extract
texture descriptors by 'PID system'
and Matlab
Generation of ANN
ANN of damage of selected
[image:3.595.68.533.660.747.2]varieties of potatoes
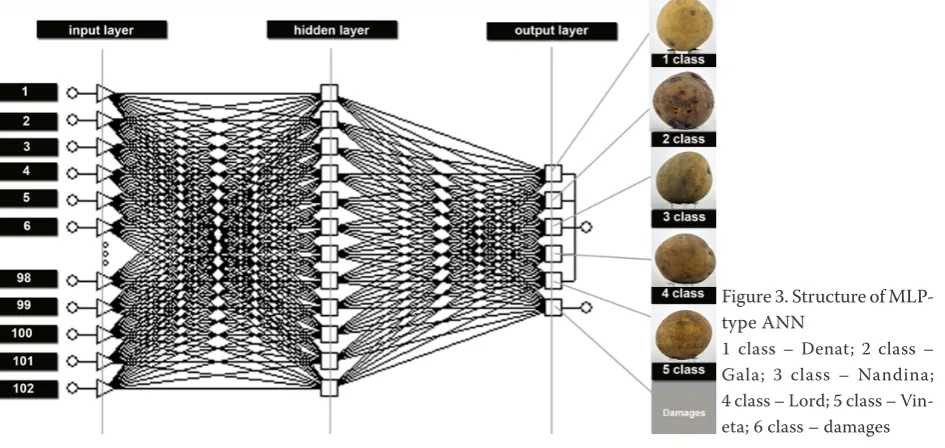
An MLP-type ANN with structure 102: 102-12-6 2, shown in Figure 3, is proved to be an adequate neu-ral network. The model of this network contained 102 input variable informative features of the image, 21356 training cases, 12 neurons in the hidden layer and 6 neurons in the output layer. The first output variable is a binary variable ‘good’ or ‘bad’, classifying the turgor of tubers with 1 neuron to 2 sets: potato damaged or not damaged. The other 5 states of the output variable ‘type’ of potato attributed to one of the 5 neurons respectively for the specific varieties.
RMS error is the summary value of the error com-mitted with regard to the training set, test and vali-dation (1) (Barile et al. 2006). Table 1 presented the resulting RMS error for an adequate MLP neural network was respectively.
In order to compare the similar neural networks used in classification problems, an example of a math-ematical model for the development of noninvasive methods for assessing the quality of oocytes was carried out, based on the graphic data encoded in the form of monochrome digital images obtained by mi-croscope. Usage also the generated network MLP 22: 22-54-4: 1, which was characterized by a low RMS error, the value of which for a validation set was adequately 0.1030 (Koszela et al. 2015). It was performed in the contrast to the MLP type network, in which a PNN-type network was obtained: 13-404-5-1. The issue related to the estimation of in-tramuscular level of marbling among white headed mutton sheep lambsu, obtained RMS error for a set of validation was at the level of 0.12 (Przybylak et al. 2016). Small values of RMS error may indicate
that both MLP neural networks possess an appropri-ate ability to generalize knowledge in classification issues, Equation (1).
RMS =
√
Σin=1( yi – zi)2 (1) nwhere: n – number of cases; yi – real values; zi – values deter-mined with ANN
The ANN value determines the number of cor-rect answers obtained by the network in comparison to the total number of responses provided in Table 1. The DLGNV training set is a collection of learning cases, which belong to 5 varieties of potatoes. An MLP-type of neural network 102: 102-12-6: 2 con-tains algorithms that optimize the ANN weightings. Backward propagation of errors (BP) is a known and proven technique for teaching about neural networks (Rumelhart et al. 1986; Chayjan et al. 2011). Table 1 depicts an algorithm BP50, i.e. the learning function, which in the first stage of learning obtained the low-est level of error in 50 training sets. The conjugate gradient algorithm (CG) is a learning function using the conjugate gradient, which is usually faster than the BP algorithm (Khadse et al. 2016). Table 1 illustrates CG254b method of training, which task was to provide the further training to the network at a later stage and obtaining the slightest error resulting in iteration 254.
[image:4.595.64.537.548.772.2]Evaluation of neural classifiers was based on an anal-ysis of sensitivity to input variables (Rad et al. 2015). The procedure of sensitivity analysis is implemented in Statistica, in order to determine the effect of empiri-cal data (input variables) on the performance of the
Figure 3. Structure of MLP-type ANN
generated mathematical model (neural classifier). It was noted that in the MLP network 102:102-12-6: 2 and in the DLGNV training set, the 102 vari-ables determining the features of the colour models, texture and shape factors had influence on the pre-cision of network. This is due to the fact that the value of the error quotient in most of these cases is higher than 1. If the value of the error ratio reached a value equal to (or less) than 1, then the selected input variable should be skipped, given that it does not affect the quality of neural model. Among the 102 representative features, input variables defining the colour space model and texture image obtained the greatest importance (rank) for the ANN. The high-est value of the error quotient was given to the input concerning the deviation of standard red (‘R_STD’) with the error quotient amounting to 1.52647. In the case of image texture, it was the variable determin-ing the extent of correlation information for 2 pairs of pixels with the minimum value (‘INF21H_MIN’), where the error ratio was 1.16930.
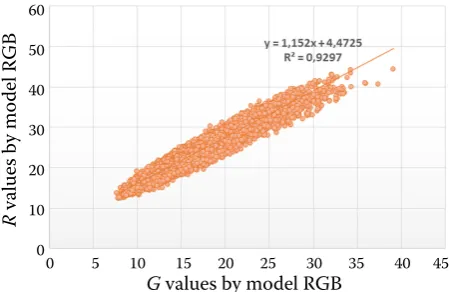
[image:5.595.64.531.125.185.2]In the basis of an analysis of sensitivity to input variables show the highest correlation between R, G, and B values from encoded information of graphical objects of model RGB using computer image analysis (Figure 4). A strong correlation was found between R and G values from model RGB (r2 = 0.9297); whereas
for R and B values, the correlation coefficient was lower (r2 = 0.6111).
CONCLUSIONS
The following conclusions can be presented: (1) The generated neural model MLP-102: 102-12-6: 2 allows to estimate the damage in selected varieties of potatoes.
(2) The analysis of the precision of neural model MLP-102: 102-12-6: 2 on the input variables showed that the following descriptors are the most important: standard deviation for red (‘R_STD’) in RGB, the standard devia-tion of the difference component of the light intensity and the colour red (‘CR_STD’) in YCbCr, the informa-tion about the extent of correlainforma-tion No. 2 for a pair of the minimum value (‘inf21h_Min’) in GLCM texture.
The generated neural model of MLP-102: 102-12-6 2 reached RMS error of 0.13.
(3) The mathematical model can provide a basis for the construction of an expert system dedicated to the purpose of identifying failures of potatoes in the agri-food sector.
References
Arlorio M., Coisson J.D., Travaglia F., Rinaldi M., Locatelli M., Gatti M., Caligiani A., Martelli A. (2009): d-amino acids and computer vision image analysis: A new tool to monitor hazelnuts roasting? Czech Journal of Food Sci-ences, 27: S30–S30.
Barile D., Coısson J.D., Arlorio M., Rinaldi M. (2006): Identi-fication of production area of Ossolano Italian cheese with chemometric complex approach. Food Control, 17: 197–206. Boniecki P., Koszela K., Piekarska-Boniecka H., Nowakows-ki K., Przybył J., Zaborowicz M., Raba B., Dach J. (2013): Identification of selected apple pests based on selected graphical parameters. In: Proceedings of the SPIE, July, 2013, Bellingham, USA: 88782S.
Boniecki P., Nowakowski K., Tomczak R., Kujawa S., Piekar-ska-Boniecka H. (2012): The application of the Kohonen neural network in the nonparametric-quality-based clas-sification of tomatoes. In: Fourth International Confer-ence on Digital Image Processing (ICDIP 2012), June 8, 2012, Kuala Lumpur, Malaysia: 833425–833427. Brancati N., De Pietro G., Frucci M., Gallo L. (2017): Human
skin detection through correlation rules between the YCb Figure 4. Correlation of parameters in RGB, coefficient
[image:5.595.65.290.588.734.2]of determination R2 = 0.9297, respectively
Table 1. Characteristics of adequate model for neural classification damage potatoes
Training set ANN of trainingQuality of validationQuality of testingQuality Training error Validation error Testing error of trainingMethod (RMS)
DLGNV MLP 102:102-12-6:2 0.9779 0.97678 0.97227 0.12959 0.13502 0.13713 CG254bBP50,
R
v
alue
s by mo
de
l R
GB
G values by model RGB 60
50
40
30
20
10
0
and YCr subspaces based on dynamic color clustering. Computer Vision and Image understanding, 155: 33–42. Buciński A., Zieliński H., Kozłowska H. (2007): Prediction
of the kind of sprouts of Cruciferae family based on ar-tificial neural network analysis. Czech Journal of Food Sciences, 25: 189–194.
Chayjan R.A., Esna-Ashari M. (2011): Effect of moisture content on thermodynamic characteristics of grape: mathematical and artificial neural network modelling. Czech Journal of Food Sciences, 29: 250–259.
Clausi D.A. (2002): An analysis of co-occurrence texture statistics as a function of grey level quantization. Cana-dian Journal of Remote Sensing, 28: 45–62.
Ercisli S., Sayinci B., Kara M., Yildiz C., Ozturk I. (2012): Determination of size and shape features of walnut ( Jug-lans regia L.) cultivars using image processing. Scientia Horticulture, 133: 47–55.
Khadse C.B., Chaudhari M.A., Borghate V.B. (2016): Conjugate gradient back-propagation based artificial neural network for real time power quality assessment. International Journal of Electrical Power & Energy Systems, 82: 197–206. Korohoda P., Tadeusiewicz R. (1997): Computer Analysis
and Image Processing. Cracow, Publishing Foundation Progress Telecom. (in Polish)
Koszela K., Boniecki P., Kuzimska T. (2015): The use of neural image analysis in the identification of information encoded in a graphical form. Agricultural Engineering, 3(155): 25–35.
Koszela K., Otrzasek J., Zaborowicz M., Boniecki P., Mueller W., Raba B., Lewicki A., Przybyl K. (2014): Quality assess-ment of microwave-vacuum dried material with the use of computer image analysis and neural model. In: Pro-ceedings of SPIE-The International Society for Optical Engineering, July, 2014: 915913. doi: 10.1117/12.2064274 Koszela K., Weres J., Boniecki P., Zaborowicz M., Przybył J.,
Dach J., Pilarski K., Janczak D. (2013): Computer image analysis in the quality in procedure for selected carrot varieties. In: Fifth International Conference On Digital Image Processing (ICDIP 2013), July 19, 2013, Beijing, China: 887811.
Kumar S., Ong S.H., Ranganath S., Chew F.T. (2010): Invari-ant texture classification for biomedical cell specimens via non-linear polar map filtering. Computer Vision and Image Understanding, 114: 44–53.
Lin H., Zhao J., Chen Q., Cai J., Zhou P. (2009): Eggshell crack detection based on acoustic impulse response and super vised pattern recognition. Czech Journal of Food Sciences, 27: 393–402
Nowakowski K., Boniecki P., Tomczak R.J., Raba B. (2011): Identification process of corn and barley kernel dam-ages using neural image analysis. In: Third International Conference on Digital Image Processing (ICDIP 2011), July 8, 2011, Chengdu, China: 80090C.
Park B., Chen Y.R. (2001): AE-automation and emerging technologies: Co-occurrence matrix texture features of multi-spectral images on poultry carcasses. Journal of Agricultural Engineering Research, 78: 127–139. Przybył K., Gawałek J., Koszela K., Wawrzyniak J., Gierz
L. (2018): Artificial neural networks and electron mi-croscopy to evaluate the quality of fruit and vegetable spray-dried powders. Case study: Strawberry powder. Computers and Elecronics in Agriculture, 155: 314–323. Przybył K., Ryniecki A., Niedbała G., Mueller W., Boniecki
P., Zaborowicz M., Koszela K., Kujawa S., Kozłowski R.J. (2016): Software supporting definition and extraction of the quality parameters of potatoes by using image analy-sis. In: Proceedings of SPIE-The International Society for Optical Engineering, 10033: 7. doi: 10.1117/12.2244050 Przybylak A., Boniecki P., Koszela K., Ludwiczak A., Zab-orowicz M., Lisiak D., Stanisz M., Ślósarz P. (2016): Estimation of intramuscular level of marbling among Whiteheaded Mutton Sheep lambs. Journal of Food En-gineering, 168: 199–204.
Przybył K., Zaborowicz M., Koszela K., Boniecki P., Muel-ler W., Raba B., Lewicki A. (2014): Organoleptic damage classification of potatoes with the use of image analysis in production process. In: Proceedings of SPIE-The In-ternational Society for Optical Engineering, 9159: 6. doi:10.1117/12.2064243
Rad M.R.N., Koohkan S., Fanaei H.R., Rad M.R.P. (2015): Application of artificial neural networks to predict the final fruit weight and random forest to select important
variables in native population of melon (Cucumis melo
L.). Scientia Horticulturae, 181: 108–112.
Riquelme M.T., Barreiro P., Ruiz-Altisent M., Valero C. (2008): Olive classification according to external damage using image analysis. Journal of Food Engineering, 87: 371–379. Rumelhart D.E., Hinton G.E., Williams R.J. (1986): Learn-ing representations by back-propagatLearn-ing errors. Nature, 323: 533–536.