J. Exp. Biol. (1966), 45, 251-267 2 5 1 With 10 text-figures
Printed in Great Britain
MEMBRANE POTENTIALS IN AMOEBA PROTEUS
BY M. S. BINGLEY
R.A.F. Institute of Aviation Medicine, Farnborough, Hants.
{Received 16 February 1966)
INTRODUCTION
252 M. S. BlNGLEY
these potential differences. It is of note that these cells were freely streaming and un-constrained in any way. Japanese work, notably that of Kishimoto (1957), indicated a possible relationship between streaming and changes of membrane potential in the slime moulds. Kamiya (1964) and Tasaki & Kamiya (1964) later attempted to con-firm the potential difference reported by Bingley & Thompson (1962) and failed to do so, Tasaki being very much concerned with the presence of a circulating current postulated by Bingley & Thompson. Barueva (1965), working on freely moving A.
proteus, was able to confirm the presence of a low membrane potential in the
pseudo-pod but explained these observations in terms of short-circuiting of the membrane potential through improper sealing of the membrane round the microelectrode in the region of the pseudopod.
Two problems face modern workers investigating membrane potentials in fresh-water A. proteus. The first is the simple fact that these cells live in fresh fresh-water and not in saline media, and the second arises from the almost universal use of hyperfine microelectrodes. Incidentally botanists face the same problems, which are complicated by the toughness of plant cell walls. Recently Bingley (19646, 1965 a) investigated the behaviour of hyperfine glass microelectrodes in solutions ranging from dilute Chalk-lev's solution on the one hand, which is one-hundredth the molarity of Ringer, to 3*0 M potassium chloride on the other. He came to the conclusion that electrode characteristics such as tip potential and electrode resistance tend to be exaggerated in very dilute solutions and are a function of external ion concentration. Changes in these could well mask bio-electric potentials encountered on passing through the mem-brane of fresh-water A. proteus. However, the author has never used hyperfine micro-electrodes for recording membrane potential in fresh-water amoebae and has always treated his electrodes to reduce resistance and tip potential by widening their tips before insertion (Bingley, 1964a, b, 1965 a). It is also noticeable that earlier workers, notably Telkes (1931), Wolfson (1943) and Riddle (1962), obtained consistent poten-tials using saline-filled microelectrodes of large diameter (100 fi) on large cells. Bingley (19656) repeated the experiments of Bingley & Thompson (1962) and presented the results in the form of photographic records, laying a great stress on the absence of tip potential and constant base-line. However, all this evidence is not as yet absolutely convincing since we have as yet no concrete proof that when low potentials are en-countered in the pseudopod the microelectrode has in reality penetrated the membrane and is not simply indenting the membrane as in the experiments on sea-urchin eggs (Hiramoto, 1959).
This paper is mainly concerned with experiments designed to test the validity of the hypothesis that the low potential recorded from an advancing pseudopod is a genuine membrane potential. In the process other observations have been made and recorded which are relevant to the process of amoeboid locomotion.
Membrane potentials in amoeba proteus
253
METHODS
Cultures of A. proteus were grown in Chalkley's medium. They were fed on
Tetra-hymena pyriformis in mass culture four times a week. The composition of Chalkley's
medium is: 1-37 HIM NaCl, 0-027 mM KC1, 0-047 m^i NaHCO3, 0-007 mM Naj,HPO4,
0-007 mM CaHPO4. All reagents used were of analytical quality. Glass-distilled water
was used throughout.
The experimental technique for recording membrane potentials has already been described (Bingley, 1964a).
Source of current
pulse Membrane potential
recorded here '(to oscilloscope) Cathode follower
voltage trace
Current Voltage electrode electrode
\
Cathode follower current trace
[image:3.451.42.409.196.460.2]Current recording (to oscilloscope)
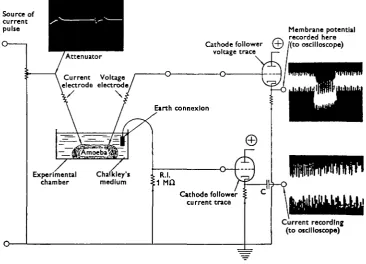
Fig. 1. The experimental technique involved in measuring the alternating voltage and current across the amoeba membrane. The current electrode is shown inserted into the amoeba. This carries the inset waveform, which is expanded to show its nature. The voltage electrode is inserted into the cell to record the membrane potential in that particular region. Superimposed on this is an alternating voltage. This.is shown from the output on the cathode follower on the voltage trace. Current passing in the system is measured by means of a second cathode follower measuring voltage across a x-o Mfl resistance, R.I. This is passed through a capacitor, C, to remove the d.c. component and a typical waveform inset is shown.
254 M- S. BlNGLEY
attached to an oscilloscope whose time-base was driven by a rotating potentiometer. By this means it was possible to produce linear sweeps as slow as i cycle in 5 min. Electrode resistance was continuously monitored throughout the experiments, in-volving single microelectrode recording by means of pulses fed at 5/sec, or 1 sec. intervals through a known value of resistance to the microelectrode via a capacitor.
Since the internal conductivity of amoeba cytoplasm is as yet not accurately known the increase of resistance recorded by the electrode after insertion through the mem-brane cannot be ascribed to any particular component in the system. Electrode resis-tance recorded when the electrode is out of the cell will be referred to as R.E.
Double microelectrode penetration
Two microelectrodes were inserted into the cell at the same time at opposite ends for the voltage/current experiments. One recorded voltage and the other served to pass current through the membrane in the form of an alternating pulse. This alternating pulse has a fast rise time and a slow exponential decay of 50 milliseconds. Since amoeba membrane has a capacitative element (Tasaki and Lamiya, 1964) measurements made with this technique will be referred to as impedances.
Figure 1 illustrates the experimental situation. An electrode connected directly to a
low-resistance source of alternating voltage (see inset waveform) is inserted into the rear region of an amoebae attached to the bottom surface of the experimental chamber. This electrode will pass current through the internal cytoplasm and surface membrane. A 1 MD resistance is inserted into the earth connexion to enable the intensity of the current to be measured on an oscilloscope through a cathode follower.
RESULTS
Penetration of the cell with two microelectrodes
An amoeba can be regarded as a more or less spherical object containing a medium which has a relatively high electrical conductivity bounded by a membrane of low conductivity sitting in a medium of very low electrical conductivity. If a voltage-recording microelectrode picks up a pulsating voltage from a previously implanted current electrode when recording low potentials in the pseudopod, there are grounds for saying that it has passed through a discrete impedance barrier. Only one structure in A. proteus has this property and that is the plasma membrane.
This series of voltage/current experiments was designed to test the hypothesis that the low potential in the tip of a streaming pseudopod is in reality a true membrane potential.
Potentials recorded from the pseudopod
Figure 2 illustrates membrane potentials recorded by the voltage microelectrode
Membrane potentials in amoeba proteus 255
produced by the voltage electrode. On penetrating the pseudopod with the voltage electrode a potential of — 20 mV. was recorded; superimposed on this is the alternating voltage, due to the current electrode, which now shows a 50 % increase in intensity but returns to its original value when the electrode is removed from the pseudopod. During the third penetration of the pseudopod the current electrode was withdrawn from the rear region. The current trace shows a return to its previous level before the current electrode is inserted into the cell. The voltage trace shows a sharp reduction in the alternating voltage recorded at this point. Calculations of membrane impedance yield values of 1-4 Mfi.
Voftage efectrode
within pseudopod
Voltage trace
Current trace
Current electrode
[image:5.451.65.389.170.415.2]within rear region Current electroderemoved
Fig. 2. Upper trace: membrane potentials recorded from the tip of an advancing pseudopod with a voltage electrode. Lower trace: current passing through the system. For details see text.
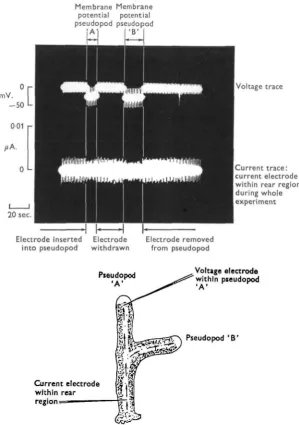
Figure 3 illustrates potentials recorded from two pseudopods on the same amoeba
respectively labelled A and B in the drawing. Throughout the duration of this experi-ment the current electrode was inserted into the rear region. Again there was an in-crease of alternating voltage superimposed on the voltage recorded by the voltage electrode when within the pseudopod. The current trace shows a decrease in current flowing through the membrane during penetration of the pseudopod. The drawing below illustrates the relative disposition of pseudopods and micro-electrodes. Mem-brane impedance as calculated during the penetration of pseudopod A is 9-0 MD and for pseudopod B, IO-I MQ.
Potentials recorded from the rear region
256 M . S. BlNGLEY
Figure 4 illustrates a potential of — 65 mV. recorded from the rear region with the
voltage electrode. During this recording the current electrode was inserted twice into an advancing pseudopod. The alternating voltage picked up by the voltage electrode increased by over 50 %; at the same time the cell potential decreased to zero in the first instance and to a few millivolts in the second instance. There was a steady decline in
Membrane Membrane potential potential pseudopod pseudopod
Voltage trace
Current trace: current electrode within rear region during whole experiment
20 sec.
Electrode inserted Electrode into pseudopod withdrawn
Electrode removed from pseudopod
Pseudopod ' A '
Current electrode within rear region •
Voltage electrode within pseudopod
Pseudopod ' B '
Fig. 3. Upper trace: membrane potentials recorded from two pseudopods on the same amoeba respectively labelled A and B in the lower drawing. Lower trace: changes of current pasting through the system. For details see text.
[image:6.451.77.377.125.550.2]Membrane potentials in amoeba proteus 257
[image:7.451.78.375.169.460.2]value after the electrode was removed. Of interest is a step potential encountered while the voltage electrode was slowly inserted into the rear region. This was followed by a spike potential whose amplitude was in exeess of 100 mV.; there was then another rapid rise of potential to a steady level. Membrane impedances associated with the penetration of the current-recording electrode are: for the first penetration, 2-0 MD -> 1-5 MD; and for the second i-o Mfl -> o-8 MD.
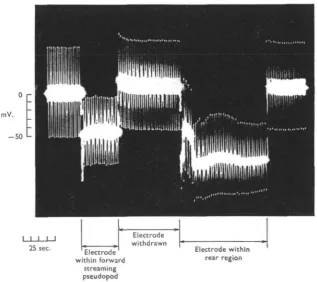
Figure 5 illustrates two recordings in the rear region with the voltage electrode
recording potentials of —60 and — 70 mV. respectively. In the first recording the
Voltage trace
//A.
Current trace
20 sec. Voltage electrode
inserted into rear region
Electrode within rear region
Current electrode inserted into
pseudopod
Voltage electrode
removed from rear region
Current electrode
removed finally
I— Current—* electrode within
pseudopod
Fig. 4. Upper trace: membrane potentials recorded from the rear region of an amoeba with the voltage electrode. Lower trace: changes of current passing through the system. For details »ee text.
current electrode was inserted into the pseudopod twice, and in the second, once. During these insertions there was a depolarization of the order of 50% of the total d.c. voltage recorded by the voltage electrode, whereas the a.c. component increased by more than 100%. The current trace showed a slight decrease in current flowing through the system during penetration. Calculations of membrane impedance during penetrations yield a constant value of 3-0 MD. Again during the initial insertion there was exhibited the characteristic pattern of the step potential followed by a spike exceeding 100 mV. in amplitude.
micro-258 M . S. BlNGLEY
electrode, but not vice versa. It was thought worth while to examine records in which the current microelectrode did not penetrate the membrane either in the pseudo-podial or the rear region to see whether this could be a response to touch.
Figure 6 illustrates a potential of - 60 mV. with its attendant step potential and
spike recorded by the voltage electrode in the rear region of a moving amoeba. The
-Voltage electrode
within rear region
Voltage electrode inserted into
Voltage electrode removed from
rear region
Voltage trace
Current trace
20 sec
Current electrode inserted into
pseudopod
Current electrode inserted into
pseudopod Current electrode
removed from pseudopod
Current electrode outside pseudopod
Current electrode removed from
pseudopod
Current electrode within pseudopod
Fig. 5. Upper trace: two recordings in the rear region with the voltage electrode. Lower trace: changes of current passing through the system. For details see text.
[image:8.451.65.391.126.502.2]Membrane potentials in amoeba proteus Igf
Figure J illustrates the reaction of a pseudopod to prolonged probing in the rear
region by the current electrode. An attempted insertion in the rear region of the amoeba is illustrated by means of a dotted line. The current pulses have been removed from the current trace in order to show small spikes which frequently appear when the current electrode is brought into contact with the membrane and thus act as markers to indicate probing. A voltage artifact was associated with this probing on the voltage trace when the voltage electrode was outside the cell; this is marked in the figure. The voltage electrode was then inserted into the pseudopod and recorded a low
Voltage electrode
inserted into rear region
"Membrane potential" within rear region
Voltage electrode removed from
expanded cell
mV.
Voltage trace
Current trace
20 sec.
[image:9.451.66.383.172.435.2]Unsuccessful attempt to penetrate pseudopod with current electrode
Fig. 6. Upper trace: membrane potential with its attendant step potential and spike, recorded from the voltage electrode in the rear region of an amoeba. The arrow on the lower trace indi-cates attempted penetration by means of the current electrode. Of note is the spike potential coincident with this. For details see text.
potential of —19 mV. Further probing in the rear with the current electrode induced a rise of potential in the pseudopod after many seconds. At the same time streaming reversed and the cell burst.
Experiments with a single microelectrode
Further study was made on potentials recorded with single microelectrodes whose resistance was monitored throughout the experiment. Special attention was paid to observations made in the rear region of moving A. proteus and to changes in resistance recorded by the electrode while within the cell.
Figure 8 illustrates membrane potentials recorded with a microelectrode whose
2 6 0 M . S. BlNGLEY
Voltage artifact associated with
placing of current electrode /
20 sec.
Current electrode in contact with membrane—rear region
Insertion of voltage electrode in slow streaming pseudopod
Voltage trace
Cell swells and bursts
Pseudopod reversing streaming direction
Current trace
Electrode withdrawn
Probing membrane of rear
region—current electrode
Fig. 7. Upper trace: reaction of a pseudopod to prolonged probing in the rear region by the current electrode. Current spikes have been removed from the lower trace in order to clarify the points when the amoeba was probed by the current-carrying microelectrode. For details see text.
mV.
-- 5 0 -
1-25 sec.
Electrode inserted into cell
Slow
inward penetration
Slow removal
Electrode within mid-rear
[image:10.451.72.384.60.295.2]region of forward streaming cell Electrode removedfrom cell
Membrane potentials in amoeba proteus
potential of — 22 mV. was recorded with a drop of the total resistance recorded by the electrode to 17-0 MQ (this is due to slight breakage of the tip on entering the cell). Further penetration of the microelectrode induced a sudden jump of potential to — 70 mV. with a further drop in the resistance recorded by the electrode to 13-4 M£2. This value was lower than when the electrode was outside the cell. On withdrawing the electrode very slowly there was a gradual decline in membrane potential with a slight increase of total resistance recorded by the electrode to 14-0 M£X On with-drawal from the cell there was an increase of resistance to 16-4 MD with a reduction of potential to zero and a return to the base-line.
mV.
- 5 0 L
25 sec. Electrode within forward
streaming pseudopod
[image:11.451.58.376.172.454.2]Electrode within rear region
Fig. 9. Potentials recorded from an advancing pseudopod followed by membrane potentials recorded from the rear region. Again of interest is the spike potential which appears on entering the pseudopod. For details see text.
Figure 9 illustrates potentials recorded from an advancing pseudopod with a
micro-electrode whose resistance (R.E.), was 12-4 Mii. On insertion into the pseudopod a potential of — 45 mV. was recorded with a drop of resistance recorded by the micro-electrode to 8-o Mfi. On removing the micromicro-electrode there was a return to its original resistance value (R.E. = 12-4 MD) and a return to the base-line. Of interest is the spike potential appearing on entering the pseudopod. On insertion into the rear region an initial negative spike potential was recorded followed by a short period when the electrode recorded a low potential of — 45 mV. The total resistance recorded by the electrode during this period was 16*4 MQ. A rapid rise of potential followed, reaching a level of — 80 mV. This was accompanied by a fall in resistance recorded by the
262 M. S. BlNGLEY
electrode to i r o M D , lower than the resistance of the microelectrode alone (R.E. = 12-4 MD). On removal of the microelectrode there was a return to the base-line and an increase of microelectrode resistance to its original value (R.E. = 12-4 MO).
If reference is made to Fig. 1 it will be seen that the pulse applied to the micro-electrode has a slow overshoot component. For purposes of measurement only the
+50 r
mV. 0
- 5 0 L
Electrode inserted
Membrane potentials in rear region
0 10
I 1
sec.
Electrode removed
Pseudopods
Plasmagel Plasmasol
Reversal of streaming coincident with reversal of membrane potential and direction of cell
movement
Streaming channels
"Microelectrode
Rear region
Clear region associated with
membrane potential reversal
[image:12.451.66.397.124.515.2]Original rear region now front region
Fig. 10. Changes in potential associated with penetration in the rear of an amoeba. Of note is the reversal of potential which is coincident with a clear region appearing round the tip of the microelectrode and reversal of streaming, as is illustrated by the two drawings. For details see text.
rising phase is used, but Fig. 9 shows this slow component to be attenuated when the microelectrode is inside the membrane.
Figure 10 illustrates a potential of — 40 to — 60 mV. recorded from the rear region
Membrane potentials in amoeba proteus 263
resistance (R.E.), was 2-0 MQ. A step potential of — 20 mV. was encountered on pene-tration and the resistance recorded by the electrode increased to 6-4 MQ. Potentials fluctuated considerably, reaching a peak of — 60 mV. at which point the resistance recorded by the microelectrode was at its maximum (16-4 MQ). This coincided with a vigorous twitching in the rear region. Thereafter potential and resistance recorded by the electrode fell to zero and 2*0 MQ respectively. A series of positive potential excursions followed which coincided with the appearance of a small clear area in the vicinity of the tip of the microelectrode (see drawing in Figure 10). The cytoplasmic streaming reversed its direction towards the rear of the cell and the resistance re-corded by the electrode fell from 2-0 to 1-5 MQ and then again to i-o MQ. On remov-ing the electrode from the cell there was a fall in positive potential to zero and the measured resistance (R.E.) of the microelectrode has now fallen to i-o MQ. On this occasion the cell did not burst but new pseudopods were formed in the tail region as shown in the drawing.
DISCUSSION
These experiments now confirm that low potentials recorded by microelectrodes in pseudopods and high potentials in the rear region are genuine membrane potentials. This experiment is the last in a long series which have already been described else-where.
It must be pointed out, however, that experiments involving double electrode penetration are extremely difficult to perform and the sensitivity of A. proteus to two microelectrodes is very much greater than to one. In the majority of experiments it was found that the response to a microelectrode carrying current when there was already a voltage electrode recording membrane potential was rapid, and the form of the amoeba was completely disrupted. Such experiments had to be discarded and only those were accepted in which the cell maintained its original streaming form. It is worth while to make a few comments on this. Normal streaming A. proteus show well-defined tubular pseudopods with hyaline caps whereas A. proteus which have been probed by many microelectrodes frequently assume a less well defined shape; their movement may persist. It does seem that potentials recorded from these latter cells are not the same as those from normal, whole, structured, streaming cells. Workers should take the utmost care when recording potentials from A. proteus so as not to induce the latter form which, although still moving, is basically structureless and can give very misleading results.
Other points of interest have emerged from these experiments. The behaviour of the current-carrying electrode is of interest when it penetrates the cell. In many cases there is an increase of current flowing through the system. Bingley (19646) showed that microelectrode resistance in saline-filled microelectrodes was progressively decreased when the external ion concentration was increased. The current-carrying electrode will encounter an increase of ion concentration when passing through the membrane and an increase in current flow is what would be expected. The insertion of a current-carrying microelectrode into a pseudopod has a pronounced depolarizing effect on membrane potentials recorded from the rear region, but not vice versa. The obvious implication is that since the current-carrying microelectrode is grounded through a low source-resistance pulse-generator (see Fig. 1) the membrane potential
264 M . S. BlNGLEY
is being shunted down this path; but why is a pseudopod not depolarized under similar conditions? Why in Fig. 2, when the current-carrying electrode is removed from the rear region, is there not a rise of potential? Fig. 4 shows a complete membrane depolarization in the rear region for a membrane resistance value of 2-0 Mfi. In order for this to be a shunting effect the current-carrying electrode would have a resistance at least as low as one-tenth that of the membrane. This yields a value of 200,000 D. This microelectrode would have such large dimensions that it would disrupt any amoeba into which it was inserted. This was clearly not so. A similar argument applied to Fig. 5, yields values for current-carrying electrode resistance required to initiate a 50% depolarization of just below that figure which is known to initiate disruptive changes in Amoeba proteus (Bingley, 1964a). These considerations led to a study of those records in which the current electrode failed to penetrate the membrane but would still serve to stimulate it both electrically and mechanically. In this case there should be no shunting effect since the membrane would remain intact in the area of electrode probing.
Fig. 6 shows in its current trace the point at which an attempted insertion was made into the pseudopod by means of a current-carrying electrode. Coincident with this there appeared a positive-going spike on the voltage trace recorded by the voltage microelectrode inserted into the rear region. Numerous other records show similar situations. This prompts the question: is it possible that a stimulus, whether electrical or mechanical, in the vicinity of the pseudopod initiates a propagated potential change travelling to the rear but not the other way round? In other words is there a polarized message-carrying system in Amoeba proteus such that the rear region is immediately electrically aware of events taking place in the vicinity of advancing pseudopods but not the other way round? Again, are these early pointers simply artifacts? Forthcoming experimental work will be designed to answer specifically these questions.
Membrane potentials in amoeba proteus 265
the cortical gel. It is possible that at this point the spike potential is initiated with the liberation of free ions to restore a high level of membrane potential. Likewise in a pseudopod which is advancing, gentle penetration at the tip produces only low mem-brane potentials. Deeper penetration leads to step-like jumps in negativity accom-panied by reversal of streaming.
Wolfson (1943) divided his membrane potential recordings from Chaos chaos into two categories. Potentials up to — 40 mV. he referred to as the low or A potentials; high ones, up to —90 mV., he referred to as B potentials. He noted that the B group of potentials were recorded when part of the gel region was sucked into the electrode. Again, was the cortical gel brought into contact with the membrane in the region of the electrode tip?
Such a mechanism as outlined above, if it were real, would be of selective value to an amoeba. The effect of depolarkation in the rear due to light touch, and the lack of effect on potential in the pseudopod region, contrasted with the rapid restoration of membrane potential in the rear and its rise in the pseudopod due to deep penetra-tion, would enable an amoeba to distinguish two types of encounter. The first a light touch, probably a food organism, would be sufficient to initiate pseudopods in the rear and not affect them in the front, but a more intense stimulation made by some pre-dator probing more deeply would initiate a spike and rapid movement away from the region stimulated, whether in the pseudopod or the rear. This model is entirely hypo-thetical but as far as evidence goes it would seem to be of biological advantage to the
organism.
The possibility has been advanced that there is a potential difference between the sol-gel interface in amoebae. To explain the potential differences existing between a pseudopod and the rear region on this assumption would necessitate the presence of a resistance barrier between the sol and the gel, otherwise the currents flowing would be excessive. Evidence does not point to the presence of this barrier. When inserting a microelectrode into the rear region there is often a decrease in resistance encountered when there is a step from low to high potential. Neither is there any electron-micro-scopic evidence of the presence of a second membrane between the sol and the gel regions (E. H. Mercer, personal communication). Workers who encounter step poten-tials when inserting microelectrodes into rear regions of amoebae should consider the possibility that these potentials are external membrane phenomena.
The observation that the amoeba membrane seems capable of attenuating the low-frequency component in the pulse applied to the voltage-recording microelectrode is an interesting one since it displays properties which are the opposite to those expected in a membrane, i.e. inductive as opposed to capacitative ones.
266 M . S. BlNGLEY
SUMMARY
1. Amoebae can be penetrated by microelectrodes at either end. One records voltage and the other supplies alternating current.
2. Step-like increases in alternating voltage superimposed on potentials recorded by the voltage electrode when in either the pseudopod or rear region demonstrate that low potentials recorded from a pseudopod and high ones from the rear region exist across a discrete impedance barrier. The only structure so far shown to fulfil this function is the plasma membrane.
3. A resistance inserted in the earth path monitors current flowing through the system and confirms observations made when recording with single electrodes that there is a reduction of electrode resistance when the cell is entered.
4. Pronounced depolarization in the rear region is shown when the current-carrying electrode penetrates the pseudopod, but not vice versa.
5. Morphological changes associated with membrane potential reversal are illustrated.
6. Consideration is given to the role of step-like potential changes in movement. This work was done under the auspices of a Government Senior Research Fellow-ship at the R.A.F. Institute of Aviation Medicine. I am grateful to Air Commodore W. K. Stewart, B.Sc, M.B., Ch.B., for help and encouragement. Likewise I would like to thank Prof. H. Holter of the Carlsberg Laboratorium, Copenhagen, Dr J. W. L. Beament, F.R.S., Department of Zoology, University of Cambridge, and Dr D. A. T. Dick, Department of Human Anatomy, University of Oxford.
My thanks are also due to Mr D. R Baillie of the Photographic Section, Mr C. W. Baker of the Workshops, and Mr S. Hunter, of the R.A.F. Institute of Aviation Medicine.
Lastly I would like to acknowledge the help of Mr Veal of Ernst Leitz Ltd, London, in the initial setting up of the optical and micromanipulative equipment.
REFERENCES
AMICI (1818). Observations on the circulation of sap in common water grass. Mem. Soc. Ital. Sci. Modena 18, 183 (quoted by Mast).
BATUEVA, I. V. (1965). The problem of the magnitude of the rest potential in Amoeba proteus. Ttitologya 6, 209-12.
BtNQLEY, M. S. (1964a). Methods for the measurement of bio-electric potentials in amoebae. Exp. Cell Res. 34, 266-82.
BINOLEY, M. S. (19646). Saline-filled microelectrodes in relation to membrane potential measurements in fresh water protozoa. Nature, Lond. aoa, 1218—19.
BENQLEY, M. S. (1965 a). The generation of potentials by glass microelectrodes due to fluid flow and applied pressure. R.A.F. Institute of Aviation Medicine Report, no. 330 (in the Press).
BINOLEY, M. S. (19656). Membrane potentials in Amoeba proteus. J. Physiol. (in the Press).
BINGLEY, M. S. & THOMPSON, C. M. (1962). Bio-electric potentials in relation to movement in amoebae. J. Theor. Bio!. 2, 16-32.
BUCHTAL, F. & PETERFI, T. (1936-37). Messungen von Potential-Differenzen an Amoeben. Protoplasma *7,
473-83-DONALDSON, P. E. K. (1958). Electronic Apparatus for Biological Research. London: Butterworth. GOLDACRE, R. J. (1952). The action of general anaesthetics on amoebae and the mechanism of the
response to touch. Symp. Soc. Exp. Biol. no. 6, 128-44.
Membrane potentials in amoeba proteus 267
HIRAMOTO, V. (1939)- Electric properties of echinoderm eggs. Embryologia 4, 219—35.
KAMIYA, N. (1964). Motive force of endoplasmic streaming in amoeba. In Primitive Motile Syttemi in Cell Biology, p. 257. New York: Academic Press.
KISHIMOTO, U. (1957)- Rhythmicity in the protoplasmic streaming of a slime mold, Pkysarum poly-cephalum. I. A statistical analysis of the electric potential rhythm. II. Theoretical treatment of the electric potential rhythm. J. Gen. Pkytiol. 41, : 205-44.
KITCHING, J. A. (1061). The physiological basis of behaviour in the protozoa. In The Cell and the Organism. Cambridge University Press.
MAST, S. O. (1926). Structure, movement, locomotion, and stimulation in amoebae. J. Morph. Phytiol. 41.
347-4*5-RIDDLE, J. (1962). Studies on the membrane potential of Pellomyxa carolinensis. Exp. Cell Ret. 36, 158-67.
TASAKI, I. & KAMIYA, N. (1964). A study on electrophysiological properties of carnivorous amoebae. J. Cell. Comp. phytiol. 63, 365-80.
TELKES, M. (1931). Bio-electrical measurements on amoebae. Amer. J. Phytiol. 98, 475-83.