Accurate methods for estimating the energy expenditure of free-ranging animals in the field are essential both for studies of foraging ecology and when constructing models of energy flux within ecosystems (Bevan et al., 1994, 1995c). Three techniques are commonly used to estimate the energy expenditure of free-ranging animals: time-energy budgets (TEBs), the doubly labelled water method (DLW) and the use of heart rate (fH). Each of the three techniques has its advantages and weaknesses when applied in the field, and so two or more are often used together.
The TEB is constructed by monitoring an animal’s activity patterns in the field, then multiplying the duration of each behaviour by its known or approximate energetic cost (Goldstein, 1988; Nagy, 1989). The TEB method is time-consuming (Weathers and Nagy, 1980; Williams and Nagy,
1984), but relatively easy to use in the field and does not require catching or handling animals.
The DLW technique is more disruptive than the TEB, as it involves catching the subject and sampling body fluid (e.g. blood), injecting isotopes of oxygen and hydrogen (H218O and either 2H
2O or 3H2O), allowing them to equilibrate with the body water, sampling body fluid again and releasing the subject. At the end of the experimental period, which depends on the biological half-life of each isotope in the study species, the subject must be recaptured and a final body fluid sample taken. The difference between the turnover rates of the 18O and 2H or 3H labels can be used to calculate the rate of carbon dioxide production (V.CO∑), and therefore energy expenditure, during the experimental period (Lifson and McClintock, 1966; Nagy, 1980; Tatner and Bryant, 1989; Speakman, 1997).
Printed in Great Britain © The Company of Biologists Limited 2000 JEB2898
The relationship between heart rate (fH) and rate of oxygen consumption (V.O∑) was established for a marine diving bird, the common eider duck (Somateria mollissima), during steady-state swimming and running exercise. Both variables increased exponentially with speed during swimming and in a linear fashion during running. Eleven linear regressions of V.O∑(ml kg−1min−1) on fH(beats min−1) were obtained: five by swimming and six by running the birds. The common regression was described by
V.O∑=10.1+0.15fH(r2=0.46, N=272, P<0.0001). The accuracy of this relationship for predicting mean V.O∑ was determined for a group of six birds by recording fH continuously over a 2-day period and comparing estimated
V.O∑ obtained using the common regression with (i) V.O∑ estimated using the doubly labelled water technique (DLW) and (ii) V.O∑measured using respirometry. A two-pool model produced the most accurate estimated V.O∑using DLW. Because of individual variability within mean values of V.O∑ estimated using both techniques, there was no significant difference between mean V.O∑estimated using fH
or DLW and measured V.O∑ values (P>0.2), although individual errors were substantially less when fHwas used rather than DLW to estimate V.O∑. Both techniques are, however, only suitable for estimating mean V.O∑for a group of animals, not for individuals.
Heart rate and behaviour were monitored during a bout of 63 voluntary dives by one female bird in an indoor tank 1.7 m deep. Tachycardia occurred both in anticipation of and following each dive. Heart rate decreased before submersion but was above resting values for the whole of the dive cycle. Mean fH at mean dive duration was significantly greater than fHwhile swimming at maximum sustainable surface speeds. Heart rate was used to estimate mean V.O∑during the dive cycle and to predict aerobic dive limit (ADL) for shallow dives.
Key words: Somateria mollissima, Branta leucopsis, Aythya fuligula, heart rate, bradycardia, tachycardia, oxygen consumption, doubly labelled water, telemetry, exercise, energy expenditure.
Summary
Introduction
ESTIMATION OF THE RATE OF OXYGEN CONSUMPTION OF THE COMMON
EIDER DUCK (SOMATERIA MOLLISSIMA), WITH SOME MEASUREMENTS OF
HEART RATE DURING VOLUNTARY DIVES
P. A. J. HAWKINS1, P. J. BUTLER1,*, A. J. WOAKES1 ANDJ. R. SPEAKMAN2
1School of Biosciences, University of Birmingham, Edgbaston, Birmingham B15 2TT, UK and 2Aberdeen Centre for
Energy Regulation and Obesity (ACERO), Department of Zoology, University of Aberdeen, Tillydrone Avenue, Aberdeen AB24 3TZ, UK
*Author for correspondence (e-mail: P.J.Butler@bham.ac.uk)
Validation studies indicate that the DLW method provides an accurate (within 5 %) estimate of CO2 production across groups of individuals, but individual estimates are less accurate (Speakman, 1997, 1998). DLW is minimally invasive and non-toxic, but expensive to apply. It also measures total field energy expenditure only, not its components. These must be estimated by using DLW in conjunction with other techniques in field bioenergetics, such as TEBs (Nagy, 1989; Tatner and Bryant, 1989).
A number of studies have investigated the relationship between fH and rate of oxygen consumption (V
. O∑) and shown that mean V.O∑ can be predicted with reasonable accuracy for a group of animals by determining mean fHand applying the previously calibrated relationship between the two variables (e.g. Bevan et al., 1992, 1994, 1995a,c; Butler et al., 1992; Nolet et al., 1992; Boyd et al., 1995). This technique is the most invasive of the three, as heart-rate loggers are usually surgically implanted (Bevan et al., 1994, 1995b,c). It has proved to be useful in the field, however, as data can be collected over relatively long periods and fH may be used to estimate components of energy expenditure (Bevan et al., 1995a; Butler et al., 1995; Boyd et al., 1999).
The V.O∑/fH relationship and the accuracy of this method of estimating V.O∑ in comparison with DLW and direct respirometry has been evaluated in two species of waterfowl: the tufted duck Aythya fuligula, a small-bodied freshwater diving duck (mass approximately 600 g; Woakes and Butler, 1983; Bevan et al., 1992), and the barnacle goose Branta leucopsis (mass approximately1780 g; Nolet et al., 1992). The present study aimed to calibrate and validate these techniques in a large, marine diving duck, the common eider (Somateria mollissima L; mass approximately1800 g) and to compare the correlations between V.O∑ and fH obtained during running and swimming exercise using a treadmill and water channel, respectively.
Heart rate was also recorded during a bout of 63 dives performed by a female bird. The first investigations into the physiology of diving were undertaken using restrained animals who were forcibly submerged (e.g. Scholander, 1940; Andersen, 1966). Those studies described a set of cardiovascular adjustments to submersion known as the ‘classic’ dive response, which includes a reduction in fHbelow the resting level, or diving bradycardia. In contrast to forced immersion, voluntary dives generally involve foraging activity, are relatively short in duration and occur in a series (Butler and Woakes, 1979). Investigations into free dives in birds using radiotelemetry (Millard et al., 1973; Butler and Woakes, 1979; Kanwisher et al., 1981; Woakes and Butler, 1983; Furilla and Jones, 1987; Stephenson et al., 1986, 1992) have shown that the cardiovascular response to voluntary dives does not correspond to the ‘classic’ pattern. For example, in the tufted duck, a period of pre-dive tachycardia ceases on submersion, but fHdoes not fall below resting levels, i.e. there is no true bradycardia (Butler and Woakes, 1979; Woakes and Butler, 1983; Stephenson et al., 1986), and blood flow to the
(locomotory) leg muscles increases to five times the resting rate (Bevan and Butler, 1992).
The differences in body size and ecology between the tufted duck and the eider duck may qualitatively or quantitatively affect the cardiovascular response to voluntary dives. Common eiders in the field have been reported to dive to depths of 60 m, although shallow dives (1–6 m) are common and the species is also often observed to dabble at low tide (Cantin et al., 1974). The present study was undertaken using a tank 1.7 m deep, so the results are applicable to shallow dives in the field but cannot be extrapolated to deeper dives.
Materials and methods Use of fHand DLW to estimate V.O∑
This section of the present study was undertaken in two parts: (1) calibration of the relationship between fH and V
. O∑ over a range of running and swimming exercise levels, and (2) validation of the accuracy of this relationship by using it to estimate V.O∑ from fH recorded continuously over a 2-day period, and comparing this with V.O∑simultaneously estimated using the DLW technique and directly measured using respirometry.
Experimental animals Rearing and husbandry
Eider duck (Somateria mollissima L.) eggs were collected from a colony on the Isle of May, Firth of Forth, Scotland, with the permission of Scottish Natural Heritage. The ducklings were imprinted on the experimenter for ease of handling and reduction of stress. Up to 8 h a day were spent with the birds during their first month, and they were taken for a daily walk for the first 6 weeks. They were initially housed in an indoor enclosure 2.1 m×3.6 m, containing a pool 2.1 m×2.2 m and 0–22 cm deep. A brooder lamp was supplied, but was only used by the birds on the first day. At 6 weeks old, they were moved to an outdoor enclosure 18 m×7.4 m×2 m (length×width× height), with an area of grass, an area of gravel and a pond 8.1 m×3.8 m×0.7 m deep. The ducklings were regularly taken into the laboratory to habituate them to the sight and sound of the experimental apparatus, but were only kept indoors when required for procedures.
plastic cable ties securely to the side of their pen and tank (Hawkins, 1998).
After studies involving the ducks had finished, the remaining birds were certified fit by a veterinary surgeon and rehomed in a private collection with the permission of the local Home Office Inspector.
Preparation for procedures
At 8 weeks of age, the first three ducks were brought inside and housed in a tank 1.6 m×1.0 m×1.7 m deep, with a dry area 1.5 m×0.6 m at one end. 10 weeks after hatching, the ducks had attained a mean body mass of 1669±33 g (mean ± 1 S.E.M.; N=10), which was 87 % of their maximum final mass. The birds were therefore deemed to be large enough for a pulse-interval-modulated electrocardiogram (ECG) radiotransmitter (mass 10 g; Butler and Woakes, 1989) to be implanted into the abdominal cavity. The implantation procedure and subsequent experimental techniques were licensed under the UK Animals (Scientific Procedures) Act 1986. All surgical procedures took place under sterile conditions and general anaesthesia, as has been described previously (Stephenson et al., 1986). Antibiotic (tetracycline, 0.1 ml kg−1) and painkiller (Temgesic, 0.1 ml kg−1) were administered intramuscularly before surgery, so that they could begin to take effect before the operation ended. Behaviour was normal following the operation except that the tail was held down for up to a day, and the duck immediately preened the abdominal feathers (none of which were removed) to cover the wound. A further dose of Temgesic was administered if the tail was still down after 24 h. 2 weeks after the transmitters had been implanted, the ducks’ mass had increased to 1791±49 g (N=10; 93 % maximum final mass), and they were used in metabolic experiments for the first time. It was originally intended that the same six ducks would be used in each section of the present study. This proved to be impossible, as four of the ducks died from aspergillosis (no results are presented here that were obtained from sick birds). Therefore, different ducks were used for calibrations using the water channel and treadmill and the DLW validations, and the N numbers vary between these treatments. This was unfortunate, but could not be avoided.
Experimental techniques Respirometry
Ducks were placed in respirometry boxes, which were either self-contained or sealed around a water channel or treadmill (see below). A flow meter (GEC Marconi Process Control Ltd) was used to measure the air drawn through the boxes by a pump (Normand Electrical Co. Ltd) at 25–30 l min−1 (exercising) or 15–20 l min−1 (resting overnight). The contents of the boxes were mixed by three fans, and the concentration of CO2 was kept below 0.5 %. A subsample of the outlet flow was dried in a column of silica gel and passed to a carbon dioxide analyser (detection range 0–1 %, Analytical Development Co.). CO2was then removed by a column of soda lime before the sample passed to an O2 analyser (detection range 0–100 %, Servomex Ltd). The sample flow was switched
either manually or, during overnight experiments, by a solenoid valve (RS Components Ltd) to sample ambient air for 2 min every 20 min, in order to allow compensation for any inherent drift in the instruments. Nitrogen dilution tests used to calibrate the system (Fedak et al., 1981) showed that there were no leaks and that the system was accurate to within 2 %. The output from the analysers entered a purpose-built interface, the output from which was displayed on a thermal chart recorder (Graphtek WR7700).
Telemetry
The signal from the radiotransmitter was passed from the receiver to a purpose-built decoder. This extracted ECG data, which were passed to a tape recorder (TEAC A450). Ambient temperature and relative humidity were measured with a probe (Vaisala, Helsinki HMP35A) inside the box. The output from the probe entered the same interface as that from the analysers. The water channel
The ducks were trained to swim on a variable-speed water channel (Armfield Engineering Ltd), with a test section 0.5 m×1.2 m×0.4 m deep. The water channel was fitted with an anti-turbulence grid, and water speed was measured by a Braystoke current flow meter (BFM0002, Valeport Developments Ltd). An open-circuit Plexiglas respirometer 0.65 m×0.45 m×0.3 m deep was placed over the bird after several training sessions. The side edges of the respirometer projected 5 cm below the surface of the water, and the front and back edges were made airtight using flexible polythene sheets. At water speeds of 1.1 m s−1and above, the system was found to leak air due to increased turbulence at the transverse seals. As the percentage of N2 lost (Fedak et al., 1981) was consistent at each of the three top speeds, correction factors could be calculated. A previous study (Woakes and Butler, 1983) found that calculations of CO2 production were inaccurate as a result of absorption of CO2 by the flowing water, so this variable was not measured.
The treadmill
The ducks were trained to run on a variable-speed treadmill (Powerjog EV2, Sports Engineering). The same respirometer box that was used on the water channel was mounted on a wooden frame 0.65 m×0.3 m×0.15 m high. The system was made airtight using brushes on the lower edges of the frame, draught excluder foam below the side edges of the box and parcel tape to seal the front and back edges. The apparatus was calibrated using N2 injection (Fedak et al., 1981), and the system was found not to leak at working speeds.
Protocols Resting fHand V.O∑
5 min period between 23:00 h and 07:00 h, so that 96 measurements were taken for each bird.
The water channel
Initially, each duck (N=5) swam between grids of plastic netting placed vertically in the flume. After 1–2 weeks of training, the ducks could swim at speeds of up to 1.3 m s−1 for 20 min. Each duck swam at a designated speed until the concentration of oxygen in the air leaving the box became constant. The duck swam for a further 20 min so that measurements could be made. Random number tables were used to determine the order of swimming speeds, so that the ducks did not become accustomed to a set pattern of speeds. However, no more than two ‘high-speed’ (1.0 m s−1 and above) swims of 20 min duration were performed without an intermediate period at low (below 0.7 m s−1) or zero speed. Each bird remained in the respirometer on the water channel for up to 3 h per day, swimming at nine different speeds, including periods of rest with the flume motor both on and off. Water temperature during experiments was 13.7–19.0 °C.
The treadmill
The experimental procedure was essentially the same as that for the flume; the birds (N=6) ran for 20 min at speeds up to 0.8 m s−1. Care was taken not to overwork them, and they had at least one slow or resting period per hour. Each duck remained on the treadmill for approximately 2 h per day. Validation of estimates of V.O∑obtained using fHand DLW against respirometry
The energy expenditure of eider ducks (N=6) estimated using DLW and the relationship with fH was compared with that obtained by respirometry over 2 days. Oxygen consumption was monitored continuously during the experiments using respirometry, and fH was recorded by transmitting ECG data to a data logger (Woakes et al., 1995) connected to the decoder using purpose-built leads.
On the first day of the procedure, the duck was weighed and a blood sample of 1 ml was taken from the brachial vein to measure background enrichment. The plasma was separated using a centrifuge at 13000 g for 5 min, then samples of approximately 10µl were flame-sealed into heparinised capillary tubes. An isotope mixture of approximately 0.3 ml kg−1 of H218O (90.02 %) and 0.15 ml kg−1 of 2HHO (99.8 %) was injected into the pectoral muscle at 10:00 h.
The first blood sample was taken 4 h after the injection, as this was an adequate time for the isotope mixture to equilibrate in barnacle geese of identical mass (Nolet et al., 1992). The duck was then immediately placed on the water channel and measurements of V.O∑and fH began. A final sample and body mass measurement were taken 48 h later. The bird was kept on the flume continuously during the experiment and exercised at various speeds for up to 6 h per day. Waterfowl diet pellets were offered inside the respirometer box, but some of the ducks refused to eat.
During the first three validations (birds 1, 2 and 6), the ducks’ feathers became damp at the end of the 48 h period on the flume. The protocol was therefore altered for the remaining three experiments (ducks 3, 10 and 11). At 20:00 h each day, the ducks were removed from the water channel and placed in the darkened respirometer box that was used for the resting measurements, with a foam rubber mat to rest on. They remained in the box until 08:00 h the following day, when they were returned to the water channel. Of the 12 h they spent on the channel, they were exercised for 6 h, as before. Although a few minutes of data were lost during the transfers, the ducks were able to preen at night, so were able to maintain the integrity of their feathers and were not stressed by becoming waterlogged on the flume (see also Nolet et al., 1992).
Calculations Respirometry
Oxygen consumption was calculated according to equation 1(d) of Withers (1977). Carbon dioxide production was calculated according to Withers (1977) and Culik et al. (1990). Results obtained during the training sessions were used to set the respiratory quotient, RQ, at 0.8 for exercising and 0.7 for resting birds.
Doubly labelled water
Plasma samples were vacuum-distilled in Pasteur pipettes (Nagy, 1983). The resultant water samples were converted to carbon dioxide or hydrogen gas for mass spectrometric analysis of 18O or 2H using the guanidine chemical conversion procedure (Boyer et al., 1961; Speakman et al., 1990) and zinc reduction (Wong and Klein, 1987), respectively. Isotope enrichments were determined by gas-source isotope-ratio mass spectrometry using a dual-inlet mass spectrometer (VG Optima, Micromass Ltd). All samples were measured relative to a working standard gas in the reference side of the inlet. The working standard was characterised relative to the international SMOW/SLAP standards provided by the International Atomic Energy Agency. Day-to-day variation in performance of the mass spectrometer was accounted for using a series of enriched internal standards of known enrichment relative to the international enriched standards (302a, 302b, 304a and 304b). Enrichments relative to SMOW/SLAP were converted to parts per million (p.p.m.) using the known absolute ratios of these standards.
equation 4; this includes the population ratio of the hydrogen and oxygen dilution spaces; (iv) Speakman et al. (1993), equation 3, with a revised dilution space ratio obtained from a large number of published studies; (v) Speakman (1997), equation i; an updated version of Lifson and McClintock (1966), equation 35, with an adjusted evaporative water loss term.
The results were converted to V.O∑using the mean measured RQ of 0.77 obtained during treadmill exercise.
Statistical analyses
Results are presented as means ±S.E.M. Differences between pairs of mean values were tested using Student’s t-tests (P<0.05), with significance levels adjusted for repeated testing using a Bonferroni correction where appropriate. In linear regressions, the Pearson product–moment correlation coefficient is given. The 95 % confidence interval for y was calculated and slopes and elevations compared according to Zar (1984, pp. 274, 300–302).
Heart rate during voluntary dives Protocol
The ducks were housed on the deep indoor tank (see above). They dived in response to mussels (Mytilus edulis) and sand eels (Ammodytes spp.) thrown onto the water and also to play with rubber bungs and stones that lay on the bottom of the tank. ECG was decoded and recorded as above. All the birds dived frequently when they were juveniles, but were reluctant to dive while an observer was present as they grew older and would not dive at all from a respirometry box. It was therefore only possible to obtain fH data from one female duck (individual 1).
Calculations
Heart rates were calculated from the ECG traces at intervals before, during and after each dive and at the instants of immersion and emersion of the duck’s head. Mean fH was
calculated for each instant in the dive cycle. Differences between pairs of mean values were tested using Student’s t-tests (P=0.05).
Results
Use of fHto estimate V.O∑
Heart rate and oxygen consumption: resting and swimming Table 1 lists the overnight resting results for six fasting ducks in air. Five birds were exercised on the water channel (Table 2). There was no significant difference between mean resting values of fHand V
.
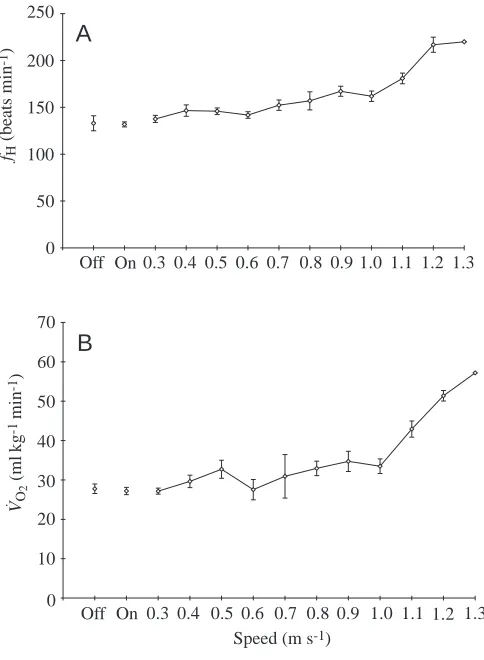
O∑measured with the flume motor on and off (paired-sample t=1.251 and 0.709, respectively; P>0.2). Mean values for fHand V.O∑at rest with the motor off were 134±16 beats min−1 and 30.6±2.6 ml kg−1min−1, respectively. Heart rate while resting on water with the fan off was 1.4 times greater than that while resting in air, and V.O∑was 2.4 times greater. Both variables increased exponentially with swimming speed above 1 m s−1(Fig. 1). No duck was able to swim at speeds over 1.3 m s−1. At the maximum speed, mean V.O∑ was 55.5±3.6 ml kg−1min−1, which was 4.3 times the overnight resting value and 1.8 times mean resting V.O∑ on water (Tables 1, 2) and mean fHwas 182±19 beats min−1, twice that when resting overnight and 1.4 times that when resting on water with the fan off.
Heart rate and oxygen consumption: running
Maximum sustainable running speeds ranged from 0.72 to 0.82 m s−1in all six ducks apart from duck 4, who would not run at speeds above 0.6 m s−1 (Table 2). The relationship between V.O∑ and speed was linear (Fig. 2). Mean V
[image:5.612.51.567.97.221.2]. O∑ at maximum speed was 39.0±2.1 ml kg−1min−1, which was 3.0 times the mean value recorded while resting overnight, while fHincreased to 195±19 beats min−1, a mean increase factor of 2.1. Mean RQ during running exercise was 0.77±0.12, which was not significantly greater than that recorded while resting overnight (t=2.279, P=0.049).
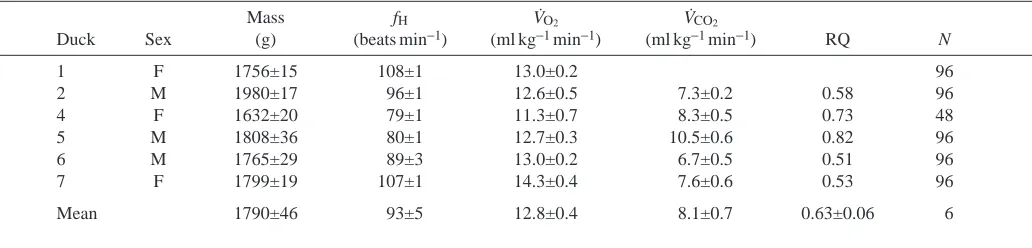
Table 1. Mean resting heart rate (fH), rate of oxygen consumption (V˙O2), rate of carbon dioxide production (V˙CO2) and
respiratory quotient (RQ) measured in air in six fasting eider ducks
Mass fH V˙O2 V˙CO2
Duck Sex (g) (beats min−1) (ml kg−1min−1) (ml kg−1min−1) RQ N
1 F 1756±15 108±1 13.0±0.2 96
2 M 1980±17 96±1 12.6±0.5 7.3±0.2 0.58 96
4 F 1632±20 79±1 11.3±0.7 8.3±0.5 0.73 48
5 M 1808±36 80±1 12.7±0.3 10.5±0.6 0.82 96
6 M 1765±29 89±3 13.0±0.2 6.7±0.5 0.51 96
7 F 1799±19 107±1 14.3±0.4 7.6±0.6 0.53 96
Mean 1790±46 93±5 12.8±0.4 8.1±0.7 0.63±0.06 6
N, number of observations; values are means ± 1 S.E.M. Measurements were made in air.
The mean mass shown for each duck is the body mass during all experiments apart from validations. The carbon dioxide analyser was not available when resting V˙O2was recorded for duck 1.
Calibration of the relationship between V.O∑and fH
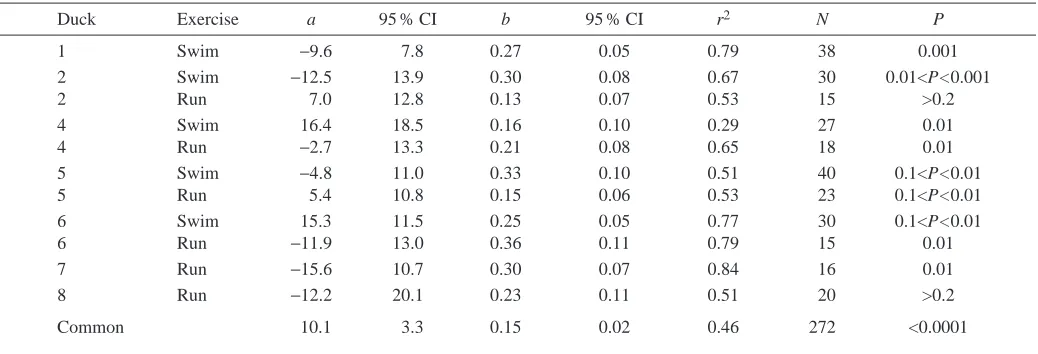
The relationship between V.O∑and fH, for all the birds, was most accurately described by a linear regression, as opposed to log-transforming either or both of the variables (Table 3). Eleven regressions of V.O∑on fHwere obtained, six by running birds on the treadmill (e.g. Fig. 3) and five by swimming them on the flume. Resting values were included in the regressions. Seven different ducks were used; four of these (ducks 2, 4, 5 and 6) were exercised on both the flume and the treadmill. A pairwise comparison (Zar, 1984) was performed on all 11 regressions. The slopes were significantly different (i.e. P<0.05) in 19 of the 55 pairs, while the intercepts were significantly different in 33 instances. Of the four ducks who both swam and ran, both the slope and intercept differed significantly between the two modes of exercise in one bird (individual 2), the intercept differed for individuals 4 and 6, and the slope differed for individual 5 (P<0.05 in each case). A multiple comparison of all 11 lines (Zar, 1984) indicated that the slopes and intercepts were significantly different (F=13.53 and 14.30, respectively; P<0.001 in each case).
[image:6.612.39.563.99.294.2]The data were initially grouped according to whether they
Table 2. Mean heart rate (fH), rate of oxygen consumption (V˙O2) and rate of carbon dioxide production (V˙CO2) during swimming
and running exercise, and respiratory quotient (RQ) during running, in seven eider ducks
Flume Treadmill
Rest Rest Swimming Running
Motor off Motor on 1.0 m s−1 1.3 m s−1 0.7–0.8 m s−1
fH V˙O2 fH V˙O2 fH V˙O2 fH V˙O2 fH V˙O2 V˙CO2
(beats (ml kg−1 (beats (ml kg−1 (beats (ml kg−1 (beats (ml kg−1 (beats (ml kg−1 (ml kg−1 Duck Sex min−1) min−1) min−1) min−1) min−1) min−1) min−1) min−1) min−1) min−1) min−1) RQ 1 F 133±8 (2) 27.8±1.2 132±3 (3) 27.2±0.9 162±6 (3) 33.5±1.9 220 (1) 57.2
2 M 165±7 (3) 32.5±1.3 164±16 (3) 35.1±1.6 170±8 (3) 40.0±1.1 203±7 (3) 54.6±4.2 268±1 (2) 39.5±2.2 33.7±0.6 0.82 4 F 174±9 (3) 39.7±2.1 176±6 (3) 38.3±1.6 179±10 (3) 47.0±1.3 196±9 (3) 59.9±2.3 207 (1) 46.6 32.6 0.70 5 M 95±4 (3) 24.6±1.3 108±3 (3) 27.3±1.7 100±2 (3) 25.9±1.9 112±1 (2) 42.2±2.5 173±15 (3) 32.2±2.6 23.6±2.4 0.73 6 M 102±16 (3) 28.4±2.4 161±5 (3) 26.5±0.7 202±12 (3) 35.4±1.5 181±10 (3) 63.6±2.1 143 (1) 39 32.5 0.83
7 F 187 (1) 40.4 29.4 0.73
8 F 191±4 (3) 36.5±0.4 29.8±0.4 0.82
Mean 134±16 30.6±2.6 148±12 30.9±2.4 163±17 36.4±3.5 182±19 55.5±3.6 195±19 39.0±2.1 30.3±1.6 0.77±0.12
N 5 5 5 5 5 5 5 5 6 6 6 6
Values are means ± 1 S.E.M. and numbers in parentheses are number of observations (N) for each duck at each speed. N=2 for duck 1 with the flume motor off because she only became settled on two occasions. Where N<3 for maximum speeds, the duck could not maintain these speeds in a steady state for three times.
Heart rate and V˙O2during swimming did not increase until speeds above 1.0 m s−1were reached. The maximum sustainable swimming speed
was 1.3 m s−1.
The maximum running speed was 0.72–0.82 m s−1for all ducks except duck 4, who refused to run at speeds above 0.6 m s−1. Consistent resting values could not be obtained on the treadmill.
0 50 100 150 200 250
0.3 0.4 0.5 0.6 0.7 0.8 0.9 1.0 1.1 1.2 1.3 fH
(beats min
-1)
o
A
B
0 10 20 30 40 50 60 70
0.3 0.4 0.5 0.6 0.7 0.8 0.9 1.0 1.1 1.2 1.3 Speed (m s-1)
VO
2
(ml
kg
-1
min
-1)
.
Off
Off On
On Fig. 1. Mean heart rate fH(A) and rate of oxygen consumption V
.
O∑
[image:6.612.317.559.416.746.2]had been obtained from swimming or running birds. The relationship between V.O∑ and fH for swimming birds was described by the equation:
V.O∑ = 10.9 + 0.16fH(r2=0.55, N=165, P<0.0001) , (1) where V.O∑is in ml kg−1min−1and fH in beats min−1, and for running birds by:
V.O∑ = 11.6 + 0.12fH(r2=0.37, N=107, P<0.0001) . (2) The slopes and intercepts of the two regressions were significantly different (F=33.16 and 147.98 respectively; P<0.0001 in each case). The six regressions obtained by
running birds and the five by swimming birds were also significantly different within their groups (running, slopes F=3.27, P=0.01; intercepts F=16.29, P<0.001; swimming, slopes F=47.43, P<0.0001; intercepts F=11.03, P<0.0001).
A common regression was obtained by pooling the data: V.O∑ = 10.1 + 0.15fH(r2=0.46, N=272, P<0.0001) . (3) The common regression line for the pooled data thus explained 46 % of the variation (Table 3; 95 % confidence interval of mean estimate of V.O∑ calculated below), whereas the regressions for data obtained by swimming and running birds explained 55 % and 37 %, respectively.
Validations Heart rate
[image:7.612.54.296.69.264.2]Table 4 lists the validation results and the accuracy of the estimated oxygen consumption for each duck. The mean estimate of V.O∑obtained using the common regression line was
Fig. 2. Rate of oxygen consumption versus running speed in an eider duck (individual 6). Mean values (±1 S.E.M.) were calculated for each speed class (N=33). The line through the points is described by the regression V.O∑=14.5U+28.8, where U is speed; r2=0.82, P=0.005.
The resting values were not included in the regression.
0 5 10 15 20 25 30 35 40 45
0 0.1 0.2 0.3 0.4 0.5 0.6 0.7
Speed (m s-1)
VO
2
(ml
kg
-1
min
-1)
[image:7.612.316.567.75.215.2].
Table 3. The relationship between rate of oxygen consumption and heart rate in seven exercising eider ducks
Duck Exercise a 95 % CI b 95 % CI r2 N P
1 Swim −9.6 7.8 0.27 0.05 0.79 38 0.001
2 Swim −12.5 13.9 0.30 0.08 0.67 30 0.01<P<0.001
2 Run 7.0 12.8 0.13 0.07 0.53 15 >0.2
4 Swim 16.4 18.5 0.16 0.10 0.29 27 0.01
4 Run −2.7 13.3 0.21 0.08 0.65 18 0.01
5 Swim −4.8 11.0 0.33 0.10 0.51 40 0.1<P<0.01
5 Run 5.4 10.8 0.15 0.06 0.53 23 0.1<P<0.01
6 Swim 15.3 11.5 0.25 0.05 0.77 30 0.1<P<0.01
6 Run −11.9 13.0 0.36 0.11 0.79 15 0.01
7 Run −15.6 10.7 0.30 0.07 0.84 16 0.01
8 Run −12.2 20.1 0.23 0.11 0.51 20 >0.2
Common 10.1 3.3 0.15 0.02 0.46 272 <0.0001
V˙O2, rate of oxygen consumption (ml kg−1min−1); fH, heart rate (beats min−1).
A linear relationship (y=a+bx), where y=V˙O2and x=fH, described the data most accurately, as opposed to an exponential, logarithmic or
power regression (95 % CI=95 % confidence intervals of the mean estimates of V˙O2). The common regression was obtained by stacking and
regressing all the data together.
0 5 10 15 20 25 30 35 40 45
80 100 120 140 160 180 200
fH (beats min-1)
VO
2
(ml
kg
-1
min
-1)
.
Fig. 3. The relationship between V.O∑ and fH in an eider duck
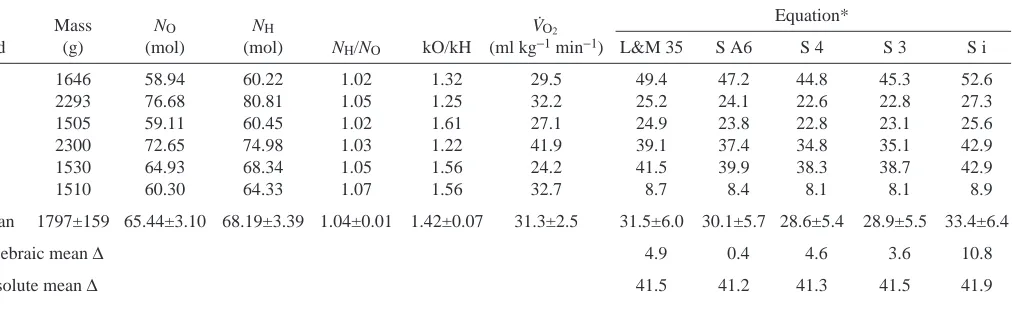
[image:7.612.50.569.515.692.2]32.3±2.6 ml kg−1min−1, which overestimated the mean measured V.O∑of 31.3±2.5 ml kg−1min−1by an algebraic mean of 3.7±4.2 %. This was not significant (paired-sample t=0.769, P>0.2). However, the individual errors ranged from −14.1 to +16.6 %, so that the mean absolute deviation (the mean average of the magnitudes of the errors) was greater, at 8.4 %. The relatively small difference between the absolute and algebraic means is due to all the estimates apart from that for duck 11 exceeding the measured value. The 95 % confidence interval of the mean estimate of V.O∑ was 6.26 ml kg−1min−1 (Zar, 1984).
DLW
[image:8.612.41.562.96.277.2]Four of the five equations estimated mean V.O∑ across individuals with an accuracy within 5 % except for Speakman (1997) equation i, which overestimated oxygen consumption by an algebraic mean of 10.8 % (Table 5). However, the absolute errors ranged from −75.2 to +71.5 %, and all five equations produced estimates with mean absolute errors over 40 %. In pairwise comparisons, the only two equations that did not produce differing mean estimates of V.O∑ significant at P=0.05 were equation S3 from Speakman et al. (1993) and equation 4 from Speakman (1993) (t=0.478; P>0.2 following Table 4. Mean oxygen consumption (V˙O2) and heart rate (fH) obtained from six eider ducks over 2 days, with estimates of V˙O2
derived from a previously calibrated relationship between V˙O2and fH(see Table 3)
Mass V˙O2 fH V˙O2est
Duck Sex (g) (ml kg−1min−1) (beats min−1) (ml kg−1min−1) ∆
1 F 1646 29.5 162 34.4 16.6
2 M 2293 32.2 164 34.7 7.8
3 F 1505 27.1 128 29.3 8.1
6 M 2300 41.9 216 42.5 1.4
10 M 1530 24.2 98 24.8 2.5
11 F 1510 32.7 120 28.1 −14.1
Mean 1797±159 31.3±2.5 148±17 32.3±2.6 3.7±4.2
Absolute mean ∆ 8.4
V˙O2est, estimated V˙O2.
Mean vales are ±S.E.M.
∆, Difference between measured and estimated V˙O2,expressed as a percentage of the measured value.
Absolute mean ∆, mean ∆, ignoring the sign of the error. For the paired t-test between V˙O2and V˙O2est: t=0.769, P>0.2.
Table 5. Estimates of oxygen consumption (V˙O2) obtained for six eider ducks over 2 days, using the doubly labelled water (DLW)
technique and five different equations
Mass NO NH Equation*
Bird (g) (mol) (mol) NH/NO kO/kH (ml kg−1min−1) L&M 35 S A6 S 4 S 3 S i
1 1646 58.94 60.22 1.02 1.32 29.5 49.4 47.2 44.8 45.3 52.6
2 2293 76.68 80.81 1.05 1.25 32.2 25.2 24.1 22.6 22.8 27.3
3 1505 59.11 60.45 1.02 1.61 27.1 24.9 23.8 22.8 23.1 25.6
6 2300 72.65 74.98 1.03 1.22 41.9 39.1 37.4 34.8 35.1 42.9
10 1530 64.93 68.34 1.05 1.56 24.2 41.5 39.9 38.3 38.7 42.9
11 1510 60.30 64.33 1.07 1.56 32.7 8.7 8.4 8.1 8.1 8.9
Mean 1797±159 65.44±3.10 68.19±3.39 1.04±0.01 1.42±0.07 31.3±2.5 31.5±6.0 30.1±5.7 28.6±5.4 28.9±5.5 33.4±6.4
Algebraic mean ∆ 4.9 0.4 4.6 3.6 10.8
Absolute mean ∆ 41.5 41.2 41.3 41.5 41.9
Mean values are ±S.E.M.
Algebraic mean ∆, mean difference between measured and estimated V˙O2(∆) expressed as a percentage of the measured value.
Absolute mean ∆, mean ∆, ignoring the sign of the error.
NO, oxygen dilution space; NH, hydrogen dilution space; kO/kH, isotope elimination rate ratio.
*Five equations were used to convert isotope enrichments (p.p.m.) to V˙O2: L&M 35, equation 35 from Lifson and McClintock (1966); S A6,
equation 6 from Schoeller et al. (1986); S 4, equation 4 from Speakman (1993); S 3, equation 3 from Speakman et al. (1993); S i, equation i from Speakman (1997).
[image:8.612.56.562.344.499.2]Bonferroni correction, Table 6). The estimate produced by equation 6 from Schoeller et al. (1986) had the lowest algebraic mean difference from measured V.O∑(Table 5), but none of the estimates using any of the equations was significantly different from the measured V.O∑ (0.052<t<0.792 for all comparisons; Bonferroni t critical value for P=0.05 is 2.750).
Comparison between the two methods and indirect calorimetry
Measured V.O∑ values were compared with estimates calculated using fHand equation 6 from Schoeller et al. (1986), which provided the estimate with the lowest algebraic mean error of the five equations used to estimate V.O∑ (Table 5). Because of the substantial range of errors within each method, there was no significant difference between values of V.O∑ obtained by respirometry, DLW or fH (P>0.2 following Bonferroni correction, 0.354<t<0.954 for all three comparisons; Bonferroni t-critical value for P=0.05 is 2.694).
Heart rate during voluntary dives The dive cycle
Dives lasted for a mean duration of 15.9±0.7 s (N=63). Dive durations ranged from 4.3 to 26 s; most dives were less than 21 s in duration. Surface intervals ranged from 0.7 to 40.8 s, with a mean of 8.9±0.8 s (N=60). The mean dive/surface cycle lasted 24.8±1.3 s (N=60).
Heart rate
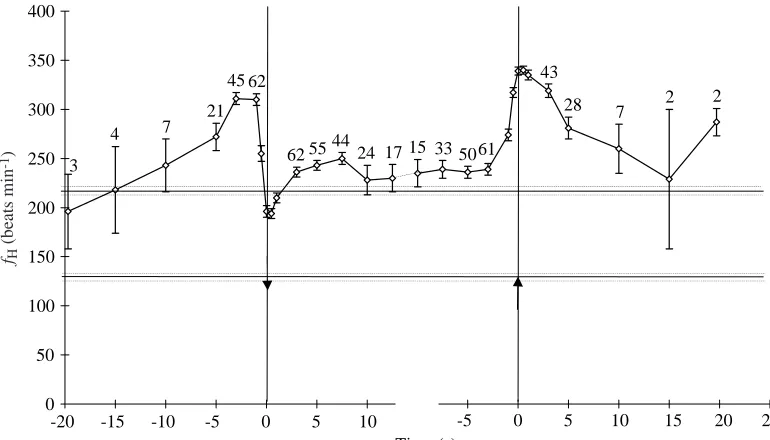
Heart rate was recorded during a bout of 63 dives (N differs at each time point due to variable dive durations and radio interference). Pre-dive fH 10 s before submersion was 243±27 beats min−1 (N=7), which was significantly greater than the mean value of 132±3 beats min−1 (N=3) recorded while the duck (individual 1) was resting on water (Fig. 4; t=4.08, P=0.01). The highest fHbefore diving was recorded 1 s before immersion of the duck’s head (310±6 beats min−1, N=62, 2.3 times resting fH). The lowest mean fHduring diving was recorded 0.5 s after immersion (194±5 beats min−1, N=63, 1.5 times resting fH).
Heart rate then increased over the next 7 s, before falling slightly and stabilising at 239±6 beats min−1 (N=50) at mean dive duration, which was significantly greater than the mean fH of 216±5 beats min−1 (N=6) recorded while the duck was swimming at speeds of 1.1–1.3 m s−1 in a water channel (t=2.94, P<0.01). Heart rate had already begun to increase 5 s before surfacing, and the highest fH recorded after her head broke the surface was 340±4 beats min−1, N=63, 2.6 times resting on water fH value. This was significantly higher than the highest pre-dive fHvalue (t=4.16, P<0.01).
[image:9.612.49.299.97.228.2]Heart rate 10 s after emersion (260±25 beats min−1, N=7) was still significantly higher than the resting value on water (t=5.08, P<0.001). Only two pauses between dives were long enough to include heart rates 15 and 20 s after surfacing. Mean fH over a whole dive cycle (a dive and the interval after it) was 259±10 beats min−1 (N=60).
Table 6. Results of pairwise comparisons between different equations for estimating V˙O2using the DLW technique
Group 1 Group 2 t-statistic Significance
L&M S A6 5.250 *
L&M S 4 4.798 *
L&M S 3 4.766 *
L&M S i 3.304 *
S A6 S 4 4.275 *
S A6 S 3 3.979 *
S A6 S i 4.102 *
S 4 S 3 0.478
S 4 S i 4.160 *
S 3 S i 4.079 *
The Bonferroni t critical value for P=0.05 is 3.070; * denotes a significant difference between two means.
See Table 5 for identification of equations.
3
4 7
21 45 62
62 554424 17 15 33 5061
43
28 7 2 2
0 50 100 150 200 250 300 350 400
-20 -15 -10 -5 0 5 10
Time (s)
fH
(beats min
-1)
-5 0 5 10 15 20 25
Fig. 4. fH (beats min−1) during
voluntary dives by a female eider duck (individual 1). Values are means ± S.E.M.
Numbers above points indicate
N; where no number is given, N=63. The instants of
immersion and emersion are shown by the downward and upward pointing arrows, respectively. The upper horizontal line is mean fH
for that individual while swimming at maximal speeds (between 1.1 and 1.3 m s−1; 216±5 beats min−1; N=6) and the lower line is resting fHon
[image:9.612.176.561.514.734.2]Oxygen consumption
The previously derived common relationship between fHand V.O∑was used to estimate V
.
O∑during diving. Mean fHover the dive/surface cycle (259±10 beats min−1, N=60) was substituted into equation 3 above, which produced an estimated mean V.O∑ value of 49.0±1.5 ml kg−1min−1.
Discussion Resting
The mean resting V.O∑ recorded from eider ducks in the present study (12.8 ml kg−1min−1, Table 1) is similar to the values obtained by substituting the mean body mass of 1.79 kg into the predictive equation for members of the anseriforms in Table 2 from Zar (1969) (13.2 ml kg−1min−1 for a resting bird) and Grubb (1983) (12.24 ml kg−1min−1 for any resting bird). The equations given in Bennett and Harvey (1987, p. 339) predict the lowest resting V.O∑ of 11.7 ml kg−1min−1, which approximated the mean for one bird in the present study.
The mean resting RQ in the eider duck was 0.63±0.06, but the lowest individual RQ was 0.51, in duck 6. Nolet et al. (1992) also reported low respiratory exchange ratios in barnacle geese (mean 0.67±0.02, N=5). However, comparatively low RQ values between 0.6 and 0.7 are thought to be normal in birds (King, 1957), perhaps due to incomplete oxidation of fat and nonpulmonary carbon dioxide loss (Chaui-Berlinck and Bicudo, 1995; Walsberg and Wolf, 1995), and this may also have explained the very low RQ values in some of the eiders.
Swimming
The exponential increase in fHand V.O∑with swimming speed (Fig. 1) has also been described in other anseriforms such as the barnacle goose (Nolet et al., 1992), tufted duck (Woakes and Butler, 1983; Butler and Turner, 1988) and mallard Anas platyrhynchos (Prange and Schmidt-Nielsen, 1970). When swimming at their maximum sustainable speed, the mean aerobic scope (V.O∑max/V.O∑rest) of the eiders was 4.3 (Tables 1, 2). This is comparable with that of other swimming anseriforms, as aerobic scopes have been recorded of 4.1 for the mallard (Prange and Schmidt-Nielsen, 1970), 3.5 for the tufted duck (Woakes and Butler, 1983), 3 for Anas superciliosa (Baudinette and Gill, 1985) and 4.9 for the barnacle goose (Nolet et al., 1992).
Running
A linear increase in V.O∑with running has been observed in all species of bird examined to date (Brackenbury, 1984) including gentoo penguins Pygoscelis papua (Bevan et al., 1995c), barnacle geese (Nolet et al., 1992) and black-browed albatross Diomedea melanophrys (Bevan et al., 1994). At maximum running speed, V.O∑max/V.O∑restwas 3.0, while mean fH increased by a factor of 2.1 (Tables 1, 2). Although the ducks appeared to be running as fast as was possible, their oxygen uptake was not elevated by as much as it was at maximum swimming speed. V.O∑and fHwere significantly higher over the
entire range of attainable speeds on the treadmill than on the flume, but heart rate was elevated relatively more than V.O∑, which may have contributed to the significant differences between regression equations 1 and 2. This effect may have been due to a fH increase that was not accompanied by a corresponding increase in V.O∑(‘additional’ heart rate), which is taken as an indicator of psychological activation and emotional states (Blix, 1974; Deroanne and Pirnay, 1978). Prolonged running is not a natural activity of the eider duck.
Calibration
The individual regressions of V.O∑ on fH had correlation coefficients ranging from 0.29 to 0.84 (Table 3). There are several sources of variation in the relationship between V.O∑and fH. Psychogenic factors such as stress and social interactions elevate fH (Owen, 1969; Eisermann, 1992), and metabolism varies diurnally and seasonally (Gessaman, 1980). The shapes and slopes of linear regressions of V.O∑ on fH vary between individuals and within the same animal at different times (Morhardt and Morhardt, 1971; Woakes and Butler, 1983) or when undertaking different forms of exercise (present study, regression equations 1 and 2). The significant but inconsistent differences between the slopes and intercepts of the regressions obtained by swimming and running eider ducks have not been reported previously in other species of bird. No significant differences were found in the relationships between V.O∑and fH obtained by walking and swimming gentoo penguins (Bevan et al., 1995c), and few differences were observed between regressions obtained from barnacle geese using these two methods (Nolet et al., 1992).
The ducks used in the present study were hand-reared in an attempt to minimise ‘additional’ heart rate, but it still remains a possibility that this is included in data obtained from some individuals while running on the treadmill or from nervous ducks such as individual 4. Heart rate depends on a variety of physiological and psychological factors, apart from the level of exercise that the animal is undergoing (Blix, 1974; Gabrielsen et al., 1977). The variety of V.O∑/fH relationships that occur in this study and in the literature emphasises the need to keep animals as calm and unstressed as possible, so that the effect of ‘additional’ fHcan be at least kept to a minimum and the well-being of the animals improved.
Validation
In agreement with many other validation studies of the DLW method (reviewed in Speakman, 1997, 1998), the arithmetic mean deviation across the group of birds was close to the reference mean determined by indirect calorimetry (<5 % difference), and was independent of the calculation method used. The best fit in this instance was provided by the Schoeller et al. (1986) equation A6, which is a two-pool model equation. Previous studies on mammals have indicated that the two-pool model equations are most appropriate for larger animals (>5 kg; Speakman, 1990, 1997); recent validations in large birds (i.e. bald eagles Haliaeetus leucocephalus weighing 4.23 kg; Dykstra et al., 1997) have confirmed that the single-pool model provides a better fit than two-single-pool equivalents. A previous validation in tufted ducks (Bevan et al., 1995a) weighing on average 0.63 kg also concluded that a single-pool model equation provided the best fit to the reference method data, but for barnacle geese (Nolet et al., 1992) weighing 1.78 kg, the best fit was provided by a two-pool calculation. This may indicate that the transition of superiority between single- and two-pool models occurs at a lower body mass in anseriforms than in other birds or mammals, but further validation is necessary to confirm this suggestion. Since two-pool model calculations provide lower estimates of energy demands than the single-pool model equations, this might have important implications for calculation of energy flows in wild anseriform birds.
Although the accuracy of the DLW method was normally better than 5 % on average across the group of birds, the individual estimates were considerably more discrepant. This has also been reported previously both in ducks (Bevan et al., 1995b) and in other species (e.g. Speakman and Racey, 1988), including man (Schoeller et al., 1986). Since individual deviations can be large, our observations confirm that this method is best suited to measurement of average energy demands across groups of animals, as has been previously emphasised (Speakman, 1998).
In the few validation studies that have been performed using active animals, the fH method for predicting energy expenditure has thus proved to be as accurate as the DLW method and to provide less variable mean estimates, if data are obtained from a sufficient number of animals and the relationship between the two variables is properly calibrated (Nolet et al., 1992; Bevan et al., 1994, 1995b,c). The fH method is also advantageous in that within-day energy expenditure during different activities can be estimated, although there may be a reduction in accuracy over very short time scales (Bevan et al., 1995c). Heart rate (and body temperature, if a thermistor is fitted; Woakes et al., 1995) can be monitored for periods of up to a year, which makes this an accurate and useful technique for long-term field studies.
Diving behaviour and heart rate
The duck was seen to inhale and exhale deeply two or three times before each dive, then exhale immediately before diving. She lunged forward and under the water, pulling herself under with half-folded wings, and dived to the bottom of the tank by
beating the (still partly folded) wings and stroking with the feet, which beat simultaneously. Ascent was entirely passive; the duck stopped beating her wings and feet and floated to the surface. This resembled the diving behaviour of the common eider duck observed by Humphrey (1958).
In the tufted duck, tachypnoea before submersion is associated with tachycardia and occurs in anticipation of diving behaviour (Butler and Woakes, 1979). Although respiratory frequency was not measured in the present study, the eider would have needed to load her oxygen stores before a diving bout (Woakes and Butler, 1983; Butler and Woakes, 1984) and remove accumulated CO2 between dives, and was seen and heard to take deep breaths before diving. Like the common eider in the present study, the tufted duck also exhales on submersion, possibly to reduce buoyancy and thus energetic costs (Butler and Woakes, 1979).
The changes in fHduring free dives to 1.7 m recorded in the female common eider in the present study were qualitatively similar to those recorded previously in free dives by the tufted duck (Butler and Woakes, 1979; Woakes and Butler, 1983; Stephenson et al., 1986; Keijer et al., 1988; Bevan and Butler, 1992), Pekin duck Anas platyrhynchos (Gabrielsen, 1985), cormorant Phalacrocorax carbo and Canada goose Branta canadensis (Kanwisher et al., 1981). Heart rate began to decrease before the moment of submersion, with a minimum value of 194±5 beats min−1recorded 0.5 s after immersion of the beak, then increased following submersion, stabilising in the latter part of the dives. Mean fHat mean dive duration was significantly greater than that while swimming at maximum sustainable surface speeds of 1.1–1.3 m s−1 (cf. Butler and Woakes, 1979; Kanwisher et al., 1981; Woakes and Butler, 1983; Gabrielsen, 1985). This result suggests that the cardiac response to voluntary (shallow) diving in the common eider may be similar to that for exercise in air, as has been proposed for other species of diving duck (Butler, 1982). The relatively higher fH during voluntary dives in comparison with Aythya spp. may occur because the pectoral muscles are active in the eider, whereas the tufted duck and pochard use the feet alone (Butler and Woakes, 1979).
Oxygen consumption and dive duration
dominant force against which ducks initially work while descending and that work against buoyancy decreases with depth (Stephenson et al., 1989; Stephenson, 1994). The mean diving V.O∑ and fH values estimated in the present study cannot, therefore, be extrapolated to deeper depths.
Keijer and Butler (1982) calculated that the maximum usable tissue oxygen store for a tufted duck is 41.5 ml kg−1. Assuming that tissue oxygen stores are similar for the common eider and substituting the estimated mean diving V.O∑value of 49.0 ml kg−1min−1, the maximum dive duration during which metabolism would be aerobic (i.e. the aerobic dive limit, ADL) would be 51 s for the bird in the present study. The dives observed in the present study were all well within the estimated ADL, as none exceeded 26 s. Although the prediction of ADL in the present study makes assumptions about diving V.O∑and O2stores in the eider, it appears likely that this species does not exceed its ADL in the field when making relatively shallow dives, which conforms to foraging strategies observed in animals diving mainly for sedentary or sessile prey (Guillemette et al., 1992).
The authors would like to thank BBSRC for funding P.A.J.H. We acknowledge the technical assistance of Peter Thomson for isotope analysis and thank Dr Mike Harris for enabling us to acquire the eggs. Special thanks to the ducks, Stephanie, Trojan, Fiona, Sappho, Hector, Nigel, ZaZa, Nightshade, Roger and Gribble, without whom this study would not have been possible.
References
Andersen, H. T. (1966). Physiological adaptations in diving
vertebrates. Physiol. Rev. 46, 212–243.
Baudinette, R. V. and Gill, P. (1985). The energetics of ‘flying’ and
‘paddling’ in water: locomotion in penguins and ducks. J. Comp.
Physiol. B 155, 373–380.
Bennett, P. M. and Harvey, P. H. (1987). Active and resting
metabolism in birds: allometry, phylogeny and ecology. J. Zool.
Lond. 213, 327–363.
Bevan, R. M. and Butler, P. J. (1992). Cardiac output and blood
flow distribution during swimming and voluntary diving of the tufted duck (Aythya fuligula). J. Exp. Biol. 168, 199–217.
Bevan, R. M., Keijer, E. and Butler, P. J. (1992). A method for
controlling the feeding behaviour of aquatic birds: heart rate and oxygen consumption during dives of different duration. J. Exp.
Biol. 168, 199–217.
Bevan, R. M., Woakes, A. J., Butler, P. J. and Boyd, I. L. (1994).
The use of heart rate to estimate oxygen consumption of free-ranging black-browed albatrosses Diomedea melanophrys. J. Exp.
Biol. 193, 119–137.
Bevan, R. M., Butler, P. J., Woakes, A. J. and Prince, P. A.
(1995a). The energy expenditure of free-ranging, black-browed albatrosses. Phil. Trans. R. Soc. B 350, 119–131.
Bevan, R. M., Speakman, J. R. and Butler, P. J. (1995b). Daily
energy expenditure of tufted ducks: a comparison between indirect calorimetry, doubly-labelled water and heart rate. Funct. Ecol. 9, 40–47.
Bevan, R. M., Woakes, A. J., Butler, P. J. and Croxall, J. P.
(1995c). Heart rate and oxygen consumption of exercising gentoo penguins. Physiol. Zool. 68, 855–877.
Blix, A. S. (1974). Additional heart rate – an indicator of
psychological activation. Aerospace Med. 45, 1219–1222.
Boyd, I. L., Woakes, A. J., Butler, P. J., Davis, R. W. and Williams, T. M. (1995). Validation of heart rate and doubly
labelled water as measures of metabolic rate during swimming in California sea lions. Funct. Ecol. 9, 151–160.
Boyd, I. L., Bevan, R. M., Woakes, A. J. and Butler, P. J. (1999).
Heart rate and behaviour of fur seals: Implications for measurement of field energetics. Am. J. Physiol. 276, H844–H857.
Boyer, P. D., Graves, D. J., Suelter, C. H. and Dempsey, M. E.
(1961). Simple procedure for conversion of oxygen of orthophosphate or water to carbon dioxide for oxygen-18 determination. Analyt. Chem. 33, 1906–1909.
Brackenbury, J. (1984). Physiological responses of birds to flight
and running. Biol. Rev. 59, 559–575.
Butler, P. J. (1982). Respiratory and cardiovascular control during
diving in birds and mammals. J. Exp. Biol. 100, 195–221.
Butler, P. J. (1993). To what extent can heart rate be used as an
indicator of metabolic rate in free-living marine mammals. Symp.
Zool. Soc. Lond. 66, 317–332.
Butler, P. J., Bevan, R. M., Woakes, A. J., Croxall, J. P. and Boyd, I. L. (1995). The use of data loggers to determine the energetics
and physiology of aquatic birds and mammals. Braz. J. Med. Biol.
Res. 28, 1307–1317.
Butler, P. J. and Turner, D. L. (1988). Effect of training on maximal
oxygen uptake and aerobic capacity of locomotory muscles in tufted ducks, Aythya fuligula. J. Physiol., Lond. 401, 347–359.
Butler, P. J. and Woakes, A. J. (1979). Changes in heart rate and
respiratory frequency during natural behaviour of ducks, with particular reference to diving. J. Exp. Biol. 79, 283–300.
Butler, P. J. and Woakes, A. J. (1984). Heart rate and aerobic
metabolism in Humboldt penguins, Spheniscus humboldti, during voluntary dives. J. Exp. Biol. 108, 419–428.
Butler, P. J. and Woakes, A. J. (1989). Telemetry. In Techniques in Comparative Respiratory Physiology: An Experimental Approach
(ed. C. R. Bridges and P. J. Butler), pp. 139–170. Cambridge: Cambridge University Press.
Butler, P. J., Woakes, A. J., Boyd, I. L. and Kanatous, S. (1992).
Relationship between heart rate and oxygen consumption during steady-state swimming in California sea lions. J. Exp. Biol. 170, 35–42.
Cantin, M., Bédard, J. and Milne, H. (1974). The food and feeding
of common eiders in the St. Lawrence Estuary in summer. Can. J.
Zool. 52, 319–334.
Chaui-Berlinck, J. G. and Bicudo, J. E. P. W. (1995). Unusual
metabolic shifts in fasting hummingbirds. Auk 112, 774–778.
Culik, B., Woakes, A. J., Adelung, D., Wilson, R. P., Coria, N. R. and Spairani, H. J. (1990). Energy requirements of Adélie
penguin (Pygoscelis adeliae) chicks. J. Comp. Physiol. B 160, 61–70.
Deroanne, R. and Pirnay, F. (1978). Cardiac response to
parachuting. In Biotelemetry IV (ed. H.-J. Klewe and H. P. Kimmich), pp. 106–108. Braunschweig: Döring.
Dykstra, C. R., Meyer, M. W. and Karasov, W. H. (1997).
Validation of the doubly-labeled water method in bald eagles (Haliaeetus leucocephalus) and a comparison of two equations for the calculation of energy expenditure. Physiol. Zool. 70, 19–26.
in wild European rabbits: predominant effect of rank position.
Physiol. Behav. 52, 33–36.
Fedak, M. A., Rome, L. and Seeherman, H. J. (1981). One-step N2
dilution technique for calibrating open-circuit VO∑ measuring
techniques. J. Appl. Physiol. 51, R772–R776.
Furilla, R. A. and Jones, D. R. (1987). The relationship between dive
and pre-dive heart rate in restrained and free dives by diving ducks.
J. Exp. Biol. 127, 333–348.
Gabrielsen, G. W. (1985). Free and forced diving in ducks:
habituation of the initial diving response. Acta Physiol. Scand. 123, 67–72.
Gabrielsen, G., Kanwisher, J. and Steen, J. B. (1977). ‘Emotional’
bradycardia: a telemetry study on incubating willow grouse (Lagopus lagopus). Acta Physiol. Scand. 100, 255–257.
Gessaman, J. A. (1980). An evaluation of heart rate as an indirect
measure of daily energy metabolism of the American kestrel.
Comp. Biochem. Physiol. 73A, 249–251.
Goldstein, D. L. (1988). Estimates of daily energy expenditure in
birds: the time-energy budget as an integrator of laboratory and field studies. Am. Zool. 28, 829–844.
Grubb, B. R. (1983). Allometric relations of cardiovascular function
in birds. Am. J. Physiol. 245, H567–H572.
Guillemette, M., Ydenberg, R. C. and Himmelman, J. H. (1992).
The role of energy intake rate in prey and habitat selection of common eiders Somateria mollissima in Winter: a risk-sensitive interpretation. J. Anim. Ecol. 61, 599–610.
Hawkins, P. (1998). Environmental stimulation for waterfowl: the
common eider duck. Anim. Technol. 49, 91–99.
Humphrey, P. S. (1958). Diving of a captive common eider. Condor 60, 408–410.
Kanwisher, J. W., Gabrielsen, G. and Kanwisher, N. (1981). Free
and forced diving in birds. Science 211, 717–719.
Keijer, E. and Butler, P. J. (1982). Volumes of the respiratory and
circulatory system in tufted and mallard ducks. J. Exp. Biol. 101, 213–220.
Keijer, E., Butler, P. J. and Woakes, A. J. (1988). Cardiac response
to voluntary diving in Tufted Ducklings (Aythya fuligula). J. Exp.
Biol. 138, 195–203.
King, J. R. (1957). Comments on the theory of indirect calorimetry
as applied to birds. Northwest. Sci. 31, 155–169.
Lemen, C. and Speakman, J. R. (1997). DLW Analysis Program.
Available at www/natureware/double. htm
Lifson, N., Gordon, G. B. and McClintock, R. (1955). Measurement
of total carbon dioxide production by D218O. J. Appl. Physiol. 7,
704–710.
Lifson, N. and McClintock, R. (1966). Theory of use of the turnover
rates of body water for measuring energy and material balance. J.
Theor. Biol. 12, 46–74.
Millard, R. W., Johansen, K. and Milsom, W. K. (1973).
Radiotelemetry of cardiovascular responses to exercise and diving in penguins. Comp. Biochem. Physiol. 46A, 227–240.
Morhardt, J. E. and Morhardt, S. S. (1971). Correlations between
heartrate and oxygen consumption in rodents. Am. J. Physiol. 221, 1580–1586.
Nagy, K. A. (1980). CO2production in animals: analysis of potential
errors in the tritiated water method. Am. J. Physiol. 238, R466–R473.
Nagy, K. A. (1983). The Doubly-labeled Water method: A Guide to its Use. Los Angeles: University of California.
Nagy, K. A. (1989). Field bioenergetics: accuracy of models and
methods. Physiol. Zool. 62, 237–252.
Nolet, B. A., Butler, P. J., Masman, D. and Woakes, A. J. (1992).
Estimation of daily energy expenditure from heart rate and doubly labeled water in exercising geese. Physiol. Zool. 65, 1188–1216.
Owen, R. B. (1969). Heart rate, a measure of metabolism in
blue-winged teal. Comp. Biochem. Physiol. 31, 431–436.
Prange, H. D. and Schmidt-Nielsen, K. (1970). The metabolic cost
of swimming in ducks. J. Exp. Biol. 53, 763–777.
Schoeller, D. A., Ravussin, E., Schutz, Y., Acheson, K. J., Baertschi, P. and Jéquier, J. (1986). Energy expenditure by
doubly labeled water: validation in humans and proposed calculation. Am. J. Physiol. 250, R823–R830.
Scholander, P. F. (1940). Experimental investigations on the
respiratory function in diving mammals and birds. Hval. Skrif. 22, 1–131.
Speakman, J. R. (1990). Principles, problems and a paradox with the
measurement of energy expenditure of free-living subjects using doubly-labelled water. Statistics Med. 9, 1365–1380.
Speakman, J. R. (1993). How should we calculate CO2production in
doubly labelled water studies of animals? Funct. Ecol. 7, 746–750.
Speakman, J. R. (1997). Doubly-labelled Water: Theory and Practice. London: Chapman and Hall.
Speakman, J. R. (1998). The history and theory of the doubly-labeled
water method. Am. J. Clin. Nutrit. 68, 932S.
Speakman, J. R., Nagy, K. A., Masman, D., Mook, W. G., Poppitt, S. D., Strathearn, G. E. and Racey, P. A. (1990). Inter-laboratory
comparison of different analytical techniques for the determination of oxygen-18 abundance. Analyt. Chem. 62, 703–708.
Speakman, J. R., Nair, K. S. and Goran, M. I. (1993). Revised
equations for calculating CO2 production from doubly labeled
water in humans. Am. J. Physiol. 264, E912–E917.
Speakman, J. R. and Racey, P. A. (1988). Validation of the
doubly-labeled water technique in small insectivorous bats by comparison with indirect calorimetry. Physiol. Zool. 61, 514–526.
Stephenson, R. (1994). Diving energetics in lesser scaup (Aythya affinis, Eyton). J. Exp. Biol. 190, 155–178.
Stephenson, R., Butler, P. J. and Woakes, A. J. (1986). Diving
behaviour and heart rate in tufted ducks (Aythya fuligula). J. Exp.
Biol. 126, 341–359.
Stephenson, R., Lovvorn, J. R, Heieis, M. R. A., Jones, D. R. and Blake, R. W. (1989). A hydromechanical estimate of the power
requirements of diving and surface swimming in lesser scaup (Aythya affinis). J. Exp. Biol. 147, 507–519.
Stephenson, R., Hendrick, M. S. and Jones, D. R. (1992).
Cardiovascular responses to diving and involuntary submergence in the Rhinoceros Auklet (Cerorhinca pallas). Can. J. Zool. 70, 2303–2310.
Tatner, P. and Bryant, D. M. (1989). Doubly-labelled water
technique for measuring energy expenditure. In Techniques in
Comparative Respiratory Physiology, SEB Seminar Series 37 (ed.
C. R. Bridges and P. J. Butler), pp. 77–112. Cambridge: Cambridge University Press.
Walsberg, G. E. and Wolf, B. O. (1995). Variation in the respiratory
quotient of birds and implications for indirect calorimetry using measurements of rate of carbon dioxide production. J. Exp. Biol.
198, 213–219.
Weathers, W. W. and Nagy, K. A. (1980). Simultaneous doubly
labeled water (3HH18O) and time-budget estimates of daily energy
expenditure in Phainopepla nitens. Auk 97, 861–867.
Williams, T. M. and Nagy, K. A. (1984). Daily energy expenditure
Withers, P. C. (1977). Measurement of VO∑, VCO∑and evaporative water
loss with a flow-through mask. J. Appl. Physiol. 42, R120–R123.
Woakes, A. J. and Butler, P. J. (1983). Swimming and diving in
tufted ducks, Aythya fuligula, with particular reference to heart rate and gas exchange. J. Exp. Biol. 107, 311–329.
Woakes, A. J., Butler, P. J. and Bevan, R. M. (1995). An
implantable data logger system for heart rate and body temperature: its application to the estimation of field metabolic rate in Antarctic predators. Med. Biol. Eng. Comput. 33, 145–151.
Wong, W. W. and Klein, P. D. (1987). A review of the techniques
for the preparation of biological samples for mass-spectrometric measurements of hydrogen-2/hydrogen-1 and oxygen-18/oxygen-16 isotope ratios. Mass Spectr. Rev. 5, 313–342.
Zar, J. H. (1969). The use of the allometric model for avian standard
metabolism-body weight relationships. Comp. Biochem. Physiol.
29, 227–234.
Zar, J. H. (1984). Biostatistical Analysis. 2nd edition. Upper Saddle