Computer-Based Tutorial in MR Imaging
Emanuel Kanal1'3 and Mark W. Perlin2
PURPOSE: To test the effectiveness of customized software as a teaching tool to help the novice understand basic physics concepts underlying the creation of MR images via various pulse sequences. METHODS: The authors have developed animating graphic and highly interactive electronic MR audiovisual software for the Macintosh computer in the C programming language, and have integrated it into the classroom setting for teaching MR imaging physics concepts such as T1, T2, T2*, proton density, RF excitation, TR, TE, Tl, flip angle, static magnetic field strength,
gradient magnetic fields, section thickness, number of phase-encoding gradients, number of
excitations, field of view, intersection gap, receiver bandwidth, contrast agent(s), etc. The program interactively demonstrates the effects of these variables upon such imaging objectives as voxel
dimensions, section quantity, total scanned volume, signal-to-noise ratio, contrast, contrast-to -noise ratios, resolving power, and scan acquisition time. Partial saturation, gradient echo, inversion recovery, and fat-saturation imaging techniques are included. Written posttests on the syllabus covered in our basic MR course were administered to three groups: 43 student professionals (technologist/physicist/radiologist) (control professional group) before, 149 student professionals
(exposed professional group) after the addition of the tutorial software into the MR course as an
integral part of the teaching process, and a group of 200 pharmaceutical sales staff with little to no prior MR or scientific background (exposed pharmaceutical group). The scores were then evaluated and compared among the groups. One hundred ten students exposed to this software
also anonymously rated the software on a 1 to 5 scale (harmful to very helpful, respectively) as
to their feeling regarding its role in their MR educational experience and the ease with which they
were able to understand the material covered in the basic MR course curriculum. RESULTS: Mean
test scores were statistically significantly lower in the Control Professional Group (60%, ± 2.59
standard error of the mean (SEM)) than in either the Exposed Pharmaceutical (73% ± 0.75 SEM) or Exposed Professional Groups (77% ± 0.99 SEM). The mean subjective assessment score
regarding the software was 4.8 (scale 1 to 5). CONCLUSION: This custom-developed interactive
MR tutorial software is demonstrated to be effective in assisting even those new to MR imaging in
understanding the concepts underlying MR imaging physics in a manner that is felt to be
significantly more palatable than lectures, articles, and/or textbooks alone.
Index terms: Education, medical; Magnetic resonance, technology; Computers, in education
AJNR 13:1527-1534, Nov /Dec 1992
We have produced computer-based animated graphic educational software to assist in the
Received May 22, 1992; revision requested July 21; revision received and accepted July 28.
1
Department of Radiology, University of Pittsburgh School of Medi-cine, Pittsburgh, PA 15213.
2
School of Computer Science, Carnegie Mellon University, Pittsburgh, PA 15213.
3
Address reprint requests and questions regarding the tutorial to Emanuel Kana!, MD, Chief, Division of Magnetic Resonance, Department of Radiology, University of Pittsburgh, The Pittsburgh NMR Institute, 3260 Fifth Avenue, Pittsburgh, PA 15213.
AJNR 13:1527-1534, Nov/Dec 1992 0195-6108/92/1306-1527 © American Society of Neuroradiology
teaching of the basic physics concepts underlying clinical magnetic resonance (MR) imaging. De-signed initially as an audiovisual teaching aide, its primary objective is to clarify the intricate inter -dependence of the multiple scan parameters both upon each other and upon the final image. It also shows their effects on critical and universal MR examination objectives, namely, resolving power, volume of tissue/patient imaged, and scan time. Because the concepts underlying clinical MR im-aging tend to be heavily based in mathematics and are both visually and conceptually complex, and because radiologists and technologists tend to be visually oriented, we felt that graphically
1528 KANAL
structuring and animating these constructs would be the most useful way to present them. Thus,
the program is an ersatz MR imager, and its use is an animated, real-time interaction between the student and the computer (imager), with the ef-fects of any variable modification graphically dis-played in real time. In effect, then, rather than trying to teach "the right way" to perform an MR
examination, the software graphically demon-strates the effects of a parameter change without requiring that the examination (read: experiment) be performed on a patient.
Materials and Methods
Implemented on a Macintosh Computer (Apple Com -puter, Cupertino, CA), the software is divided into individual "'chapters,"' each emphasizing unique aspects of the unde r-lying physics and related clinical concepts. The software requires the Macintosh operating system, version 6.0. 7 or later, is fully Multifinder and System 7 compatible, and is 32-bit "'clean."' It will run on any of the Macintosh II family of computers with a 68020, 68030, or 68040 central processing unit (CPU). The software requires 3.5 megabytes of random access memory (RAM), a 68881 or 68882 math co-processor (unless a 68040 CPU is present, which already incorporates the functionality of the math co-processor), and a color monitor with system/monitor capability set to display at least 256 colors simultaneously. No special peripheral hardware or software is required, and all the above computer system configurations are readily av ail-able. Each of the chapters is written in Think C, Version 5.0 (Symantec Corporation, Cupertino, CA), using object -oriented programming (OOP). Although others have at -tempted to develop MR tutorial software on the Macintosh using Hypercard or Supercard environments, our selection of the C (object-oriented) programming language was quite intentional. While significantly more difficult to develop, the speed with which code generated and compiled in this language could be executed would be exceptionally faster in C than in either of the other development platforms, thus permitting the rapid, real-time recalculations and dis·· plays of complex waveforms, scanned image appearance, and other such graphic outputs within the programs. The total custom-written source code for all chapters combined is presently well in excess of 12 megabytes. Once compiled as free-standing, stand-alone applications, however, even the largest single chapter and all accompanying files, when compressed, fit comfortably onto a single high-density 1.4 megabyte 3.5 inch floppy diskette.
System Design
The main goal of this software is the accurate
real-time display of the effects of changing any of the MR scan parameter options. The system's present configuration allows for the manipulation
and real-time integration, recalculation, and
ani-AJNR: 13, November /December 1992
mated display of virtually all pertinent variables. For the chapters that discuss the creation of an image involving stationary tissue, user modifiable variables are listed in Table 1.
Since most current imaging systems have 256 frequency encoding steps, the software assumes this number for all simulations; it is not yet a variable. The window and level of the displayed MR slice or phantom can be entirely defined manually by the user or can be set by either of two automated algorithms. The concept of voxel volume and its relationship to pixel intensity is introduced. The software includes a tissue library system that enables the user to select, create, edit, and delete any tissue and its associated T1, T2, T2*, and relative proton density values. Mul-tiple libraries can be created and used simulta-neously, each containing an almost unlimited number of tissues, which the user can define and redefine.
The tissue library function also stores the tissue response to the administration of any real or theoretical MR contrast agent. For example, we might want to explore images created using a theoretical contrast agent that halves T2* but has no significant effect upon T1. The user can ob-serve and make side-by-side comparisons of im-ages from various field strengths, with and
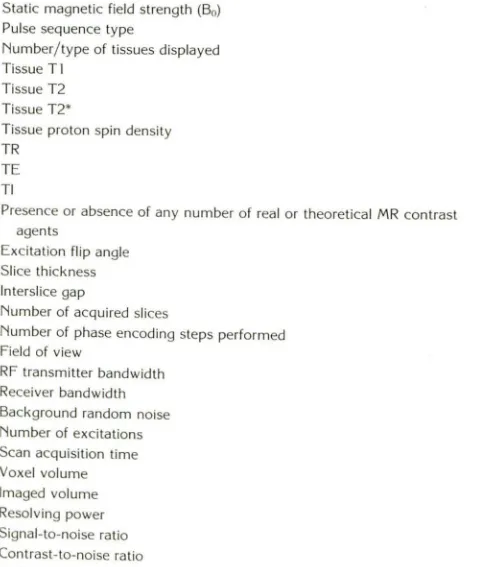
with-TABLE I: User modifiable variables
Static magnetic field strength (B0)
Pulse sequence type
Number/type of tissues displayed Tissue Tl
Tissue T2 Tissue T2*
Tissue proton spin density TR
TE Tl
Presence or absence of any number of real or theoretical MR contrast agents
Excitation flip angle Slice thickness lnterslice gap
Number of acquired slices
Number of phase encoding steps performed Field of view
RF transmitter bandwidth Receiver bandwidth Background random noise Number of excitations Scan acquisition time Voxel volume
[image:2.613.313.554.453.737.2]AJNR: 13, November/December 1992
out a contrast agent. Finally, tissues can be easily
transferred across libraries, allowing for easy and
rapid distribution and dissemination.
In the chapter discussing the generation of an echo, or signal, the mechanisms by which spin and gradient echoes are obtained are explained and graphically demonstrated. Some of the dif-ferences between gradient and spin echoes are also highlighted and displayed. In this chapter, the variables that can be manipulated include gradient strength, power /time of the 180/90° pulse, TE, TR, flip angle, and tissue types and their associated relative proton density, T 1, T2, and T2* values.
The chapter on slice selection demonstrates slice selection and excitation. As always, all per-tinent variables can be modified by the student, including, but not limited to, gradient amplitude,
slice thickness, slice location, gradient symmetry,
static magnetic field strength, and transmitted RF frequencies and bandwidth.
In the chapter on flow, factors such as flow rate, magnetic properties of the fluid itself (T1, T2, T2*, proton densities, and contrast agent response), presence or absence of contrast
agents, flow direction, viscosity, number of slices
to be excited, thickness and location of the ex
-cited slice within a multislice study, interslice gap,
excitation order, TR, TE, and RF excitatory flip angle are among the variables which can be
modified.
Imaging sequences available throughout the combined chapters include partial saturation spin echo, gradient recalled echo (both spoiled as well as nonspoiled residual transverse magnetization), fat saturation, and inversion recovery techniques,
including short Tl inversion recovery (STIR). This
has proven to be valuable since it visually shows the student how radiated energy gives rise to the image. Finally, we illustrate the difference
be-tween choosing to "spoil" or to preserve residual
transverse magnetization in gradient recalled echo imaging sequences.
One of the high points of the program is its graphic display of the proton moment vector in both the proton's spinning reference frame and
the inertial frame of the magnet (Figs. 1 and 2).
These two frames are displayed side by side for
easy comparison, allowing the student to look
back and forth between the two ·to understand
the complex motions occurring. This method has
been more fruitful, and much less instructor
in-tensive, than any lecture or other aid was have
tried to date.
TUTORIAL IN MR IMAGING 1529
Context-sensitive Help screens assist the
stu-dent throughout some of the chapters. They
explain the use of and the concepts illustrated by
the active window. They can further illustrate the
relationship of these concepts to other aspects of
clinical MR imaging.
As noted above, the main objective in the
design of the system is the accurate depiction of the result of selecting any of the virtually limitless permutations of MR scan parameter options
(Figs.
3-7)
.
To ensure that each section of theprogram is "aware" of the present status of all
other scan parameters at all times, the core of
the program is designed around a central net-work. This network is continually aware of the
status and value of every scan parameter. The
network calculates the effects of each parameter
selection and then graphically depicts those re-sults, in various ways, simultaneously. The cen-tral network processes all input and output
func-tions. The network "bottleneck" ensures
coordi-nated and simultaneous screen updates for all
parameters and graphic displays each time the student manipulates a variable. In this sense, the network corresponds to the physical reality of
matter; the program does not allow for "cheating. n
Experience to Date
We incorporated the tutorial software into the lecture series of the Magnetic Resonance Educa-tion Programs of our Division of Magnetic Reso-nance. This quarterly MR course consists of a fixed curriculum of lectures on basic MR imaging
physics. Beginning in April 1990, the course also
included a heavy emphasis on using this MR
tutorial software in the curriculum as an
audio-visual teaching aid.
The total professional experience and
knowl-edge level of the students for each course is quite
varied. We teach technologists, nurses,
physi-cians, radiologists, and physicists, as well as lay
people from pharmaceutical and MR manufac-turing companies. At the conclusion of the basic
curriculum of each course, a student must pass
a standardized written examination covering the
basic curriculum in order to receive a diploma.
The examination questions are chosen from the
same pool of 100 questions (randomized order
and order of choices in the answers), of which
half are true/false and half are multiple choice. In
the latter type, any possible combination of
se-lections, one or more, may be true. In such a
1530 KANAL AJNR: 13, November /December 1992
(udlntlon 0 nl!tUI!Oil/ (lltllntlon G IIClUIICry
TR 2500 TEl 12
\
TE2 Flip engle 90TE2 0. Flip engle 90
O
:;Q
.
_
·
Tlmf? I msec Ttme 453 mSer
Bl Tlmo Bo Bl Tlmo
rh, tu 15T Ml" fa!
1'12
l
IA/\III\1\IIiiii\A,,,... _ __ _ ~I r ~~~ . ,,.. 9Jol Tlme ~~:oM'
~====~~~=~~======~~==~=-1
2
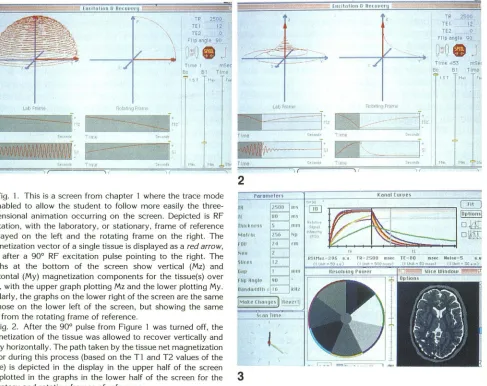
Fig. 1. This is a screen from chapter 1 where the trace mode is enabled to allow the student to follow more easily the three- rR
dimensional animation occurring on the screen. Depicted is RF rt
excitation, with the laboratory, or stationary, frame of reference rhltkneos displayed on the left and the rotating frame on the right. The "'""'"
magnetization vector of a single tissue is displayed as a red arrow, rnu
now after a 90° RF excitation pulse pointing to the right. The NoH
~lftC\
graphs at the bottom of the screen show vertical (Mz) and , 001,
horizontal (My) magnetization components for the tissue(s) over time, with the upper graph plotting Mz and the lower plotting My. Similarly, the graphs on the lower right of the screen are the same as those on the lower left of the screen, but showing the same data from the rotating frame of reference.
Fig. 2. After the 90° pulse from Figure 1 was turned off, the magnetization of the tissue was allowed to recover vertically and decay horizontally. The path taken by the tissue net magnetization vector during this process (based on the T1 and T2 values of the tissue) is depicted in the display in the upper half of the screen
and plotted in the graphs in the lower half of the screen for the
3
laboratory and rotating frames of reference.
Fig. 3. This is a typical screen appearance from chapter 4, where the parameter list is on the left, the graphically manipulable tissue relaxation and recovery curves on the upper right, scan time display on the lower left, and phantom and head slice images are on the lower middle and right of the screen, respectively.
than the correct one is chosen
,
the entire question
is marked wrong
.
Sample questions appear in
Table 2
;
each is a sample of a point covered in
th
e
first week of the course and graphically
illus-trated, and indeed explained
,
by the tu
t
orial
soft-ware
.
We compar
e
d the test results of students
tak-ing th
e
three courses held immediately before the
i
ntroduction of the tutorial softwa
r
e as part of the
cour
se
with th
e
t
e
st scores of subsequent
stu-dents who used the software e
x
tensivel
y.
The
c
urriculum and lectur
e
rs w
e
re othe
r
wise
un-c
hanged.
W
e
al
s
o t
a
ught
t
h
e
ba
s
i
c
MR course in mid
-1
99
1
to
2
00 sal
e
s r
e
presentativ
e
s of a
pharma-ce
ut
i
c
a
l
f
i
r
m in
t
h
e
sam
e
5-day time f
r
ame
,
with
exte
n
s
iv
e
in
c
orpor
a
tion of th
e
in
teract
iv
e g
raph-ics of the software into the training program
.
The
vast majority of these
individuals had had
little
or
no exposure to MR
,
clinical
or
scientific
,
before
attending this course
.
Few had advanced
techni-cal or scientific background
.
They took the same
50 question examination
as
did the professional
groups (exposed
and unexposed)
.
In addition to comparing the test grades
,
we
also assessed subjective impressions of the
use-fulness of this software
.
Students were asked to
complete (anonymously) questionnaires
regard-ing their feelregard-ings about the use
of
this software
as a teaching tool. We asked them whether the
custom-designed MR softwa
r
e tutorial
"
...
as-sisted you in your understanding
of
the
informa-tion being taught as the prospectively stated
[image:4.612.73.560.81.467.2]AJNR: 13, November /December 1992
4
5
TUTORIAL IN MR IMAGING 1531
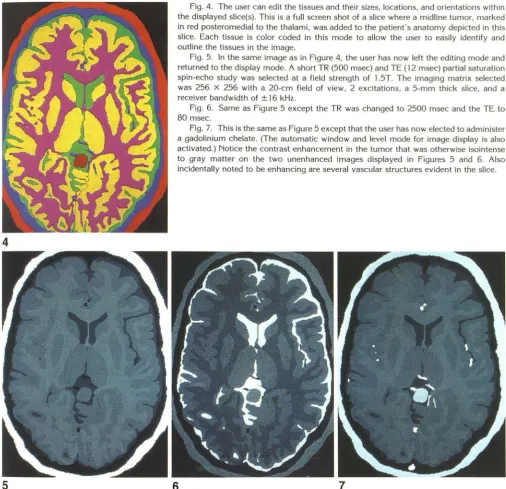
Fig. 4. The user can edit the tissues and their sizes, locations, and orientations within
the displayed slice(s). This is a full screen shot of a slice where a midline tumor, marked in red posteromedial to the thalami, was added to the patient's anatomy depicted in this slice. Each tissue is color coded in this mode to allow the user to easily identify and outline the tissues in the image.
Fig. 5. In the same image as in Figure 4, the user has now left the editing mode and
returned to the display mode. A short TR (500 msec) and TE ( 12 msec) partial saturation spin-echo study was selected at a field strength of 1.5T. The imaging matrix selected was 256 X 256 with a 20-cm field of view, 2 excitations, a 5-mm thick slice, and a
receiver bandwidth of ± 16 kHz.
Fig. 6. Same as Figure 5 except the TR was changed to 2500 msec and the TE to 80 msec.
Fig. 7. This is the same as Figure 5 except that the user has now elected to administer a gadolinium chelate. (The automatic window and level mode for image display is also activated.) Notice the contrast enhancement in the tumor that was otherwise isointense
to gray matter on the two unenhanced images displayed in Figures 5 and 6. Also incidentally noted to be enhancing are several vascular structures evident in the slice.
6
7
answered on a 1 to 5 scale, with 1 representing a hindrance to their education, 3 representing no
significant impact, and 5 representing a very
beneficial effect.
group (77.0
±
0.99 standard error of the mean(SEM) for 149 students) was higher than that of
the unexposed professional group (60.4
±
2.59SEM, for 43 students). (We found it interesting
that with the use of the tutorial software we could
actually
decrease
the course time from 7 to 5business days (by rearranging the scheduling of
some of our clinical read-out sessions to later in
our multiweek course) without a decrease in
scores.)
Results
Figure 8 shows the test scores. Of·those taking
the course in the unexposed professional group,
68% were technologists (the rest were
predomi-nantly physicians and physicists); of the exposed
professional group, 44% were technologists. The
mean test grade for the exposed professional
The mean test score for the pharmaceutical
group (73.0
±
0.75 SEM, 200 students) was [image:5.615.52.559.81.571.2]profes-1532 KANAL
TABLE 2: Sample examination questions
1. After an RF pulse, the ultimate height that the vertical component of
the tissue's magnetization is trying to attain (ie, the height that the
recovery curve in the graph is attempting to reach) is determined by the:
a) relative proton density of that tissue.
b) strength of the external magnetic field.
c) T I of that tissue.
d) a and b. e) all of the above.
2. In multislice imaging, the number of slices obtainable in a given series
is dependent upon the selected:
a) TR. b) TE.
c) receiver bandwidth.
d) shortest tissue Tl being imaged.
e) shortest tissue T2 being imaged.
3. The rate of vertical magnetization recovery:
a) is described by the Tl of that tissue.
b) is dependent upon the strength of the magnetic field to which the tissue is exposed.
c) decreases with increasing field strength. d) is also known as spin-spin relaxation.
4. The contrast to noise ratio of a specific tissue pair may be manipu
-lated by the:
a) TR.
b) TE.
c) number of phase-encoding steps. d) field of view.
e) NEX.
f) administration of exogenous contrast agents. g) slice thickness.
h) type and positioning of the specific receiver coil used.
5. The ability to detect and differentiate adjacent structures is always:
a) dependent upon the contrast-to-noise between the tissues being
examined.
b) increased with decreasing field of view.
c) increased with smaller voxels as compared to larger ones. d) improved with the administration of contrast agents.
sional group
.
Indeed
,
the pharmaceutical sales
population
,
with no prior MR knowledge and
lim
i
ted technical background
,
performed better
as a whole than did the group of professionals
with no exposure to the tutorial software.
Wh
e
n compared using an analysis of variance
and Tuk
e
y HSD multiple comparison tests
,
the
sco
res f
o
r
the une
x
posed professional group
prov
e
d to b
e
statistically significantly lower than
tho
se
of th
e
exposed professional group
(P<
.
001) or
t
h
e
pharmac
e
utical group
(P<
.
001)
.
In
te
r
est
ingl
y,
the d
i
ffe
r
enc
e
betw
e
en the scores
ach
ie
v
e
d by th
e ex
posed p
r
ofessional group and
t
ho
se
o
f t
h
e
pha
r
mac
e
utical
g
roup also d
e
mon-s
t
r
ate
d st
a
tistical
s
ignifican
ce
(P<
.01
).
AJNR: 13, November/December 1992
When students were asked whether the
cus-tom-designed MR software tutorial
"
..
.
assisted
you in your understanding of the information
being taught as the prospectively stated
objec-tives of the lecture?
",
an overwhelmining majority
of the respondents felt that the software was
quite good at clarifying the concepts rapidly and
efficiently
.
Of the 46 responses to this question,
the mean evaluation grade was 4
.
9. We asked
the same question of the students from the
phar-maceutical firm with no MR background prior to
their taking the course. Of the 64 completed
evaluations received from this group, the mean
evaluation grade was 4
.
7
.
Combining the two
groups, out of a total of 110 responses to this
question
,
the mean evaluation grade was 4. 76
.
Discussion
MR has progressed over the past decade, with
significant advances in both pulse sequence and
hardware design occurring on at least an annual
basi
s
. Soon after its introduction around
1983-1984, a working knowledge of the interactions
among TR
,
TE
,
Tl, T2, and proton spin density
values was
,
for the most part
,
sufficient to
un-derstand most of the physical interactions
under-lying this tool. Understanding the interactions
among field of view
,
slice thickness, number of
phase-encoding steps performed (Np)
,
number of
frequency-encoding samples measured per echo
,
interslice gap, and the number of excitations
(NEX) enabled the diagnostic radiologist to
com-prehend the interactions that determine image
quality and appearance
.
The past few years have seen major advances
in the diagnostic capabilities of MR. Such
ad-vances have included
:
1
.
the advent and routine clinical application
of modified flip angle gradient echo imaging
techniques
;
2
.
the availability of markedly shortened TE
and TR times as compared to those first
applied years ago
;
3
.
the appearance of contrast agents of
var-ious types and purposes
;
4. faster acquisition spin-echo techniques
,
in
-cluding:
a
.
fractional echo imaging
;
b
.
partial excitation imaging
;
c
.
the imminent introduction of ech
o
planar imaging techniques and its var
AJNR: 13, November /December 1992 TUTORIAL IN MR IMAGING 1533
100 100 100
-
"""~ =:t:.
'll:;".::t-.•
-:r::l
80 80 ,... 80
---
--=·-,....- :
_
_...._ ~;,.:. ':!:'
-==-·-
...
r+
Q) 60 ~ 60 ~ 60
...
;-....
...
0 0 0 ;
u u u
l/)
..
Vl Vl -;40 40 40
20 20 20
0 0 0
Prof. Prof. Ph arm. Prof. Prof. Pharm. Prof. Prof. Ph arm.
no with with no with with no with with
Tutor Tutor Tutor Tutor Tutor Tutor Tutor Tutor Tutor
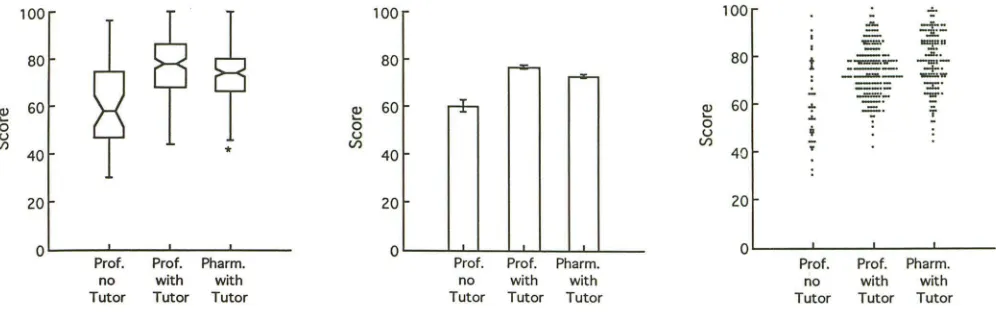
Fig. 8. Plot A is a Box Whisker Plot (first described by Tukey) of the data for the three groups. The horizontal bar in the middle of each group represents the median test score. The upper and lower horizontal bars for each group traverse the H spread (ie, the middle
50% range of the scores for each group). The waist in each plot traverses the 95% confidence interval for the median values; the fact that these do not overlap for the three groups attests to the statistically significant difference between their median values. The upper
-and lowermost extent of each plot represents the minimum and the maximum of the data (the asterisk represents a statistical outlier
for the results in that group). Plot B shows the mean test scores for the three groups compared, the professional group not exposed to
the MR tutorial software, the professional group exposed to the tutorial software, and the pharmaceutical group exposed to the software.
The error bars represent the standard error of the mean. (The standard error of the mean represents the reliability of the mean value
for each group.) Plot C represents the actual scores for each individual in the study.
5. elucidation of much of the physics
associ-ated with hemorrhages of various ages;
6
.
narrow bandwidth imaging techniques
;
7. motion suppression techniques
;
8. fat-signal cancellation techniques;
9. the investigation and clarification of much
of the physics of flow-related phenomena
in MR imaging studies, leading to the
intro-duction of MR angiography as part of the
daily routine
of
clinical MR radiologists; and
10.
advances in both RF and gradient coil
design
.
What was considered an adequate knowledge
of
MR physics in 1984 is therefore considered
elem
entary today, and what was then considered
ad
vanced or esoteric is now thought basic or
interm
ediate at best. Physicians and MR
technol-ogis
ts
who
are new to the modality in
1992
ther
efore are at a considerable disadvantage to
th
ose who began years ago, since they have to
m
aster a much larger body of knowledge to
und
erstand the processes and concepts behind
eve
n basic,
"routine"
clinical imaging sequences
use
d today
.
Many have found the computer to be a powerful
to
ol in medical education and diagnostics (1-4).
We
have developed our software in
~nattempt
t
o
address the MR growth
issues
noted above and
to
ease
the transition from neophyte to
profes-s
ion
al. The fact that the mean test score of the
t
ut
orial exposed pharmaceutical sales group
was
alm
ost as high as that of the tutorial-exposed
professional group provides evidence of the
soft-ware's ability to assist teaching the physical
phe-nomena underlying MR
,
even
to
those with little
or no scientific background. Indeed, the fact that
the pharmaceutical sales population with no prior
MR
knowledge
and limited technical background
outperformed, as a group
,
(mean
score of 73.0
for this group of 200 students) the group of
professionals with no exposure to the tutorial
software (mean score of 60.4
for
this group of
43
students) provides further evidence that reducing
these concepts to interactively animating pictures
increases
the
ease and success with which
this
knowledge can be assimilated even by those with
relatively meager scientific and
technical
back-grounds.
Limitations
It
is exceedingly difficult to control for all
pos-sibl~
variables
in age, sex, educational
back-ground, and even lecturing styles over time
be-tween the groups whose standardized MR
test
performances are being analyzed
.
Teaching
methods may have
changed
over time
,
even
t
hough the same
lecturers have taught the
course
since the mid-1980s.
It
is also possible that the
individuals making up
the
later courses
were
more
knowledgeable
and/or
intelligent than those
in the earlier courses, the latter of
which
had
no
exposure
to the
customized MR
tutorial software.
[image:7.612.56.554.80.236.2]1534 KANAL
the performance of the 200 students with little to
no technical or scientific background does
pro-vide epro-vidence of the usefulness of this teaching tool, even to nonmedical personnel. Subjective
assessments and statements overwhelmingly
at-test to the success with which this approach eases
the assimilation of the sizable MR knowledge base
in a very short time.
Future Growth
We are currently writing software to
incorpo-rate several other MR industry advances into the
main program. The first such development is the
impact of using three-dimensional Fourier
trans-form algorithms. This program simulates exciting
a volume of tissue rather than a stack of slices,
and will show how thinner slices (and more of them) can be obtained, why interslice gaps are
eliminated, why signal-to-noise ratio is improved,
how multiformatting capabilities derive from the
technique, and why this technique takes longer
than similar two-dimensional Fourier transform
sequences. Secondly, we are coding for chemical
shift effects, and the interaction between receiver
bandwidth and the strength and direction of the frequency-encoding gradient upon the
appear-ance of this effect in the image. We have already
begun the comprehensive integration of sound
files and auditory capabilities throughout the soft
-ware. This addition may prove most useful in the
integrated help system as it permits the user to
concentrate on the screen as the program's help
files "lecture" audibly to the student. This
arrange-ment has several benefits. It permits the student
to concentrate on what is being graphically
illus-trated, instead of forcing the student to
concen-trate on reading one part of the screen while, at
the same time, animating a point elsewhere on
the screen. Furthermore, audible help files permit
the screen to be more appropriately used for
graphic animation instead of for simple help text,
which may not be as effective or efficient at
"illustrating" the point being made. Animation
sounds have already been incorporated into many
other areas of the software to add to the accuracy
of the sounds for scanning modes, etc. We have
also found that playing a sound such as a digitized
camera's shutter release while the screen flashes as if a flash photograph were just taken, helps
t~
reinforce concepts such as signal sampling, whichactually occurs only at very specific times (TE),
as selected by the MR operator/student.
AJNR: 13, November /December 1992
We are already in the process of using this software as the graphical front end of an MR
expert system, as an in silica simulator. This
expert system provides actual recommendations
on how to scan (ie, it provides the values of each
possible MR imaging parameter), given diagnostic
considerations and user-controlled constraints
(eg, scan time limitations). The system predicts
how to optimize pulse sequences for various
imaging tasks and constraints. Preliminary tests
on phantoms, and more recently on humans,
have been most promising.
Conclusions
We have developed customized, computer-based, interactive MR imaging educational soft-ware targeted at giving technologists/radiologists a clearer and more comprehensive understanding of the concepts underlying the formation of a
good diagnostic clinical image. The intuitive,
in-teractive graphic interface and the rapid,
real-time update of visual material on the screen seem ideally suited to the educational process, espe-cially for radiologists and radiologic technologists who are already most comfortable dealing with
images. Our preliminary studies on over 300 of
our own students to date, as well as evaluations
by beta evaluation sites using this software in their own educational pursuits, strongly suggest that this software teaching method provides a considerable educational benefit over that
previ-ously possible with lecturers, videotapes, and/or
texts alone.
Acknowledgments
We would like to thank Joseph A. Horton, MD, for his
powerful encouragement and tireless efforts in all aspects
of the preparation of this paper. We would also like to
thank Ms Karen Pary, Administrator of the MR Education
Programs, for her considerable assistance with the records and data used herein. We would also like to recognize and
thank Dr Anne Osborn who planted the seed for the entire
article. This project was funded in part by grants from
General Electric Medical Systems and Squibb Diagnostics.
References
1. Arenson RL. Teaching with computers. Radio/ Clin North Am
1986;24:97-1 03
2. Greenes RA, Shortliffe HS. Medical informatics: an emerging aca
-demic discipline and institutional priority. JAMA 1990;263:
1114-1120
3. Jaffe CC, Lynch PJ, Smeulders AWM. Hypermedia techniques for
diagnostic imaging instruction: videodisk echocardiography encyclo·
pedia. Radiology 1989;171:475-480
4. Tessler FN. Computer applications in radiology education: a challeng~