printed in Great Britain
INHIBITION AND EXCITATION IN THE
LOCUST DCMD RECEPTIVE FIELD:
SPATIAL FREQUENCY, TEMPORAL AND
SPATIAL CHARACTERISTICS
BY ROBERT B. PINTER
Departments of Electrical Engineering and Zoology, University of Washington, FT-10, Seattle, Washington 98195
(Received 8 August 1978)
SUMMARY
1. The descending contralateral movement detector (DCMD) of the locust responds vigorously to small target (ca. 5°) stimuli; this response is inhibited by simultaneous or subsequent rotation of a radial grating (wind-mill) pattern (subtending 19-900 of visual angle) and suppressed by earlier rotation,
2. The excitation produced in the DCMD by rotation of a radial grating pattern depends only on the spatial frequency of the stripes of the pattern, and is independent of pattern size, and of temporal frequency over the range of low values used.
3. The inhibition produced by this same stimulus similarly depends only on the spatial frequency of the stripes of the pattern, independent of pattern size, and of temporal frequency over the range of low values used.
4. As the radial grating excitation decreases with increasing spatial frequency, the inhibition increases until limited by optical and neural resolution.
5. For spatial frequencies of the radial grating pattern below 0-05 cyc/deg the radial grating patterns become excitatory. Above 0^05 cyc/deg they are inhibitory. This is the point in spatial frequency below which inhibitory grating ' backgrounds' become excitatory target*.
6. Inhibition decreases as the size of the radial grating pattern is decreased below 190 visual angle; at 8° or less no inhibition can be found at any spatial frequency.
7. Inhibition is greater in the posterior than anterior regions of the receptive field, and greater in the ventral than the dorsal regions.
8. Inhibition decreases as the distance between small target and the radial grating is increased, but this is influenced by the local variations of excitation and inhibition.
9. Habituation is often greater for small target and low-frequency radial grating response than for inhibited small target and high frequency grating response.
10. These results substantiate previously proposed lateral inhibition models of the acridid movement detector system.
INTRODUCTION
Extensive studies have clearly shown the preference of the acridid movement detector system for small field stimuli (Palka, 1967, 1969; Rowell, 1971; Rowell, O'Shea & Williams, 1977) and have shown the inhibition of response to small field stimuli by large field stimuli (Palka, 1972; O'Shea & Rowell, 1975). Large field stimuli can be either simple dimming (Palka, 1967) or fields of moving stripes (Palka, 1969, 1972; O'Shea & Rowell, 1975; Rowell, O'Shea & Williams, 1977; Pinter, 1977). Considerable progress has been made in anatomical localization of certain sites of this inhibition (Rowell, O'Shea & Williams, 1977; O'Shea & Rowell, 1976).
Stimuli intermediate in size between large and small field have been used to determine the visual acuity of the locust {Schistocerca gregaria) by measuring responses of the DCMD (Palka & Pinter, 1975). These stimuli were radial grating patterns, each composed of black and white stripes arranged in a windmill pattern rotated about its centre. They were used in preference to spatially truncated rectangular gratings because they do not have low spatial frequency components, which generate artifacts (Palka, 1965). As discussed in the Appendix, precision radial grating patterns contain spatial frequencies only above approximately that spatial frequency defined by the reciprocal of the chord distance subtended by one stripe cycle at the outermost edge of the pattern. This feature makes them useful for determining spatial frequency dependent properties of visual systems.
Palka (1967) observed that dimming a large uniform target blocked DCMD response to dimming of a small target, and during experiments performed to measure locust visual acuity, it was observed that the response to rotation of the radial grating pattern was never sustained, as it is to movement of a small target. These observations suggested that response to rotation of these gratings might contain both excitatory and inhibitory components, and if so, that the inhibitory components might reduce the response elicited by the simultaneous presentation of another primarily excitatory small target stimulus. The inhibition has since been studied and found to depend primarily on the spatial frequency content of the radial grating pattern (Pinter, 1977). In this paper I attempt to determine the relationship between this excitation and inhibition as a function of spatial frequency, temporal frequency, pattern size, time, and position in the receptive field. These are important factors in deriving lateral inhibition models of the response of the DCMD to visual stimuli of any kind. Lateral inhibition is thought to be the mechanism responsible for the capability of the DCMD to discriminate between small and large field stimuli (Rowell et al. 1977).
The neurone antecedent to the DCMD is the lobula giant movement detector (LGMD) which samples activity across the entire visual field via its fan of dendrites in the lobula; the DCMD follows spikes in the LGMD one for one via an electrical synapse (O'Shea & Rowell, 1975). There is lateral inhibition peripheral to the fan of dendrites of the LGMD (preconvergence inhibition), and in addition the LGMD receives one or more direct inhibitory inputs (postconvergence inhibition) which sample activity across the entire visual field. The postconvergence inhibition appears in the LGMD as IPSPs, but only at high temporal frequencies of visual stimulation (Rowell et al. 1977).
emporal frequency of variation in light intensity viewed by a retinular cell of one ommatidium. In all experiments described below, the range of temporal frequency is from 0-52 to 4 7 Hz, probably below that required to produce postconvergence inhibition and IPSPs in the LGMD. The inhibition found in the experiments reported below is thus occurring peripheral to the fan of LGMD dendrites in the lobula, probably in the medulla.
It is important to note that Rowell et al. (1977) define temporal frequency as twice the frequency of the variation in light intensity. All of their numerical values of temporal frequency must be halved to compare with the results presented below.
MATERIALS, METHODS AND DEFINITIONS
Male desert locusts, Schistocerca gregaria, obtained from the colony at the Uni-versity of British Columbia, Vancouver, B.C., were used in all experiments. They were mounted with wax or glue, ventral side up, and the ventral nerve cord exposed on one side only between the first and second thoracic ganglia. The nerve cord was gently lifted on a hook electrode and held in place with petroleum jelly expressed from a syringe. The ipsilateral eye and the three ocelli were covered with opaque black paint. After amplification, the spikes of the DCMD, consistently the largest seen, were selected electronically by an adjustable window circuit, electronically counted, and hi8togrammed, with a bin width of 10 ms. A single histogrammed trial was 1280 ms in length beginning with a silent period of 400 ms, followed by a stimulus period of 400 ms for all experiments. The interstimulus interval was 30 s, unless otherwise indicated, which appeared to be the best compromise between length of run, drift in rate of responsiveness, and gain reduction due to habituation. Except where otherwise indicated, the target motion (indicated by T in the figures) and target plus grating motion (RT) trials were interleaved, to attenuate bias due to responsiveness drift and different rates of habituation from the inhibited and uninhibited stimulus. A single run to obtain one value of inhibition (I) (as defined on page 195) and the corres-ponding PST histogram required 34 trials and thus about 17 min. Time between runs was approximately 5 min. First trials with or without grating motion were alternated to prevent bias. The spike count was made in the 400 ms stimulus period. These preparations were usually stable for at least 6 h, and often more (up to 2 days). For the results below, useful data were obtained from 56 preparations.
The receptive field of the DCMD is approximately a hemisphere, and motion detection has little directional preference, although small differences in sensitivity to direction of rotation can be found. These differences were not routinely investigated; usually the direction of small target motion and radial grating rotation was left constant over several experiments in order to be able to test variations of other parameters.
Fig. i. Diagram of the experimental arrangement. R, Radial grating pattern which is rotated about its centre; 0, the visual angle subtended at the eye of the animal by the diameter of the radial grating pattern; L, the length of the chord spanning one complete cycle of black and white stripes at the perimeter of the radial grating pattern; a, the visual angle subtended at the eye of the animal by the chord length L; T, the excitatory small target, a disc through which a single edge moves.
The region of greatest sensitivity lies along the equator and somewhat posterior, and for determination of functions of spatial frequency, time and habituation it was primarily this region that was tested; with the radial grating pattern at the origin and the small target just posterior to the grating. For the usual animal-to-pattern distance of 9 in. the small target subtended 5-6° in visual angle and the inhibitory radial grating pattern 370 in visual angle. Other animal-to-pattern distances ranged from 3 in. to 50 in., and in some experiments target size was changed correspondingly to preserve its angular size; little difference was observed in excitatory or inhibitory response when target size was not so changed. The small target (T in Fig. 1) was an occluding edge moving at a constant velocity of 120 (visual angle) per second across a 5-6° bright disc. The excitatory stimulus thus lasted approximately 0-5 s. The radial grating tangential velocity was n ° (visual angle) per s. The grating pattern angular rotational velocity was 370 (pattern plane angle) per s during rotation unless otherwise indicated. These were optimal parameters, chosen by test, but responses were not sensitive to variations. Calibrations were obtained with an oscilloscope and photomultiplier tube viewing the stimulus through a narrow slit.
respectively; when the grating subtended 900 the 90-, 40-, 20- and 10-stripe patterns gave values of F of 0-177, 0-079, 0-040 and 0-021 cyc/deg of visual angle respectively. Note that these values are changed if either the number of stripes or the visual angle subtended by the grating is altered. The methods of fabrication, illumination and rotation of these radial gratings have been described previously (Palka & Pinter, 1975).
The moving edge in the small target had predominantly low spatial frequencies, which is the complement of the situation for precision radial grating patterns. The edge and small disc were formed by projection through a fixed aperture of a moving edge attached to a loudspeaker driven by an amplified function generator. Synchrony of the abrupt initiation of motion of the edge and rotation of the radial grating was checked by an oscilloscope and photomultiplier tube, and rechecked by observation during each experiment; a Digipulser DS-i master timer controlled these motions, the Ortec 4620/21 histogram units and the gating of the spike counters, as well as the inter-stimulus interval. A counter in the histogram units controlled the number of trials, and another counter (one flip-flop) alternated trials for interleaved runs. Spike counts were transcribed by hand from the gated electronic counter display.
The luminance of a bright bar of the radial grating pattern was 1200 lumens/m2 and that of a dark bar approximately o lumens/m2. The bright small disc had a luminance equal to that of a bright bar of the radial grating pattern. When experiments were performed in a light surround, that surround was at a luminance 1-5 log10 units below that of a bright bar, and approximately 1300 minimum extent in visual angle, centred at the origin. When the disc was occluded in light-surround experiments, the occluded portion had the same luminance as the surround, but the excitatory response was approximately the same as in a dark surround.
Active controls are defined as runs where the illumination of the radial grating pattern was extinguished and a black curtain placed over it, but all else remained the same including the alternation of small target motion with simultaneous small target motion and rotation. Thus the effect of any auditory response of the DCMD could be detected. There was none, as the motor drive and relay were well insulated against sound production. The slowly moving loudspeaker cone produced no sound.
Inhibition (/) of the response to edge motion in the small disc by the rotation of the radial grating pattern is defined by
_NE-NI
NE '
where NE is the number of spikes in the DCMD in response to edge motion in the small disc, and NI is the number of spikes in response to simultaneous motion in the disc and rotation of the radial grating pattern. When the number of spikes NI is greater than NE, inhibition / becomes negative and is, in fact, excitation.
RESULTS Excitation and inhibition by radial grating patterns
Fig. a. Histograms of DCMD response to rotation of radial gratings of 90, 40, 20 and 10 stripes, respectively. Radial grating rotation begins at the first arrow below each plot and ends at the second. Latency in response is approximately 95 ms in each case. Each histogram is of 17 trials in series for each separate pattern, in actual order of io, 40, 20 and 90 stripes. The average spike count with standard error in the 400 ms time period between the two arrows is 2-59 ±0-39, 6-oo±o-46, 7-18 ±0-69 and 14-88 ±0-98 for 90, 40, 20 and 10 stripes respectively. Vertical calibration, 59 spikes/s; horizontal calibration, 100 ms. Histogram time bins, 10 ma. Expt 19/2.
(Generally peak spike frequency is a less reliable measure than spike count, and in Fig. 5 the solid triangles show the dependence of spike count E on spatial frequency for the data of Fig. 2.) The response lasted about 200 ms in response to all tested periods of rotation, and had a latency that was constant for any given number of stripes.
The effect of rotation of radial grating patterns upon the response of the DCMD to small target motion is shown in Fig. 3. In the presence of an adjacent stationary grating, the response to the small target (plots T) consisted of about 100 ms of high-frequency spiking followed by a lower spike frequency. The response was quite constant over the 80 min required for the records in Fig. 3, typical of a healthy preparation. It was also unaffected by the number of stripes in the static radial pattern. When the target was presented together with the rotation of the grating (plots RT), however, there was a reduction in number of spikes (inhibition) with gratings of 90, 40 and 20 stripes (compare each RT plot with its T plot control). The effects of the inhibition appear just after the initial high-frequency bursts and disappear about 270 ms after the onset of the response. With gratings of 10 stripes, the spike frequency was generally elevated during this period.
be"-20 R T " —
Fig. 3. Histograms of D C M D responses to motion of small target (plots T) and to simul-taneous motion of small target and rotation of radial grating patterns (plots RT). The number of stripes in the radial pattern (90, 40, 20 and 10) are indicated on the left. For each number there is a T and an RT plot displaying the result of 34 paired trials of T and RT stimulation. Both small target motion and radial grating rotation begin at the first arrow (below plots RT) and grating rotation stops at the second. Small target motion continues beyond the end of each record. The average number of spikes in the 400 ms period between arrows is, for traces T and RT respectively, 1700, 8-88; 1888, 9 1 2 ; 19-05, 1218; and 1735, 19-06; for 00, 40, 20 and 10 stripes respectively. Radial grating pattern size is 37° of visual angle and spatial frequencies are 0 3 9 7 cycles/degree for 90 stripes; 0 1 7 5 for 40; 0 0 8 8 for 20; 0-045 for 10. Order of runs was 90, 20, 40, and 10 stripes. Histogram time bin* are 10 ms. Vertical cali-bration is 59 spikes/s; horizontal, 100 ms. Expt 7/2.
seen that as stripe number is increased, i.e. with gratings which produce less excitation when presented by themselves (closed triangles), there is more inhibition of the small target response.
£
26-i
2 4 2 2 2 0 - 18- 16- 14- 12-
10-/ 0-6
0-4
0-2
0
-0-2 8- 64 2 -
0 0 0 4 0
-
-0-6-002 005 01 0-2 0-5 10
Spatial frequency (F)
Fig. 4. Inhibition (/) of the small target response produced by rotation of the radial grating pattern, at a function of the nominal spatial frequency (F) (in cyc/deg of visual angle) of the pattern, and excitation (E) produced by rotation of the pattern alone, as number of spikes. Inhibition of rero means no effect; inhibition of +1 means abolition of small target response; negative inhibition means excitation additional to small target response. Continuous curve: inhibition (/) as a function of spatial frequency, means of 14 experiment!, curve fit by eye. Symbols, data for experiment 7/2. A, Inhibition (/), radial grating pattern diameter 37° of visual angle and the spatial frequencies of 0-045, ojo88, 0175 and 0397 cyc/deg correspond to io-, ao-, 40- and 90-stripe patterns respectively. O. Inhibition (/), radial grating pattern diameter 00° of visual angle, and the spatial frequencies of 0021, 0-040, 0-079 »*d 0-177 cyc/deg correspond to 10-, 20-, 40- and 90-stripe patterns respectively. The largest standard error for both sets of data is shown. • , Active control (see Methods). A, Excitation (if), radial grating pattern diameter 37°. # , Excitation (E), radial grating pattern diameter oo°. The largest standard errors for (E) and (/) are shown. All experiments in dark background. temporal frequency of 12-5 Hz. Thus if temporal frequencies in the region of 12 Hz were employed, inhibition could actually increase due to the increase of post-converg-ence inhibition with increase of temporal frequency.
E
26-j 24- 22- 20- 18- 16-
14-
12- 108 6 4 2 0
0 4
0 2
0
0 2
0 4
0 6
--0-8'
002 005 01 0-2
Spatial frequency (F)
0-5 10
Fig. 5. Excitation (E) and inhibition (J) as a function of the spatial frequency (F) of the radial grating pattern as Fig. 4 but in light background (see Methods). Continuous curve: inhibition (/) means for three experiment?, curve fit by eye. Symbols, Expt 19/2.
the locust is approximately 1 -o cyc/deg (corresponding to a 90-stripe pattern sub-tending 14-4° of visual angle) (Palka & Pinter, 1975). In summary, a radial grating pattern is a localized inhibitory ' background' if its spatial frequency components are resolvable and do not lie below 0-05 cyc/deg, below which point it becomes excitatory. The spatial frequency of maximal inhibition is about 0-17 cyc/deg, which corresponds to a 90-stripe pattern subtending 93-1° of visual angle, or 40-stripe pattern subtending 37-7°, or a 20-stripe pattern subtending 18-6°.
To show that the excitation evoked by a radial grating pattern alone is comple-mentary to its inhibition, the excitation due to rotation of the pattern alone has been plotted in Figs. 4 and 5, for both pattern sizes. Excitation decreased with increasing spatial frequency, and the curves overlapped for the two pattern sizes. Maximal rate of change of both inhibition and excitation with respect to spatial frequency occurred in the same region of spatial frequency. This would reinforce the hypothesis that one is a function of the other. In other words, it is possible that the grating response has a self-inhibitory component which inhibits excitatory components of the response and also inhibits the small target response. This could explain the phasic characteristic of response to rotation of radial gratings (Fig. 2).
0-6 r
05
04
03
02
01
-1 & 0 5 ~
O A
r.
Aio
o
A A0 O
O
A
i i
15 20 Degrees
o
A £
O
A •
i i i
25 30 35
0 1
[image:10.451.105.327.56.312.2]--0-2 L
Fig. 6. Inhibition (7) as a function of the diameter of radial grating patterns in degrees of visual angle. Radial grating sizes in this figure are predominantly less than for Figs. 4 and 5, and the spatial frequencies for this figure are in the range 0086—0-473 cyc/deg of visual angle, which is the region of maximal inhibition as shown in Figs. 4 and S- The points were obtained with 10-, 20- and 40-stripe patterns. O. A, Experiments of 18 and 20 July 1978 respectively (20 interleaved trials per point). • , Expt 2 August 1975.
Inhibition was found to be independent of the initial presence of a light or dark bar of the radial grating pattern adjacent to the small target. In two experiments the possibility of a small target inhibiting another small target was tested. Invariably the response to two targets of the kind described above placed 400 apart in the visual field in areas of normal to high sensitivity was greater or equal to that for one target alone.
The region of radial grating pattern sizes where inhibition becomes strongly dependent on the visual angle subtended by the pattern is shown in Fig. 6. Inhibition decreases very sharply below a radial grating pattern size of approximately 190 visual angle, while above that size inhibition is in the region of values found for pattern sizes up to 900 visual angle. At approximately 8°, inhibition cannot be found at any spatial frequency. Spatial frequencies used for the results of Fig. 6 were in the range of o-o86-o-472, which, by examining Figs. 4 and 5, can be seen to be the region of maximal inhibition. The radial grating patterns used were the 10-, 40- and pre-dominantly 20-stripe patterns.
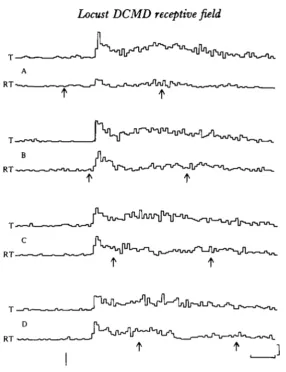
Fig. 7. Responses of the DCMD to small target (plots T) and small target motion and radial grating rotation (plots RT), for simultaneous and delayed times of initiation of radial grating rotation. Initiation of small target motion shown by vertical line at left below plot RT in (D). Radial grating rotation begins at first arrow and ends at second arrow, shown below each plot RT. In (A), small target motion and grating rotation are simultaneous: in (B) grating rotation is delayed 100 ms after small target motion; in (C) grating rotation is delayed 200 ms; in (D) grating rotation is delayed 300 ms. Order of runs is A, B, C, D; radial grating diameter 370 and 90 stripes (F = 0397); each histogram is of 17 trials, with T and RT interleaved. Histogram time bins are 10 ms, horizontal calibration line 100 ms, vertical calibration line 59 spikes/s. Expt 20/1, dark surround.
contrast to these results, if the radial grating is rotated first for 400 ms, then stopped and small target motion immediately initiated, only a general suppression of response to the small target is observed. This suppression, tested in several experiments, is not a function of spatial frequency except for an abrupt fall-off above 0-4 cyc/deg (approximately a 90-stripe pattern subtending 37° visual angle), which is caused by approaching resolution limits (Palka & Pinter 1975). This suppression is decreased by approximately one-third by delaying small target motion 500 ms after cessation of radial grating rotation. However, if the grating rotation is not stopped, the suppression is generally somewhat increased.
200 i - A
150
100
50
I I i l
E 3
20 16 12 8 4
0
0 0 4 0 0 8 0 1 2 0-2 0-30-4 Spatial frequency (F)
- C
0 4 8 12 16 20 Number of spikes (£)
•a ?2 - B
20 16 12
Z 8
E z
0 4 8 12 16 20 Number of spikes (E)
0-6'
0-4
0-2
0 D
-" i l l
0 200 Time delay of
[image:12.451.83.378.64.355.2]rotation (ms)
Fig. 8. Inhibition in terms of spike frequency, number of spikes and as a function of time delay of grating rotation. (A) Spike frequency as a function of spatial frequency of the radial grating pattern for the records of Fig. 3; open symbols, peak spike frequency; closed symbols, average spike frequency in the initial 100 ms peak of response; triangles, spike frequency for plots T, small target responses; circles, spike frequency for plots RT, simultaneous target and grating motion. (B) Number of spikes removed by the inhibitory gratings in plots RT of Fig. 3 as a function of number of spikes (E) produced by grating rotation alone measured in a separate run (Expt 7/2) similar to that of Fig. 2. (C) Number of spikes added to small target retponse by excitatory (augmenting) gratings as a function of number of spike* (E) produced by grating rotation alone; points are for three experiments in light background for which the continuous curve in Fig. 5 is plotted. (D) Inhibition (/) as a function of the time delay of onset of grating rotation with respect to onset of small target motion for the records of Fig. 7; spike count was taken during the 400 ms interval of grating rotation in all records.
that for target motion alone. Therefore, the inhibition (/) is not due to a greater peak spike frequency for simultaneous motion. At 0-05 cyc/deg (io-stripe pattern sub-tending 33-2° of visual angle) the inhibition has become excitation (see open triangles of Fig. 4) and this is reflected in the greater peak spike frequency for simultaneous motion. If instead of peak spike frequency the average spike frequency in the 100 ms initial peak of response is plotted (Fig. 8 A, solid symbols), a nearly parallel case is seen. Variations in spike frequency for target motion alone (triangles) are typical of preparation drift.
Since the computation by the nervous system of effectiveness of stimuli or points in the stimulus field is often modelled by addition of excitatory variables or subtraction by lateral inhibition, it is important to determine experimentally whether the addi-tion or subtracaddi-tion is arithmetic, i.e. linear. The inhibiaddi-tion or augmentaaddi-tion of small target response by the radial grating pattern was not a linear process in terms of spikes removed or added. For inhibitory gratings, Fig. 8B shows the number of spikes removed by the grating from the small target response as a function of the number of spikes caused by grating rotation alone for the experiment of Fig. 3. The number of spikes removed by grating rotation was always greater than the number of spikes produced by grating rotation alone. In contrast, the number of spikes added by augmenting gratings was always less than the number of spikes caused by the grating alone. This is illustrated in Fig. 8C for several experiments with maximal augmenta-tion at low spatial frequencies. Thus the gratings were more effective inhibitors than augmentors of small target response.
In the course of these experiments the question of optimal timing of grating rotation for maximal inhibition arose. Since grating rotation preceding small target motion causes a suppression perhaps simply due to preceding neuronal activity (see above), optimal timing of inhibition was tested as in Fig. 7 for grating rotation following initiation of small target motion. For the records of Fig. 7 the inhibition (I) is plotted in Fig. 8D as a function of delay of rotation. Since the inhibition decreased with increase of delay it can be concluded that although delayed rotation produces effective inhibition, simultaneous rotation is optimally inhibitory on small target response.
Habituation
28
24
20
• 1 6 12f-.
A A
O O A Q A A A X O A AO Q
A o i
1 5 9 13 17 21 Stimulus presentation
J 12
= 4 < r AAO OAO O
o o
1 5 9 13 17 21 Stimulus presentation
12 S3 •a
| 4
z 0
O O O
o o
A OA a A A
6 OO OO A AAOO A"
I I r
1 5 9 13 17 Stimulus presentation
21
Fig. 9. Response of D C M D as a function of itimuius presentation for 10 s inter-stimulus interval (1ST) and non-interleaved runs of target motion (circles) and simultaneous small target motion and radial grating rotation (A's). The respective means are indicated to the right with a horizontal line drawn through the appropriate symbol. (A) Grating pattern of 90 stripes, diameter 370, F = 0-397, Expt 7/3. (B) Grating pattern of 40 stripes, diameter 370,
F =• 0-175, Expt 10/2. (C) Grating pattern of 90 stripes, diameter 90°, F = 0-177, Expt 5/2.
All in dark surround.
in the same direction but much smaller. It is apparent that with radial grating inhibi-tion, habituation is often reduced. However, in most experiments the trials with and without radial grating motion were interleaved to avoid habituation dependent bias in the inhibition (/).
An interesting prediction of differences in habituation for radial grating excitation alone can be made on the basis of the results of Fig. 9. If a salient difference for the DCMD between wide field and small field stimuli is the spatial frequency content, a low spatial frequency radial grating of the same size as one of a high spatial frequency should have a more strongly habituating response. In Fig. 10 it can be seen that the decrement in response for the low spatial frequency grating is far greater than that for the high spatial frequency grating and the prediction is fulfilled.
Distribution of inhibition and excitation in the receptive field
inhibi-221—
20'
18
16
14
t 12
,0
z
o _ o °o oO o o
o
0 0
A I
A A
1 5 9 13 Stimulus presentation
[image:15.451.112.327.43.416.2]17
Fig. 10. Response of the D C M D as a function of stimulus presentation number for 30 s ISI (inter-stimulus interval) and non-interleaved trials. Stimulus was the radial grating pattern alone, oo° diameter; circles, 10 stripes ( F •= 0 0 2 1 ) ; triangles, 90 stripes (F = 0-177); average of four experiments in dark background, 14/2, : o / 2 , 7/2, 5/2.
tion were then obtained. The majority of such plots from a series of 14 animals fell into one of the two types shown in Figs. 11 (a) and (b). Most receptive fields showed greatest inhibition in the posterior-ventral quadrant (Fig. 11 a), but several showed the strong difference between anterior-posterior and dorsal-ventral axes illustrated in Fig. 11 (b). Rarely was there strong dorsal inhibition, and posterior inhibition was usually stronger than anterior. This is seen in Fig. 11 (c), where a mean of complete polar plots for ten animals is shown. Comparing this to the map of excitation sensitivity (Palka, 1967), the anterior-posterior axis is similar but the dorsal-ventral axis is reversed. Placing the radial grating further away from the target, up to 6o°, did not substantially change the distribution of inhibition sensitivity.
Fig. 11. Polar plots of inhibition (/) where the small target is at the origin of the receptive field (see Methods) and the radial grating pattern centre is positioned 40 degrees from the small target at the indicated locations. For all experiments, radial grating pattern of 40 stripes, diameter 370 (P = 0-175), light background, inhibition (/) calculated from interleaved
18 trial runs. Horitontal calibration bar, / = C05. (a) Experiment 11/6; (b) Expt 5/5; (c) mean of ten complete experiments 25 April to 11 June 1977.
four more dorsal points (open circles). There was a fall-off of inhibition with increasing separation between target and grating. The excitation (E) evoked by the small target at the positions shown (closed circles) was slightly smaller in the dorsal than ventral regions. In Fig. 12(6) the target was placed 500 posterior and the inhibition (/) was seen to fall off with increasing distance (open circles); the same was found for the target placed 500 anterior (open triangles), but the fall-off was less when the grating was moved into the posterior rather than the anterior region.
[image:16.451.75.374.49.298.2](a)
Fig. 12. Inhibition as a function of small target to grating pattern centre distance along the dorsal-ventral (a) and anterior-posterior axes (6). In (a) the excitation (E) (small closed circles) has also been plotted as a function of position in the receptive field. The open symbols are inhibition (/) in each case for the small target position given by the same symbol enclosing a (T). Expt 22/12, ( / ) calculated from interleaved 18 trial runs, radial grating pattern of 40 stripes, diameter 370, F = 0-175, light background.
Table i. Comparison of slope of decrease of inhibition as radial grating is
moved away from small target, inhibition and excitation
(Positive slope indicates a decrease of inhibition as target-to-grating distance is increased. Numbers are means of eight complete experiments 22 December 1976 to 8 June 1977, ( £ ) from nine trial runs, (/) from interleaved 18 trial runs, radial grating pattern diameter 37°, 40 stripes, F = 0175, light background. Slopes were obtained by linear regression for each experiment.)
Dorsal-ventral axis Radial grating moving
dorsally, slope of / Inhibition by radial grating
at 40° dorsal
Excitation by small target at 50° dorsal
Radial grating moving anteriorly, slope of / Inhibition by radial grating
•
40° anterior
citation by small target at 50° anterior
— 0-I2I
16 spikes
Radial grating moving ventrally, slope of / Inhibition by radial grating
at 400 ventral
Excitation by small target at 500 ventral
Anterior-posterior axis
+ 0-00293/deg Radial grating moving posteriorly, slope of / + 0-135 Inhibition by radial grating
at 400 posterior 16 spikes Excitation by small target
at 500 posterior
= -o-ooo32/deg = +0-191
= 17 spikes
[image:17.451.41.416.505.649.2]DISCUSSION
Spatial frequency, temporal frequency and temporal relationships in inhibition
I have attempted here to dissect out the salient variables in grating excitation and inhibition: spatial frequency, size, contrast frequency, time of occurrence and position in the receptive field. Spatial frequency is an important variable because it can be used to economically characterize many visual stimuli, and responses put in these terms can be related to anatomically based mathematical models of the nervous system (Cowan,
1977)-In these studies temporal frequency has been varied in some cases, but has never been high enough to evoke predominantly the known (Rowell et al. 1977) temporal frequency-dependent inhibition (post-convergence inhibition) in the locust LGMD and DCMD. Rowell et al. (1977) have shown by intracellular recording techniques that IPSPs in the LGMD, mediating post-convergence inhibition, may in some cases occur at the low temporal frequencies employed in this study. Since the measure of inhibition in this study, spike count, is not dependent on recording conditions or electrode placement as in intracellular recording, spike count may be a much more sensitive measure of inhibition and it is possible that post-convergence inhibition is part of the mechanism of the inhibition found in this study.
In general, temporal frequency always has the possibility of modifying responses to moving spatial stimuli (Pinter, 1972; Srinivasan & Bernard, 1975). For example, too low a temporal frequency may reduce the response in some phasic neural channels, and too high a temporal frequency will reduce the response of any neural channel unable to transmit rapid changes in time. Here, however, nearly the same inhibition (/) was obtained at a given spatial frequency of the stimulus pattern with temporal frequency (a function of spatial frequency and velocity) differing by a factor of two. In Figs. 4 and 5 the temporal frequencies for the overlapping points all differ by a factor of two, but inhibition (/) is nearly the same and the spatial frequency de-pendence is preserved. Further, in two experiments the dede-pendence of inhibition (/) over a large but low temporal frequency range (1-4-5-4 Hz - see Results) was tested, and no dependence on temporal frequency was found. Since there was also no effect of pattern size (Figs. 4, 5), the dependence of inhibition (/) on the radial gratings for sizes above 190 visual angle (Fig. 6) must be primarily on their spatial frequency content. Examination of Figs. 4 and 5 will also show that changing spatial frequency by a factor of four causes a change in response from maximal inhibition to aug-mentation; therefore a change of temporal frequency by a factor of four might be considered a large range for this study.
> ms suggests it is due to a quite different mechanism than the inhibition caused by Simultaneous rotation of radial gratings. Rowell et al. (1977) found that the time course
of decay of the post-convergence inhibition (mediated by IPSPs in the LGMD antecedent to the DCMD) was similar to that of this suppression, although they did not measure spatial frequency dependence. It is thus quite possible that the post-convergence inhibition mediates this suppression and a prediction of lack of depen-dence on spatial frequency of the IPSPs in the LGMD can be made by this obser-vation. On the other hand it is also possible that the suppression is either a simple post-excitatory depression due to any excitation, or a saturated continued inhibition.
Excitation
The choice of the specific small target stimulus used here was made primarily on the basis of obtaining as large an excitatory response as possible in order to measure inhibition, as inhibition by radial gratings was not observable in small excitatory responses. The radial gratings cause both excitatory and inhibitory components of response, and the excitatory component may add to the excitatory response to the small target. In many cases where the excitatory response to the small target was quite low, e.g. 3-5 spikes, the added excitatory component due to the radial grating appeared to obscure its inhibition of response to the small target.
In the plots T (small target response only) in Fig. 3 there is an initial large onset response after the first arrow, followed by a decay, followed by a resumption of a higher level of spike frequency. While this decay is probably an inherent property of the neural response, the possibility remains that it is partly due to the nature of the small target stimulus. At a time corresponding to the end of this decay, approximately 230 ms, the occluding edge in the 5-6° bright disc has reached the half-way point and the edge has maximal length, and zero rate of change of length. Thus it could be true that the decay is partly a function of the decreasing rate of change of length as the half-way point is approached by the edge. Dependence on rate of change of edge length could be a factor in responses to rectangular gratings viewed through a round window. However, use of a rectangular window of approximately 75 x io° through which an edge of fixed length moved (T. Abrams, unpublished observations) yielded the large onset followed by a decay, followed by a resumption of a higher level of spike frequency. This suggests that the decay may be an inherent property of the neural response, perhaps a rapid adaptation due to the initial high-frequency burst.
by radial gratings seen in light background (Fig. 5), might be due to the lower valudl of contrast of this distribution of harmonics with respect to the overall illuminatiolP level, and thus possibly due to their lesser effectiveness in inhibition, when the nominal spatial frequency of the grating is below 0-05 cyc/deg.
Spatial relationships in the receptive field
Since the inhibition reported here may be related to or mediated by peripheral excitatory channels, it is of considerable interest to compare the distribution of inhibition in the receptive field with the distribution of excitation determined by Palka (1967). He determined that response to dimming a small i° test target was greatest at the centre of the eye (the origin) and along the equator, greater in the posterior than the anterior regions. The distribution of inhibition by radial gratings generally agrees with this determination (Fig. 11 c) except for a reverse distribution on the dorsal-ventral axes.
The large field inhibitory rectangular grating used by O'Shea & Rowell (1975) and Rowell et al. (1977) had a nominal spatial frequency of 0-066 cyc/deg which is in the inhibitory region of spatial frequency in Figs. 4 and 5. This grating had ventral and dorsal sections flanking the excitatory target on the equator. However, the inhibition fell off with target-to-grating distance much more rapidly than was the case for radial gratings (Fig. 12). One reason for this may be seen in Fig. n(c), where the dorsal region would give quite weak inhibition, although the ventral region would give stronger inhibition. It may be that their rectangular gratings, which spanned the entire horizontal extent of the receptive field in the anterior-posterior direction, exerted the major inhibition only near the equator in animals with inhibitory receptive fields like that summarized in Fig. 11 (c); this would give rapid fall-off of inhibition as the grating halves are moved away from the equator. For an animal with a receptive field like that of Fig. 11 (b), the fall-off would be even more rapid.
Lateral inhibition
Lateral inhibition was proposed by O'Shea & Rowell (1975) and Rowell ft al. (1977) as a mechanism to explain discrimination against wide field stimuli in their experiments. Their wide field stimuli were not simple large, but had also variation in contrast (nonzero spatial frequency spectrum). The motivation of some of the experiments reported here was to determine how much this discrimination depended on these two salient parameters of the wide field stimuli: size and spatial frequency. In Figs. 4-6 it was demonstrated that changing size by a factor of four did not change dependence of inhibition (/) on spatial frequency. Thus, for the radial gratings larger in diameter than 190 visual angle the dependence of this discrimination, measured as inhibition (/), is primarily on spatial frequency, not size; this is consistent with a model of lateral inhibition. Ratliff, Knight & Graham (1969) have shown theoretically that lateral inhibition is capable of performing spatial frequency filtering including discrimination against high spatial frequencies independently of the size of the stimulus. Thus the results of the present study are consistent with the model of the acridid movement detector system of Rowel et al. (1977).
many units which discriminated in favour of wide field stimuli. These latter units are of interest here because they suggest the existence of other networks where lateral inhibition would be augmented or replaced by lateral summation. However, in the acridid movement detector (Rowell et al. 1977, and Figs. 9 and 10, this article), responses to wide field stimuli habituate less than to small field stimuli and the lateral inhibition is thought to protect synapses from habituation. In the dragonfly the units discriminating in favour of wide field stimuli habituated far less than those discrimi-nating against wide field stimuli. If lateral inhibition in wide field favouring units is indeed replaced by lateral summation, these units and their antecedents must be unusually resistant to habituation and not require protection from habituation by lateral inhibition. The dragonfly units discriminating against wide field stimuli may be mediated by strongly habituating interneurones on which lateral inhibition has no effect.
Applicability of spatial frequency and Fourier analysis
In this study it is clear that the receptive field of the DCMD determined by a small dimming field will not predict the response of the DCMD to extended stimuli such as gratings. The receptive field in this case is not a point-spread function in terms of measurable quantities, and thus the Fourier transform of the receptive field function will not yield a meaningful spatial frequency transfer function. The DCMD must actually be tested by extended stimuli such as gratings. Thus, spatial Fourier analysis in its strictest sense is not applicable to the DCMD. However, the characterization of the grating is appropriately made in the spatial frequency domain as that is a way of describing it which can be generalized to other stimuli. Fourier analysis can then be applied in a restricted sense to motion of objects in a restricted region of the receptive field. Fourier analysis provides a prediction that, when not fulfilled, aids one in examining characteristics of stimuli or the structure of the nervous system in order to discover the reason for non-applicability. Fourier analysis is not simply a more complicated way of describing the receptive field, but at the very least, a motivation to relate the receptive field of a visual cell to its response to extended spatial stimuli.
Comparison to vertebrate visual systems
chose frequencies close to the inhibitory maximum for the locust. Although th«J optical resolving power of the locust is nearly two orders of magnitude less than that* of the human, the spatial frequency of inhibitory gratings is about the same. There-fore optical factors are probably not dominant in the inhibition, but for unknown reasons the neural factors are operating similarly.
If the rise of threshold in the above psychophysical studies is caused by inhibition, the locust DCMD and human visual system have a striking parallel of inhibition of response to small objects by gratings. Further, the inhibition seems to fall off with distance between object and grating in a parallel manner to that of the DCMD. Perhaps these common properties of the two visual systems are important in all visual systems in animals which must discriminate between small objects and large textured backgrounds and distinguish between object movement, world movement and self-movement.
This study was supported by a grant (EY 01285) from the National Eye Institute, NIH. T. Abrams, P. Neudorfer and J. Palka critically reviewed the MS.
REFERENCES
BARLOW, H. B. (1965). Visual resolution and the diffraction limit Science, N.Y. 149, 553-555. BROOKS, B. A. & FUCHS, A. F. (1975). Influence of stimulus parameters on visual sensitivity during
saccadic eye movement. Vision Res. 15, 1389-1398.
BURTT, E. T. & CATTON, W. T. (1962). A diffraction theory of insect vision. I. An experimental study of visual acuity in certain insects. Proc. R. Soc. Lond. B 157, 53-82.
BURTT, E. T. & CATTON, W. T. (1969). Resolution of the locust eye measured by rotation of radial striped patterns. Proc. R. Soc. Lond. B 173, 513-529.
COWAN, J. D. (1977). Some remarks on channel bandwidths for visual contrast detection. NRP Bulletin,
Neuronal Mechanisms in Visual Perception (ed. E. Poeppel, R. Held and J. E. Dowling), vol. 15,
no. 3, Cambridge: The M I T Press.
ENOCH, J. M., LAZARUS, J. & JOHNSON, C. A. (1976). Human psychophysical analysis of receptive field-like properties. I. A new transient-field-like visual response using a moving windmill (Werblin-typ«) target. Sens. Processes 1, 14-32.
FEDER, D. (1971). Fourier optics analysis of a radial pattern used to test locust eye resolution. M.S.E.E. thesis: University of Washington.
iNGLrNG, C. R., LEWIS, A. L., LOOSE, D. R. & MYERS, K. J. (1977). Cones change rod sensitivity.
Vision Res. 17, 555-563.
MATEHF, S., YAKIMOFF, N. & MITRANI, L. (1976). Some characteristics of the visual masking by moving contours. Vision Res. 16, 489-492.
OLBERO, R. (1978). Visual and multimodal interneurons in dragonflies. Ph.D. dissertation, University of Washington, University Microfilms, Ann Arbor, MI.
O'SHEA, M. & ROWELL, C. H. F. (1975). Protection from habituation by lateral inhibition. Nature,
Lond- 254,
53-55-O'SHEA, M. & ROWELL, C. H. F. (1976). The neuronal basis of a sensory analyser, the acridid move-ment detector system. II. Response decremove-ment, convergence, and the nature of the excitatory afferents to the fan-like dendrites of the LGMD. J. exp. Biol. 65, 298-308.
PALKA, J. (1965). Diffraction and visual acuity of insects. Science, N. Y. 149, 551-553.
PALKA, J. (1967). An inhibitory process influencing visual responses in a fiber of the ventral nerve cord of locusts. J. Insect Physiol. 13, 235-248.
PALKA, J. (1969). Discrimination between movements of eye and object by visual interneurons of crickets. J. exp. Biol. 50, 723-732.
PALKA, J. (1972). Moving movement detectors. Am. Zool. 13, 497-505.
PALKA, J. & PINTER, R. B. (1975). Theoretical and experimental analysis of visual acuity in insects.
Tfie Compound Eye and Vision of Insects (ed. G. A. Horridge). Oxford: Clarendon Press.
PINTER, R. B. (1972). Frequency and time domain properties of retinular cells of the desert locust
(Sckistocerca gregaria) and the house cricket (Acheta domesticus). J. comp. Pkysiol. 77, 383-397.
PINTER, R. B. (1977). Visual discrimination between small objects and large textured background^
RATLIFF, F., KNIGHT, B. W. & GRAHAM, N. (1969). On tuning and amplification by lateral inhibition.
Proc. natn. Acad. Sci. U.S.A. 6a, 733-740.
ROWBLL, C. H. F. (1971)- The orthopteran descending movement detector ( D M D ) neurones: a characterization and review. Z. Vergl. Pkytiol. 73, 167-194.
ROWELL, C. H. F., O'SHEA, M. & WILLIAMS, J. L. D. (1977). The neuronal basis of a sensory analyzer, the acridid movement detector system. IV. The preference for small field stimuli. J. exp. Biol. 68, IS7-I8S.
SRINIVASAN, M. V. (1977). A visually-evoked roll response in the housefly, open-loop and closed-loop studies. J. comp. Pkytiol. 119, 1-14.
SRINIVASAN, M. V. & BERNARD, G. D. (1975). The effect of motion on visual acuity of the compound eye: a theoretical analysis. Vision Ret. 15, 515-525.
WERBLIN, F. S. & COPENHAGEN, D . R. (1974). Control of retinal sensitivity. III. Lateral interaction at the inner plexiform layer. J. gen. Pkytiol. 63, 88-110.
APPENDIX
Grating intensity patterns have wide application as test patterns for optical systems and visual systems research. Windmill or radial grating patterns have certain ad-vantages over rectangular grating patterns. Most notable of these is the lack of low-frequency spatial spectrum components generated by spatial truncation of rectangular grating patterns (Palka, 1965; Barlow, 1965; Burtt & Catton, 1969). Radial grating patterns have been used in a study of suppression of visual response by high spatial frequency textured backgrounds (Pinter, 1977) and in determining opto-motor responses (Srinivasan, 1977). However, to avoid unwanted low spatial fre-quency components in radial grating patterns it is necessary to fabricate them with great precision in periodicity and in this way a satisfactory measurement of compound eye visual acuity has been made (Palka & Pinter, 1975). The spatial frequency spectrum of precision radial grating patterns is important in interpreting the above studies and for any usage of them as test patterns or visual stimuli.
The spatial frequency spectrum of an intensity pattern g(x, y) in the pattern field coordinates x, y is given by
,f
y)=r r g(x,y)exp(-J27T(f
xx+f
yy))dxdy. (1)
J — 00 J — 00
For a radially symmetric pattern such as the radial grating pattern, it is convenient to transform the rectangular coordinate system to polar coordinates x,y-*-r,6; fx,fv-+p, <t>. The spatial frequency spectrum then becomes
G(p,</>)= dd dr-rg(r, 6) exp [ — 2Trrp(co& 6 cos <f> + sin 6 sin
Jo Jo ( 2 )
where p, (j> are spatial frequency coordinates, cyc/meter and cyc/radian, respectively. For a radially symmetric pattern, g(r, 0) is separable; g{r, 6) = g^r)g^6), where gn(r) is a uniform annulus admitting light between radii r1 and r2, and gjlfi) is the
angular intensity variation. Then it can be shown that
G(p, <f>) = " i f (-»»**»* f
8" ^ ) e-W dd (''rj
n(
2nrp) dr. (3)
n--oo JO J r,
56
48
40
o X'32
u
•o
3
1 24 <
16
2 0 2-2 2-4 2-6
p, cycles/cm
[image:24.451.49.393.54.310.2]2-8 3 0 3-4
Fig. 13. Computed amplitude of spatial frequency spectrum of radial grating bar pattern of oo-stripe cycles as a function of p, the radial spatial frequency in cyc/(cm distance in the plane of the pattern). The angular spatial frequency <f> has been fixed at a value such that cos (90^) = 1. The black-white bar variation has unity value in luminance. Inset: the radial grating pattern for this spectrum, drawn to scale but not all stripes shown. For this figure
rt = 6-i cm and rv = 3-0 cm.
angular frequency spectrum of G{p, <p) depends on the radial component and vice versa because of the common index n. For an angular intensity distribution g^d) of N cycles of equal angular width black (zero luminance) and white (unit luminance) stripes, it can be shown by simply calculating the first integral in equation (3), the Fourier coefficients of the angular intensity distribution, that
sin
(4)
where Jn is the nth order Bessel function. For centred rotated patterns the first
effective term in this series is m = ± 1 . Because the Bessel function Jn(x) is very small
for x < n, the amplitude of the spatial frequency spectrum of this pattern rises suddenly as x -> n, and thus the amplitude of the spectrum resembles an angularly undulating annulus. For a pattern of 90-stripe cycles of equal width black and white stripes extending over approximately the outer third of a pattern of unit radius, the lowest effective spatial frequency term in the above equation (m = ± 1) is then
G{p,<j>) = - / c o s (90^6),
where 7 = 4 rjfw (znrp) dr.
J 0-837r,
by Feder (1971) and is plotted in Fig. 13 for a pattern of outer radius rg = 61 cm, as a function of the radial spatial frequency coordinate p in cyc/cm in the plane of the pattern. Since the variation of the spectrum with <fi, the angular spatial frequency coordinate, is simply cos (90^), Fig. 13 is the radial cross-section of the spectrum at maximum amplitude. The minimum sensible spatial frequency (amplitude of spectrum 1 % of peak amplitude) is 0-85/ and the peak spectrum spatial frequency is
1-09/, where/is the single number spatial frequency, geometrically calculated as i/L, where L is the chord distance subtended by one stripe cycle at the (see Fig. 1) outer-most edge of the annular sector. For this value of/, 2-35 cyc/cm in Fig. 13, one finds the spectrum has risen to 25 % of the peak value. For other values of N, number of stripe cycles, these relationships hold approximately. For N = 4 (unpublished calculations) the peak of the spectrum is at 1 -41/, the 1 % of peak point is at 0-325/and the value of/gives an amplitude 60% of peak. These two values of N represent the experimentally useable extremes.
For Fig. 13, increasing the inner radius reduces the peak amplitude (for rx = o-9r2, the peak decreases by 17%) but does not shift the initial rise nor peak position of the spectrum shown. Decreasing the inner radius affects primarily the amplitudes beyond the peak. Changing r2 only scales the spectrum in frequency.
It is clear that there are no unwanted low spatial frequencies in the spectrum of precision radial grating patterns either as a function of angular or radial spatial frequency coordinates. Moreover, the most important spectral properties of these patterns are relatively insensitive to variations of the number of stripe cycles and the inner and outer radii. Note that for any other angular variation g^6) in the pattern having radial symmetry the spectrum can be calculated by equation (3).
An important requirement for grating patterns is lack of errors in the periodic spatial variation producing the high spatial frequencies. This is what the adjective 'precision' refers to, and, to the extent these errors are present, there will exist un-wanted low spatial frequency components. These will confound any measurements made resting on the assumption there are no low-frequency components. This is especially serious when the visual system tested has a greater response to low spatial frequencies than to high ones, which is often the case. The noise in the response due to the low-frequency artifactual noise in the pattern will often far exceed the signal in the response due to the high frequency components (Palka & Pinter, 1975).
Windmill patterns (N = 4) have been used in vertebrate vision studies (Werblin & Copenhagen, 1975; Enoch, Lazarus & Johnson, 1976; Ingling et al. 1977), where the temporal frequency of contrast variation was of primary interest. Nevertheless, the spatial frequency spectrum of such a pattern may affect the response of a visual system independently of temporal frequency variation produced in individual neural channels.