The observation that the steady-state isometric force following stretching of a muscle is greater than the force for a purely isometric contraction at the corresponding muscle length is well accepted in the scientific community. This phenomenon, which we will call force enhancement following stretch, has been observed in in situ whole muscles (Abbott and Aubert, 1952; Maréchal and Plaghki, 1979), in isolated muscle fibres (Edman et al., 1978, 1982; Edman and Tsuchiya, 1996; Linari et al., 2000) and, most recently, in in vivo human skeletal muscle for electrically stimulated (DeRuiter et al., 2000) and voluntarily activated contractions (Lee et al., 2001). Despite the general acceptance of force enhancement following stretch, there has been little systematic study as to the mechanism underlying this phenomenon. Force enhancement has typically been observed on the descending limb of the force–length relationship (Edman et al., 1978, 1982; Morgan et al., 2000). Furthermore, the descending limb has been associated with sarcomere length instabilities (Hill, 1953; Zahalak, 1997). Therefore, it was convenient to relate history-dependent force properties of muscle, such as ‘creep’ (Gordon et al., 1966), force depression following muscle
shortening, and force enhancement following muscle stretch, to the development of sarcomere length non-uniformities (Edman and Tsuchiya, 1996; Morgan, 1990, 1994; Morgan et al., 2000). Associating history-dependent force properties of muscle with structural non-uniformities at the sarcomere level has the advantage that it leaves contraction at the molecular level history-independent, as it has been since the initial mathematical formulation of the cross-bridge theory (Huxley, 1957; Huxley and Simmons, 1971). History independence in this context means that the steady-state results of the mathematical solutions of the cross-bridge theory are independent of the preceding contractile conditions.
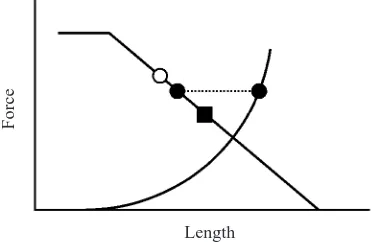
The sarcomere length non-uniformity theory gives the following testable hypotheses: (1) there should be no force enhancement on the ascending limb of the force–length relationship; and (2) the steady-state force following muscle stretching on the descending limb of the force–length relationship cannot be greater than the isometric reference force at the initial muscle length (the length at which the muscle stretch was started; Fig. 1).
The first purpose of this study was to test these two
Printed in Great Britain © The Company of Biologists Limited 2002 JEB3680
We investigated force enhancement following stretching in the in situ cat soleus muscle on the ascending and descending limb of the force-length relationship by varying the amount and speed of stretching and the frequency of activation (5 Hz, 30 Hz). There was a small but consistent (P<0.05) amount of force enhancement following muscle stretching on the ascending limb of the force–length relationship for both stimulation frequencies. The steady-state active isometric forces following stretches of 9 mm on the descending limb of the force–length relationship were always equal to or greater than the corresponding forces from the purely isometric contractions at the length at which the stretch was started. Therefore, force production for these trials showed positive stiffness and was associated with stable behavior. Following active stretching of cat soleus on the descending limb of the force–length relationship, the passive forces at the end of the test were significantly greater than the corresponding passive forces for purely isometric
contractions, or the passive forces following stretching of the passive muscle. This passive force enhancement following active stretching increased with increasing magnitude of stretch, was not associated with structural damage, and only disappeared once the muscle was shortened. For stretches of 6 mm and 9 mm, the passive force enhancement accounted for more than 50 % of the total force enhancement, reaching a peak contribution of 83.7 % for the stretches of 9 mm at a speed of 3 mm s–1.
The results of this study suggest that a passive structural element provides a great part of the force enhancement on the descending limb of the force–length relationship of the cat soleus. Furthermore, the results indicate that mechanisms other than sarcomere length non-uniformity alone are operative.
Key words: skeletal muscle, force enhancement, sarcomere length, passive elastic element, mechanism of contraction.
Summary
Introduction
Force enhancement following stretching of skeletal muscle: a new mechanism
W. Herzog* and T. R. Leonard
Faculty of Kinesiology, University of Calgary, Calgary, Alberta, Canada T2N 1N4 *e-mail: walter@kin.ucalgary.ca
hypotheses. Furthermore, Noble (1992) and Edman and Tsuchiya (1996) suggested that the strain of passive elastic components may play an essential part in the development of the steady-state force enhancement following muscle stretching. This idea was also proposed for human muscle (DeRuiter et al., 2000), and was used in a theoretical model of muscle force enhancement following stretch (Forcinito et al., 1998). However, there has been no direct evidence of such a passive, elastic contribution to force enhancement. Therefore, the second purpose of this study was to determine if there was passive force enhancement following muscle stretching on the descending limb of the force–length relationship.
Materials and methods Experimental arrangement
Force enhancement following stretching was determined in cat soleus muscle (N=8) using an arrangement that has been described previously (Herzog and Leonard, 1997). All methods and procedures were approved by the Life Sciences Animal Ethics Committee of the University of Calgary. Briefly, cats were anaesthetized using a nitrous oxide/halothane/oxygen mixture. The soleus, soleus tendon and calcaneus were exposed by a single cut on the posterior, lateral shank. The soleus tendon was isolated from the rest of the Achilles tendon and cut from the calcaneus with a remnant piece of bone after a reference length (corresponding to an 80 ° included ankle angle) had been determined.
A second cut was made on the posterior, lateral thigh and the tibial nerve was exposed and implemented with a bipolar cuff-type electrode for soleus stimulation. The cat was secured in a prone position in a hammock and the pelvis, thigh and shank of the experimental hindlimb were fixed with bilateral bone pins to a stereotaxic frame. The bone piece at the distal end of the soleus tendon was attached with sutures to a muscle puller (MTS, Eden Prairie, MN, USA; natural frequency >10 kHz). The soleus forces (100 N=10 V) and excursions (50 mm=10 V) were measured continuously by the muscle puller and sampled at a frequency of 200 Hz.
Nerve stimulation was performed using a voltage that exceeded the α- motoneuron threshold by a factor of three (3T) to ensure full soleus stimulation (Herzog and Leonard, 1997). Stimulation pulses were of 0.1 ms duration and monopolar. Stimulation frequency was 30 Hz or 5 Hz, and the duration of stimulation varied as a function of the test protocol. The stimulation frequency of 30 Hz was chosen because it gave fused tetanic contractions of the cat soleus in all cases without causing appreciable fatigue. The 5 Hz frequency was chosen to allow direct comparison of the results from unfused tetani with those published by Morgan et al. (2000). Muscle temperature was monitored continuously and kept at 35±1 °C using a regular drip of warm saline (0.9 %) and an adjustable infrared heat lamp.
Experimental protocol
Three series of tests were performed with each of the eight muscles. In the first series, the force–length relationship of the soleus was determined for stimulation frequencies of 5 Hz and 30 Hz. Force–length relationships were obtained by finding first the length of active insufficiency (zero force) and then increasing length in increments of 2 mm until the (active) descending limb was identified. The length at which the largest active force (total force–passive force) for the 30 Hz stimulations was measured was called 0 mm. Lengths beyond 0 mm were defined as the descending limb (Morgan et al., 2000), as active force decreased with increasing muscle length, and were designated by positive length changes (i.e. a length of +4 mm refers to a muscle length 4 mm greater than optimal length, 0 mm). Similarly, lengths below 0 mm were defined as the ascending limb, as active force increased with increasing muscle length. All contractions were maintained for 3 s. A 1 min rest was given between contractions. Note that the 0 mm length defined in this way was always part of the ascending limb of the 5 Hz force–length relationship.
In the second series of tests, force enhancement following stretching was assessed on the ascending limb of the force–length relationship. In order to quantify force enhancement, four contractions were performed: (i) an isometric reference contraction for 8 s at a muscle length of –2 mm; (ii) a 1 s isometric contraction at a muscle length of –10 mm followed by stretching from –10 mm to –2 mm at 4 mm s–1, followed by a 5 s isometric contraction at –2 mm
(Fig. 2); (iii) an isometric contraction for 8 s at a muscle length
Force
[image:2.612.73.260.78.199.2]Length
of –10 mm; and (iv) a repeat of (i). If the repeat isometric reference contractions did not produce the same force (±0.1 N), trials were not used for analysis. This series of four contractions was performed with a stimulation frequency of 5 Hz and 30 Hz.
In the third series of tests, force enhancement was determined on the descending limb of the force–length relationship. The amount of stretching (3, 6 and 9 mm; i.e. approximately 3–9 % of total muscle length and approximately 7–21 % of optimal fibre length) and the speed of stretching (3, 9 and 27 mm s–1, i.e. approximately 7, 21 and
63 % of optimal fibre length s–1) were systematically varied
(Fig. 3). The magnitude of stretching was varied as there is a controversy whether or not increasing stretch magnitude influences force enhancement in cat soleus (Morgan et al., 2000). Stretch speeds were changed as it appears that fibre preparations do not show a speed dependence of force enhancement (Edman et al., 1978; Sugi and Tsuchiya, 1988), whereas muscle preparations do (Abbott and Aubert, 1952). In order to obtain a single data point of force enhancement, six tests were performed: (i) isometric reference contraction at the initial length; (ii) isometric reference contraction at the final length; (iii) stretching from the initial to the final length with the muscle fully activated; (iv) stretching from the initial to the final length with the muscle not activated (passive tests); (v) and (vi) repeat isometric reference contractions at the initial and final lengths, respectively. If the repeat isometric reference contractions did not produce the same force (±0.1 N), trials were not used for analysis. All tests were
performed at a stimulation frequency of 30 Hz. All tests at the 9 mm s–1 speed were then repeated using a stimulation
frequency of 5 Hz.
Determination of force enhancement following stretching Following all stretching of muscles, activation was maintained for an additional 5 s. A 4 s period was typically sufficient for force transients to disappear. Therefore, steady-state force enhancement was determined 4.5 s after the end of stretching (Figs 2 and 3, first arrowhead). Similarly, following deactivation of the muscle, isometric measurements of the passive forces were continued for at least 5 s. Deactivation force transients disappeared within 2 s. Therefore, passive force enhancement measurements were made 3 s following deactivation when the force curves had reached a steady-state (Figs 2 and 3, second arrowhead).
Statistics
Because of the sample size (N=8), all statistical analyses were performed using a non-parametric, sign-rank test based on the χ2-distribution. The null hypotheses were those
presented in the introduction, and all testing was done with a single alternative hypothesis. The level of significance was chosen as P=0.05 in all cases. Therefore, by definition, any observation that is statistically significant must be made in at least seven out of the eight independent observations (muscles).
0 1 2 3 4 5 6 7 8 9 10 11
–10 –2
Length (mm)
S
ti
m
ula
tio
n
Time (s)
0 1 2 3 4 5 6 7 8 9 10 11
Time (s)
[image:3.612.51.298.75.248.2]3 s 4.5 s
Fig. 2. Schematic representation of the stretching tests on the ascending limb of the force–length relationship of the cat soleus muscle. Muscles were stretched by 8 mm (approx. 20 % of optimal fibre length) at a speed of 4 mm s–1 (approx. 10 % of optimal fibre
length s–1). For all tests, the muscle was activated for 8 s at 3T (3×
the alpha-motoneuron threshold) starting at time 0 s. Steady-state total force enhancement following stretching was always determined 4.5 s after the end of the dynamic phase of contraction (i.e. at 7.5 s, see first arrowhead). Passive force enhancement following stretching was always determined 3 s after activation was stopped (i.e. at 11 s, see second arrowhead).
0 1 2 3 4 5 6 7 8 9 10 11
0 3 6 9
Length (mm)
S
ti
m
ula
tio
n
Time (s)
0 1 2 3 4 5 6 7 8 9 10 11
12
12 Time (s)
3 s 4.5 s
Fig. 3. Schematic representation of the stretching tests on the descending limb of the force–length relationship of the cat soleus muscle. Muscles were stretched for 3, 6 and 9 mm (approx. 7, 14 and 21 % of optimal fibre length) at speeds of 3, 9 and 27 mm s–1(approx.
7, 21 and 63 %, respectively, of optimal fibre length s–1). For all tests,
[image:3.612.317.570.75.251.2]Results
We observed a small, but consistent and statistically significant force enhancement on the ascending limb of the force–length relationship for tests at both stimulation frequencies (5 and 30 Hz; Fig. 4A,B, respectively). Therefore, hypothesis 1 was rejected. A summary of the mean force enhancement results is shown in Table 1.
The second hypothesis tested here was that the steady-state active force following stretch cannot exceed the isometric force at the muscle length from which the stretch was started (Morgan et al., 2000). This hypothesis was rejected. All stretches of 9 mm and at a speed of 3 mm s–1showed greater
steady-state active forces following the stretch (P<0.05) than the corresponding active isometric forces at the initial muscle length (Fig. 5). The average enhancement of force above the initial isometric force was 1.7±1.2 N (mean ±S.D., N=8) (or 8.5 % greater than the average isometric force at the initial length for stretches of 9 mm and performed at 3 mm s–1). This
force enhancement above the initial isometric force was not
as pronounced for the faster speeds of stretch (i.e. 9 mm s–1
and 27 mm s–1); however, all tests but one, at any speed,
showed enhancement of force above the initial isometric force (1.3±1.1 N, or 6.5 % greater than the average isometric force at the initial length; P<0.05); the one exception had the same force as the initial isometric force.
There has been controversy as to whether or not the amount of force enhancement is dependent on the magnitude of stretching (Morgan et al., 2000). For cat soleus, total force enhancement increased (P<0.05) with increasing magnitudes of stretch on the descending limb of the force–length relationship (Fig. 6). This result was observed for all eight muscles consistently, at all tested speeds (3, 9 and 27 mm s–1)
and for both frequencies of stimulation (5 Hz and 30 Hz) (Table 2).
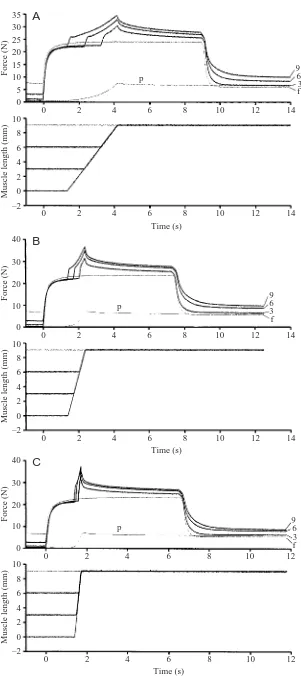
When stretching cat soleus on the descending limb of the force–length relationship, we observed a consistent passive force enhancement. This passive force enhancement was seen as an increase in force after the muscle had been deactivated in the active stretching trials compared to the isometric or the passive stretching trials (passive forces following isometric contractions and passive stretching trials were similar, Fig. 7A–C). This passive force
Fig. 4. Example results of force enhancement following muscle stretching on the ascending limb of the force–length relationship for stimulation frequencies of 5 Hz (A) and 30 Hz (B). A summary of the corresponding mean results across all muscles is shown in Table 1.
–1 0 1 2 3 4 5 6 7 8
–10 –8 –6 –4 –2 0
Muscle length (mm)
–1 0 1 2 3 4 5 6 7 8
0 5 10 15 20 25 30
For
ce (
N
)
Time (s)
A
–1 0 1 2 3 4 5 6 7 8
–10 –8 –6 –4 –2 0
Muscle length (mm)
–1 0 1 2 3 4 5 6 7 8
0 10 20 30 40 50
For
ce (
N
)
Time (s)
[image:4.612.44.293.317.691.2]B
Table 1. Force enhancement observed in the cat soleus muscle
on the ascending and descending limb of the force–length relationship for 5 Hz and 30 Hz stimulation frequencies
Force enhancement (N)
Ascending limb Descending limb
5 Hz 30 Hz 5 Hz 30 Hz
0.4±0.3 1.4±0.8 4.1±2.0 5.1±1.3
Values are means ± 1 S.D. (N=8).
The amount of stretching on the ascending limb was 8 mm at a speed of 4 mm s–1; the corresponding values from the descending
limb are 9 mm at a speed of 9 mm s–1.
All force enhancements are statistically different from 0.
Table 2. Force enhancement following stretching on the
descending limb of the force–length relationship of the cat soleus muscle under different conditions
Force enhancement (N)
Speed of stretching (mm s–1) 3 9 27
Frequency of stimulation (Hz) 30 5 30 30
Magnitude of stretching (mm)
3 2.4±0.7 3.2±1.9 2.4±0.5 2.0±0.6
6 4.1±1.2 4.0±2.0 4.2±1.0 3.7±1.0
9 4.9±1.5 4.1±2.0 5.1±1.3 4.4±1.3
Values are means ± 1 S.D. (N=8).
enhancement reached a steady state and persisted until the muscle was shortened. Passive force enhancement was not observed on the ascending limb of the force–length relationship.
Passive force enhancement increased with increasing magnitudes of muscle stretching (Fig. 7, Table 3), and decreased with increasing speeds of stretching for the greatest magnitude of stretch (i.e. 9 mm, Table 3). The total force enhancement that could be accounted for by the passive force enhancement ranged from 8.3 % (3 mm stretch at 9 mm s–1) to
83.7 % (9 mm stretch at 3 mm s–1). For all stretches of 6 mm or
more, passive force enhancement accounted for more than 50 % of the total force enhancement (Table 3).
Discussion
Based on the idea of the development of sarcomere length non-uniformities upon contraction and stretching of a muscle
on the descending limb of the force–length relationship, a theory was put forward to link sarcomere length non-uniformity directly to the steady-state force enhancement following muscle stretching (Morgan, 1990; Morgan et al., 2000). Two basic hypotheses arising from this theory were tested here. Both of these hypotheses were rejected in this study (Figs 4 and 5, Table 1).
Rejection of these two hypotheses does not imply that sarcomere length non-uniformity is not a factor in force enhancement following stretching. However, it implies that sarcomere length non-uniformity alone cannot explain all of the force enhancement following muscle stretch.
Active isometric force decreases with increasing length on –2
0 2 4 6 8 10
Muscle length (mm)
–1 0 1 2 3 4 5 6 7 8 9
–1 0 1 2 3 4 5 6 7 8 9
0 –10 10 20 30 40 50
For
ce (
N
)
Time (s)
[image:5.612.57.356.71.263.2]s i f
Fig. 5. Example force–time traces of active force (total – passive force) on the descending limb of the force–length relationship. The 9 mm stretch was associated with a steady-state active force following stretching (s) that exceeded the corresponding active isometric forces obtained at the initial (i) and final (f) muscle length.
–2 0 2 4 6 8 10
Muscle length (mm)
–1 0 1 2 3 4 5 6 7 8 9
–1 0 1 2 3 4 5 6 7 8 9
0 5 20 25
10 15 30 35
For
ce (
N
)
Time (s)
9
[image:5.612.229.551.75.263.2]3 f 6
Fig. 6. Total isometric force (active + passive force) at the final length (f), and total isometric force following muscle stretching of 3 mm, 6 mm and 9 mm (3, 6 and 9, respectively) to the final length (f) for representative tests at a stretching speed of 3 mm s–1. Note that
the steady-state force enhancement following stretching increases with increasing magnitudes of stretching on the descending limb of the force–length relationship of cat soleus muscle. The corresponding mean results of force enhancement across all muscles, speeds of stretching, and activation frequencies are summarized in Table 2.
Table 3. Passive force enhancement following active stretching of cat soleus muscle on the descending limb of the force–length
relationship as a function of the amount and the speed of stretching
Force enhancement (N)
Speed of stretching (mm s–1) 3 9 27
Passive % Passive % Passive %
Magnitude of stretching (mm)
3 0.3±0.4 12.5 0.2±0.2 8.3 0.2±0.1 10.0
6 2.2±0.9 53.7 2.2±0.5 52.3 2.0±0.3 54.1
9 4.1±1.6 83.7 3.6±0.7 70.6 2.8±0.5 63.6
Values are means ± 1 S.D. (N=8).
[image:5.612.58.570.602.700.2]the descending limb of the force–length relationship. Because of this isometric behavior, muscles on the descending limb of the force–length relationship have been said to have ‘softening’ properties (Zahalak, 1997), and as a consequence, force production was said to be unstable. However, an apparent ‘softening’ property obtained during static testing, e.g. when determining the isometric force–length relationship of a muscle or fibre (Gordon et al., 1966) does not imply that a material is indeed softening. The result that the active force enhancement following stretch typically exceeded the active isometric force at the initial muscle length supports the idea that the active force-producing mechanism provides stability on the descending limb of the force–length relationship. This stability is further enhanced in some muscles, including the cat soleus tested here, by passive forces that come into play at lengths corresponding to the optimal length of the muscle and on the descending limb of the force–length relationship.
A novel mechanism for force enhancement The steady-state passive force following deactivation of an actively stretched muscle was always greater than the steady-state passive force at the same muscle length following an isometric contraction or a passive stretching of the muscle (Fig. 7, Table 3). If we assume that this passive force enhancement is caused by the active stretch, as suggested by DeRuiter et al. (2000), it would account for more than 50 % of the total force enhancement for all stretches of 6mm and beyond. For a 9 mm stretch at 3 mm s–1, passive force
enhancement was, on average, 4.1 N and accounted for 83.7 % of the total force enhancement. It should
0 2 4 6 8 10 12 14
–2
0 2 4 6 8 10 12 14
0 5 10 15 20 25 30 35
0 2 4 6 8 10
Muscle length (mm)
For
ce (
N
)
Time (s)
A
p
9 6 3 f
0 2 4 6 8 10 12 14
–2
0 2 4 6 8 10 12 14
0 10 20 30 40
0 2 4 6 8 10
Muscle length (mm)
For
ce (
N
)
Time (s)
B
p
9 6 3 f
0 2 4 6 8 10 12
–2
0 2 4 6 8 10 12
0 10 20 30 40
0 2 4 6 8 10
Muscle length (mm)
For
ce (
N
)
Time (s)
C
p 96
[image:6.612.44.345.63.745.2]3 f
Fig. 7. Total isometric force (active + passive force) at the final length (f), passive force for a muscle stretched from 0 mm to 9 mm (p), and total isometric force following muscle stretching of 3 mm, 6 mm, and 9 mm (3, 6 and 9, respectively) to the final length for representative tests at a stretching speed of 3 mm s–1
(A), 9 mm s–1(B), and 27 mm s–1(C). Note the passive
be noted here that the passive force enhancement always persisted for the 5–10 s period for which the muscle was held at the final length following active stretching. Once the muscle was shortened to its recovery length (–10 mm) and reactivated for the next test, all passive force enhancement had been abolished in all tests and for each muscle. This result indicates that the passive force enhancement was not caused by structural damage to the muscle associated with stretching. The idea that damage did not contribute to the passive force enhancement is further supported by the fact that only trials in which the isometric reference contractions before and after the stretching were the same (±0.1 N) were used for analysis.
Based on the passive force enhancement results, we conclude that total residual force enhancement of cat soleus on the descending limb has two components: an active and a passive force enhancement component. The absolute and the percentage force contribution of the active component of force enhancement decreases while the corresponding passive component of force enhancement increases with increasing magnitude of stretching. No passive force enhancement was observed in any of the stretches performed on the ascending limb of the force–length relationship.
During normal locomotion (walking, trotting), the cat soleus muscle operates on the ascending limb and the plateau of the force–length relationship. Soleus length changes for walking, trotting, and galloping are approximately 10 mm, 13 mm and 15 mm, respectively, during the stance phase, and the corresponding rates of muscle length changes are approximately 25 mm s–1, 130 mm s–1 and 300 mm s–1,
respectively (Goslow et al., 1973). Therefore, the magnitudes and speeds of stretch are well within physiologically relevant values. Although corresponding data are not available for tree climbing and full-speed galloping, there is no evidence that cat soleus ever operates on the descending limb of the force–length relationship during normal movements. Therefore, the passive force enhancements observed on the descending limb of the force–length relationship might not have immediate relevance to normal cat movement. We interpret the present results as follows: imagine that a muscle is actively stretched to a length exceeding its normal operating length. Such active stretching is associated with a distinct possibility of muscle injury and severe tearing of soft tissue structures. In this situation, a passive force beyond that observed during passive stretching develops and prevents, to a certain extent, the overstretching of the active muscle. Therefore, the additional passive force enhancement observed here may not represent a normal physiological response of muscle. Rather, it may represent a safety mechanism intended to prevent tearing and injury of an actively stretched muscle.
The idea that force enhancement has the properties of a passive elastic element has been proposed, but not demonstrated, before. Noble (1992) and Edman and Tsuchiya (1996) suggested that force enhancement behaves like an elastic structure that engages at the length of initial muscle activation. Forcinito et al. (1998) used this idea in a rheological muscle model to account for force depression and force
enhancement following shortening and stretching, respectively. However, this is the first report to demonstrate experimentally and evaluate systematically the contribution of passive force enhancement to the total force enhancement. We observed a similar passive force enhancement to that shown in Fig. 7 in pilot studies using single fibres of frog Rana pipiens tibialis anterior (Wakeling et al., 2000), and in cat semitendinosus and human adductor pollicis (Lee et al., 2001; Schachar et al., 2000).
The results of the present study do not allow us to determine the origin of the passive force enhancement. However, the molecular spring titin could produce the observed results. Titin is a spring whose characteristic length and stiffness changes with the unfolding of molecular bonds in the so called immunoglobulin domain (Kellermayer et al., 1997; Marszalek et al., 1999; Rief et al., 1997). If we assume, for example, that these molecular bonds increase in strength when the biochemical environment is that of an active muscle (increase in free Ca2+ levels) compared to that of a passive
muscle, fewer molecular bonds in titin might be broken when the muscle is pulled to a given length under active compared to passive conditions. Evidence in support of this theory has been reported by Tatsumi et al. (2001) and Yamasaki et al. (2001). Therefore, the stiffness of titin might increase (because the characteristic molecular length is decreased) in active compared to passive muscle stretching. Thus, the passive force in titin would be greater following active compared to passive stretching. The same result could be obtained if under active conditions, molecular unfolding was not as complete as under passive conditions, or if the characteristic length of titin depends on the sarcomere length at which activation occurs.
The idea of titin behaving like an ‘activatable’ spring has been tested before and was rejected. Horowits et al. (1989) stated that the elastic properties of titin are unaltered by activity, Ca2+ and cross-bridge activity, although the elastic
properties were not directly determined. However, Tatsumi et al. (2001) showed that the secondary structure of the elastic part of titin was changed by the binding of Ca2+. They
concluded from this result that the stiffness of titin might change during the contraction–relaxation cycle of skeletal muscle. Similarly, Yamasaki et al. (2001) found that cardiac titin interacted with actin in a dose-dependent manner, based on the contraction of the soluble calcium-binding protein S100A1. These interactions were shown to modulate the passive stiffness, and were hypothesized to provide a mechanism for changing titin-based force prior to active contraction.
unaffected by the shortening, therefore apparently disproving this idea for force enhancement. However, the shortening-stretch cycles in the experiments by Edman et al. (1982) were separated by an interval of approximately 1 s. When performing shortening-stretch experiments that follow each other directly (i.e. without a time delay), we found that the distance of shortening preceding a stretch decreased the amount of force enhancement in a dose-dependent manner (Herzog and Leonard, 2000).
Edman and Tsuchiya (1996) found residual force enhancement after stretch of frog tibialis anterior muscle fibres. This force enhancement was linearly related to the slow component of tension rise during stretch. Furthermore, when released against a small load, the force transients of the previously stretched fibres exhibited a greater and steeper decrease than those obtained from isometric contractions without previous stretching. These results were interpreted by Edman and Tsuchiya (1996) as originating from the elongation of a passive, elastic, cytoskeletal protein. They speculated that titin or nebulin could fulfil this role.
There is no obvious explanation for the remnant active force enhancement observed in our study. The sarcomere-length non-uniformity theory does not provide an easy explanation for this phenomenon, because active force enhancement (the absolute and percentage values) decreased with increasing stretching distance, whereas one would expect that sarcomere length should become more non-uniform with increasing stretching distance and, therefore, active force enhancement should increase as well, which it does not. A potentially interesting and novel explanation for the active component of force enhancement was suggested by Linari et al. (2000). They studied force enhancement following stretching in single frog fibres using a mechanical and an X-ray diffraction approach. Combining results from stiffness and force measurements with the intensity of the third-order myosin meridional X-ray reflection, they concluded that active force enhancement was caused by a residual increase in the number of attached cross-bridges. This result agrees with our own investigations on cat soleus, where stiffness was increased in the force-enhanced state following muscle stretching, compared to the corresponding reference contraction, suggesting that the force enhancement is caused by an increased number of attached cross-bridges (Herzog and Leonard, 2000). Although this is an exciting result and definitely warrants further investigation, it would be hard to reconcile long-lasting force enhancement with a mechanism involving cross-bridge cycling.
Conclusions
Based on the results of this study, we conclude that the sarcomere-length non-uniformity theory does not explain all of the force enhancement following stretching of cat soleus on the descending limb of the force–length relationship. We further propose that for many contractile conditions, specifically the stretching tests of 9 mm magnitude, the active force properties of cat soleus are stable on the descending limb of the
force–length relationship. Finally, we suggest that part of the force enhancement of muscles following stretch is caused by an ‘activatable’ passive element that changes its stiffness, and therefore force output, at a given length, during active stretching compared to passive stretching.
NSERC of Canada is acknowledged for financial support.
References
Abbott, B. C. and Aubert, X. M. (1952). The force exerted by active striated muscle during and after change of length. J. Physiol. 117, 77–86. DeRuiter, C. J., Didden, W. J. M., Jones, D. A. and de Haan, A. (2000).
The force-velocity relationship of human adductor pollicis muscle during stretch and the effects of fatigue. J. Physiol. 526.3, 671–681.
Edman, K. A. P., Elzinga, G. and Noble, M. I. M. (1978). Enhancement of mechanical performance by stretch during tetanic contractions of vertebrate skeletal muscle fibres. J. Physiol. 281, 139–155.
Edman, K. A. P., Elzinga, G. and Noble, M. I. M. (1982). Residual force enhancement after stretch of contracting frog single muscle fibers. J. Gen. Physiol. 80, 769–784.
Edman, K. A. P. and Tsuchiya, T. (1996). Strain of passive elements during force enhancement by stretch in frog muscle fibres. J. Physiol. 490, 191–205.
Forcinito, M., Epstein, M. and Herzog, W. (1998). Can a rheological muscle model predict force depression/enhancement? J. Biomech. 31, 1093–1099.
Gordon, A. M., Huxley, A. F. and Julian, F. J. (1966). The variation in isometric tension with sarcomere length in vertebrate muscle fibres. J. Physiol. 184, 170–192.
Goslow, G. E., Reinking, R. M. and Stuart, D. G. (1973). The cat step cycle: Hind limb joint angles and muscle lengths during unrestrained locomotion. J. Morphol. 141, 1–42.
Herzog, W. and Leonard, T. R. (1997). Depression of cat soleus forces following isokinetic shortening. J. Biomech. 30, 865–872.
Herzog, W. and Leonard, T. R. (2000). The history dependence of force production in mammalian skeletal muscle following stretch-shortening and shortening-stretch cycles. J. Biomech. 33, 531–542.
Hill, A. V. (1953). The mechanics of active muscle. Proc. R. Soc. Lond. 141, 104–117.
Horowits, R., Maruyama, K. and Podolsky, R. J. (1989). Elastic behaviour of connectin filaments during thick filament movement in activated skeletal muscle. J. Cell Biol. 109, 2169–2176.
Huxley, A. F. (1957). Muscle structure and theories of contraction. Prog. Biophys. Biophys. Chem. 7, 255–318.
Huxley, A. F. and Simmons, R. M. (1971). Proposed mechanism of force generation in striated muscle. Nature 233, 533–538.
Kellermayer, M. S. Z., Smith, S. B., Granzier, H. L. M. and Bustamante, C. (1997). Folding-unfolding transitions in single titin molecules characterized with laser tweezers. Science 276, 1112–1116.
Lee, H. D., Dinning, H. and Herzog, W. (2001). Stretch-induced force enhancement in human adductor pollicis during electrical and voluntary stimulation. International Society of Biomechanics 2001, July 8–13, Zurich, Switzerland. p.21.
Linari, M., Lucii, L., Reconditi, M., Vannicelli Casoni, M. E., Amenitsch, H., Bernstorff, S. and Piazzesi, G. (2000). A combined mechanical and x-ray diffraction study of stretch potentiation in single frog muscle fibres. J. Physiol. 526.3, 589–596.
Maréchal, G. and Plaghki, L. (1979). The deficit of the isometric tetanic tension redeveloped after a release of frog muscle at a constant velocity. J. Gen. Physiol. 73, 453–467.
Marszalek, P. E., Lu, H., Li, H., Carrion-Vazquez, M., Oberhauser, A. F., Schulten, K. and Fernandez, J. M. (1999). Mechanical unfolding intermediates in titin molecules. Nature 402, 100–103.
Morgan, D. L. (1990). New insights into the behavior of muscle during active lengthening. Biophys. J. 57, 209–221.
Morgan, D. L. (1994). An explanation for residual increased tension in striated muscle after stretch during contraction. Exp. Physiol. 79, 831–838.
slow stretch or shortening of the contracting muscle. J. Physiol. 522.3, 503–513.
Noble, M. I. M. (1992). Enhancement of mechanical performance of striated muscle by stretch during contraction. Exp. Physiol. 77, 539–552. Rief, M., Gautel, M., Oesterhelt, F., Fernandez, J. M. and Gaub, H. E.
(1997). Reversible unfolding of individual titin immunoglobulin domains by AFM. Science 276, 1109–1112.
Schachar, R., Herzog, W. and Leonard, T. R. (2000). Stability and the descending limb of the force–length relation in mammalian skeletal muscle. Proceedings of the XIth Congress of the Canadian Society for Biomechanics 148.
Sugi, H. and Tsuchiya, T. (1988). Stiffness changes during enhancement and deficit of isometric force by slow length changes in frog skeletal muscle fibres. J. Physiol. 407, 215–229.
Tatsumi, R., Maeda, K., Hattori, A. and Takahashi, K. (2001). Calcium
binding to an elastic portion of connectin/titin filaments. J. Muscle Res. Cell. Motil. 22, 149–162.
Tsuchiya, T. and Edman, K. A. P. (1990). Mechanism of force enhancement after stretch in intact single muscle fibres of the frog. Acta Physiol. Scand. 140, 23A.
Wakeling, J., Herzog, W. and Syme, D. (2000). Force enhancement and stability in skeletal muscle fibers. XIth Congress of the Canadian Society for Biomechanics, 145.
Yamasaki, R., Berri, M., Wu, Y., Trombitás, K., McNabb, M., Kellermayer, M., Witt, C., Labeit, D., Labeit, S., Greaser, M. L. and Granzier, H. L. M. (2001). Titin-actin interaction in mouse myocardium: passive tension modulation and its regulation by Calcium/S100A1. Biophys. J. 81, 2297–2313.