Bent O. Kjos
1Richard L. Ehman
Michael Brant-Zawadzki
This article appears in the MarchI April 1985 issue of AJNR and the June 1985 issue of AJR.
Received July 5, 1984; accepted after revision September 20, 1984.
Presented at the annual meeting of the American Society of Neuroradiology, Boston, June 1984.
1 All authors: Department of Radiology, S-358, University of California School of Medicine, San Francisco, CA 94143. Address reprint requests to M. Brant-Zawadzki.
AJNR 6:277-283, March/April1985 0195-6108/85/0602-0277 © American Roentgen Ray Society
277
Reproducibility of T1 and T2
Relaxation Times Calculated
from Routine MR Imaging
Sequences:
Phantom Study
Measurement of nand T2 relaxation times has been sought as one fundamental way to characterize tissue. Relaxation times can be calculated from routine spin-echo (SE) imaging sequences using two distinct repetition times (TRs), each with two SE samplings of signal intensity. Previous reports have quantified relaxation times without discussing the variation in their measurements. By imaging a phantom containing different samples with known T1 and T2 relaxation times on three separate occasions, the variation in relaxation time measurements inherent in different routine imaging sequences was studied. For the present study a more complete and accurate equation was used to calculate n values. The variation in nand T2 relaxation times for samples with relaxation times similar to solid tissue was 2%-4%. The amount of variability in calculated relaxation times was found to be dependent on the magnitude of the relaxation times themselves. However, the mean values were independent of the imaging sequences used to calculate the relaxation times. No significant differences were seen between left-to-right or section-to-section position within the same study or between studies performed on different occasions. The variability in the calculated n was dependent on the pair of TR sequences used to calculate n. Samples with long nand T2 relaxation times, similar to many body fluids, had much larger variability. A computer simulation of measurement error was created to explain these results. This study indicates that properly performed routine imaging studies do yield reproducible nand T2 measurements.
In
magnetic resonance (MR) imaging, signal
intensity
depends on both tissue
and instrument parameters. In stationary solid tissue,
signal intensity is mainly
dependent
on
the
T1 and
T2 relaxation times and on the resonating hydrogen
density. Alterations of these tissue parameters produce changes in signal intensity
and thereby cause perceptible contrast changes on MR images. The signal intensity
also depends on
instrument
parameters,
including the selected imaging sequence
and the receiver gain. The distinct intensity observed from any specific region, that
is
, image contrast, is clearly affected by these instrument settings. While the relative
intensities
of two regions in any imaged section will vary with different
operator-selectable imaging sequences, the observable relaxation times and resonating
proton density represent physical characteristics of the tissue that are independent
of imaging sequences or other machine parameters. Therefore, the measurement
of T1 and T2 relaxation times and resonating proton density has been sought as
one of the fundamental ways of characterizing
tissue
using MR imaging
.
Because of practical and physical
constraints,
measurement of T1 and T2
relaxation times using MR imagers is limited compared with in vitro
spectrometers
,
which make more measurements on small samples of tissue. However
,
the
imager-generated values are nevertheless important since clinical decisions might be made
on the basis of this data. Studies at various field strengths have presented relaxation
times of normal brain structures
,
but data
concerning the
variation in
relaxation
278
KJOS ET AL.
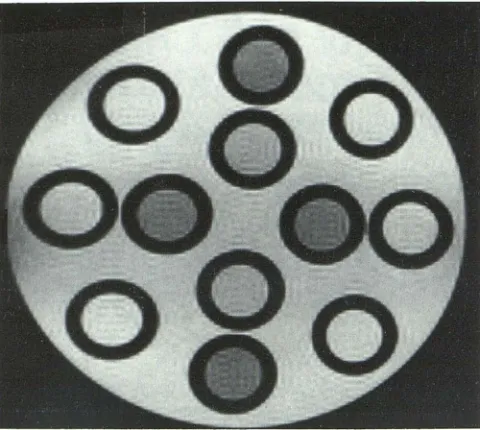
AJNR:6, March/April 1985Fig. 1. -MR image of phantom viewed at narrow windows. Twelve cylindri-cal sample tubes containing different solutions of Gd-DTPA are imaged in cross section. Background matrix is cupric sulfate solution. Higher intensity of upper and lower parts of background solution, secondary to receiver coil geometry.
abnormalities in the relaxation times relative to normal brain,
without giving the variability of T1 and T2 in normal brain and
the amount that the relaxation times differed from normal
[3]
.
Early reports on our prototype system suggested
sub-stantial variation in calculated values of normal and abnormal
brain tissue [4]
.
Improved coil design and electronic hardware
havebeen incorporated in the production model of our imager.
This report discusses the reproducibility of T1 and T2
meas-urements made from routine imaging sequences using the
clinical MR imager operating at 0
.
35 T. The methology of
such calculations is also addressed.
Materials
and
Methods
Both phantom and human-subject data were analyzed; the latter are discussed separately [5]. The phantom was imaged on an MR imager using a superconducting magnet operating at 0.35 T (Oiason-ics MT/S). A 25 cm head coil was used. Multiple-slice spin-echo (SE) sequences were performed with four separate repetition times (TRs) of 500, 1000, 1500, and 2000 msec, with five to 20 slices obtained simultaneously, two echoes (TEs) of 28 and 56 msec sampled in each slice. The matrix size was 128 x 128; yielding a voxel size of 1 .7 x 1.7 x 7.0 mm. Four averages of the signal were obtained at each slice. The phantoms were imaged in this manner on three separate occasions so the variability between different studies could be determined. The imager and the pulse sequences have been described more completely [6-8].
The phantom in our study was a Lucite cylinder containing 12 axial compartments in which sample tubes containing different substances could be placed (fig. 1). The volume surrounding these sample tubes was filled with a dilute solution of copper sulfate. The sample tubes within the phantom are readily interchangeable. For our study, eight distinct samples with different T1 and T2 relaxation times were used in the 12 different locations. These samples were solutions of different
~'---l
Fig. 2.-Dual SE pulse sequence used to obtain relaxation values. For each sequence, two 1800 radio frequency pulses were performed at 14 msec TI and 42 msec TI (3TI). Intensity measurement occurs at TEs of 28 msec (2TI) and 56 msec (4TI), e" and e2, respectively. Four imaging sequences were performed with 500,1000,1500, and 2000 msec TRs.
concentrations of gadolinium diethylenetriaminepentaacetic acid (Gd-OTPA). Four different samples were used in the four midline locations. Two identical sample tubes of each of the other four different solutions were placed in the four pairs of sample locations positioned symmet-rically about the midline. In this manner, any variation between left and right in the imaging field for identical samples could be ascer-tained. The solutions were chosen to have T1 and T2 values similar to those of gray matter, white matter, fat, muscle, and cerebrospinal fluid based on measurements using a Praxis NMR spectrometer operating at 10 MHz. The T1 relaxation rates of our samples were about 5%-1 0% faster when measured by our spectrometer operating at 10 MHz than the relaxation rates of the same samples measured on our imager operating at 15 MHz. This expected relaxation time dispersion was considered when choosing samples to be measured in the imaging instrument in this study.
Regions of interest (ROls) were obtained for every one of the 12 samples in each of three adjacent sections for each of the three studies performed on separate occasions. Eight ROls were also obtained in different locations within the surrounding copper sulfate matrix of the phantom. The sample ROls contained 80 to 124 pixels, while the background ROls contained 48 to 64 pixels. For each ROI, the mean intensity and standard deviation (SO) of the intensity was measured for the eight images of each section based on the four standard TR and two TE settings available on our imager. Using these mean intensity values, the T1 and T2 values were calculated using the SE equation for two SEs:
1= k(N[H])(1 - 2eITR-3T/I/Tl
+
2eITR-T/I/Tl - exp-TR/Tl)(e- TE/ T2 ). (1) The meaning of the symbols is explained (fig. 2). The absolute intensity measurements are meaningful only within the context of a single study, since the absolute intensities are not corrected for the receiver gain, which is variable for different studies. This variability is reflected in equation 1 by the unknown term, k, which varies from study to study depending on instrument settings. The T1 values of the ROls were calculated using an iterative technique based on the intensities of the first echo samplings (28 msec TE) of two different TRs. Four different pairs of TR sequences were used for calculating T1 relaxation times: 500/2000, 500/1500, 500/1000, and 1000/2000 msec. T2 values were calculated directly for each of the four TR sequences by using the intensities of both echo samplings for each TR. Thus for each ROI, four different T1 values and four different T2 values were calculated. [image:2.612.320.560.73.190.2] [image:2.612.60.300.85.300.2]AJNR:6, March/April 1985
REPRODUCIBILITY OF IMAGER-CALCULATED
T
1 AND T2
279
0.'
z
~
...
'"
N ;::w
z
"
'"
~ ...J'"
~C 0.3
::J ~
"
z
g
..
200 600 800
TIME I msec I
- Complete Formula -- - Simplified Formula
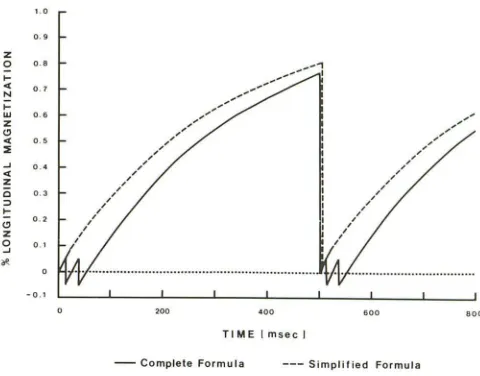
Fig. 3.-Comparison of longitudinal magnetization described by simple and more complete formulas using two SEs, 300 msec T1 and 500 msec TR.
Interrupted line demonstrates longitudinal remagnetization as described by simple formula. This assumes a simple exponential remagnetization. Solid line
demonstrates actual remagnetization as described by more complete formula. Note reversing effect of 1800 pulses on longitudinal component of magnetiza-tion at 14 and 42 msec. Actual remagnetization is less than described by simple formula. Lines shown are in appropriate scale for substance of T1 relaxation times of 300 msec.
on the saturation recovery model for the SE experiment [3, 4, 6-8]:
1= k(N[H]) (1 - e-TR1Tl) (e-TEIT2). (2)
This simplified equation does not consider the effect of the dual 1800
sampling pulses on the longitudinal component of magnetization. This
is graphically illustrated in figure 3. The result is a systematic error in the calculated T1 value, which becomes larger as the inversion time (TI) in equation 1 becomes significant, such as for short TR sequences and for longer TI values. The discrepancy between the two equations is the subject of a separate communication [9].
Both the 900
and 1800
excitation pulses are slice-selective radio-frequency pulses with a sin (bt)/t envelope resulting in an approxi-mately rectangular slice-selection profile. This sin(bt)/t envelope gives both more uniform slice widths for various TR settings and also significantly more uniform slice excitation than a gaussian envelope [10-12]. There will still be some flip angle inhomogeneity within the slice, especially at the edges of the slice. This may contribute to the variation of relaxation time measurement that we observed.
The variations of the calculated T1 and T2 relaxation times for each of the different samples were evaluated in three different ways. First, the overall mean T1 and T2 relaxation times for each sample and the SOs of these means were calculated. The individual ROls from studies from the three separate occasions were subdivided by sample type, and the mean and SO of the calculated T1 and T2 relaxation value for each sample were measured. This was done for all eight distinct samples and for the background-matrix ROls.
Second, the variation in the T1 and T2 relaxation times between left and right within the same slice and within the same study was measured for each of the four pairs of comparable left-right regions containing identical sample types. The percentage difference and the SO of the percentage difference was measured. This was also done on four pairs of background-matrix ROls located symmetrically about the vertical midline.
Third, the variation in the T1 and T2 relaxation times of each sample from slice to slice within the same study was measured. The
percentage difference in the calculated T1 and T2 value between the center slice and two different off-center slices was measured as well as the SO of this percentage difference. This was done for each of the 12 sample locations and the eight background locations .
Not only was the variation in the relaxation rates measured in different ways, the dependence of this variation on the machine parameters and on the relaxation rates themselves was investigated. The variation in the calculated T1 value was compared for samples
with different T1 relaxation times. More specifically, the percentage SO of the T1 measurement was related to the T1 relaxation value itself. The variation in the calculated T1 values was also compared for the different TR pairs used to calculate T1 relaxation times. A similar analysis was performed for the calculated T2 values. The T2 values obtained from different TR sequences for the same ROI were compared. The SO of the T2 values was related to the magnitude of the T2 relaxation times.
The variation in the intensity of the baCkground-matrix ROls was measured for the eight images of each section and compared with the variation in the calculated T1 and T2 relaxation times of the background ROls.
Finally, a computer model was created to determine optimal im
-aging sequences for measurement of T1 and T2 relaxation times by simulating the effect of errors in intensity measurement on the ca l-culated T1 and T2 values. As mentioned, the ratio of the intensities obtained from the first echoes of any two TR sequences is used to calculate T1 relaxation with the above equation. If the intensity variation in any measurement is, say 1 %, the maximum effect on the calculated T1 value will occur when the intensity error of the first echo from one TR sequence is increased by 1 %, while the intensity of the first echo from the other TR sequence is decreased by 1 %. For this Simulation, a 1 % intensity change was defined as a 1 %
change in the maximum possible intensity, that is, the intensity expected with TR = infinity and TE = O. The expected maximum and minimum T1 relaxation time changes were subsequently simulated for 0.5%, 1 %, and 2% variations in the intensity measurements. The effect of these errors in intensity measurement on the calculated T1 was determined for five different TR pairs. These results were com-pared with our experimental data.
A calculation was also performed to determine the range of T2 values best measured by a TE pair of 28 and 56 msec. In calculating T2 relaxation times, the ratio of intensities of the first and second echoes within one TR sequence is used. For a 1 % intensity variation, the maximum change in the calculated T2 value will occur when the intensity of the first echo increases by 1 %, the intensity of the second echo decreases by 1 %, and vice versa. The maximum effects of 0.5%, 1 %, and 2% intensity measurement errors on the calculated T2 values were determined for substances with different T2 relaxation times.
Results
Variation
[image:3.612.56.296.81.269.2]280
KJOS ET AL.
AJNR:6, March/April 1985TABLE 1: Variations in Calculated T1 and T2 Relaxation Times
Measured in Three Ways
Mean T1 %SD Mean T2 %50
Sample
(msec) All
SS LR (msec) All SS
A .. 1252.8 4.7 4.0 136.4 10.2 12.1
B 716.2 3.9 4.9 117.6 8.5 9.0
C .. 631.7 3.2 3.4 1.9 122.1 5.4 6.9
0 . . . 431.8 2.5 2.3 3.2 106.0 5.0 5.9
E
...
....
...
280.8 3.6 6.1 2.5 97.9 5.6 6.6F .. 62.0 2.1 2.8
G. 50.9 3.3 3.7
H. 39.8 3.0 3.1
Background 275.1 3.6 8.9 2.7 95.2 7.0 6.5
Note.-AII = SOs of all regions of interest considered separately; SS = slice-to-slice SOs; LR = SOs of left-right pairs.
variation within a study
from
one slice
to
another is shown as
well as
the variation between comparable regions within the
same slice
on
the
left and right of midline
.
The variation
in
T1
and
T2 values between the different studies was not greater
than the left-to-right
variation
or
the slice-to-slice variation
within the same
study. For the samples with T1 values similar
to normal
solid
tissues (280-720 msec), the SO of the T1
values was
2.5%-4%
. For samples with T2 values similar to
normal
solid
tissues (40-62 msec)
,
the SO of the T2 values
was 2
%
-3
.
5%.
Worth noting is the fact that the amount of variability of T1
and
T2 relaxation times depended on the magnitude of the
T1 and
T2 values themselves
.
Figures 4 and 5 demonstrate
the SO
of T1 and T2 measurements
relative to
the magnitude
of
the T1 and
T2 values
,
respectively
.
The T1 relaxation
measurements demonstrate the lowest SO for the samples
with
a
T1 relaxation time of
431-632
msec. Also
,
the SO of
T2
measurements is smaller for the samples with T2
relaxa-tion times of
40-62
msec
.
When viewing our images of the phantom at narrow
win-dows
,
the
intensity of the background matrix is not
homoge-neous. Because of receiver-coil proximity the anterior and
posterior
parts are more intense than
a
horizontally oriented
less intense band
through the
middle of the phantom (fig
.
1)
.
The variation
of
intensity within
a single study was measured
in the
background matrix
in
eight different locations
.
In
this
homogeneous material
in three different
sections,
the
SO in
the intensity of the
first echoes (28
msec
TE)
of
the
2000/500
TR sequences
was
7.2%
and 6.4
%,
respectively,
while
the
SO of the
corresponding calculated
T1 relaxation time was
only 3
.
7
%
.
The first and
second
echoes of the 2000 msec TR
sequence
used in
calculating
T2 had SOs in intensity of 7
.
2%
and
8.2
%,
respectively,
while the SO in the calculated T2
value was
only 6
.
7%
.
For
the
background
matrix
with a
T1
relaxation time
of
275
msec and a
T2 relaxation
time of 95.2
msec
,
when
im
aged
with a
TR
sequence
pair of 2000/500
msec
,
a
+
1
%
error in the measurement
of
the intensity
of the
first echo of
the
2000 msec
TR
will cause
a 2
.
5
%
error in
the
calculated T1 value and a
-3.3%
error
in
the
calculated
T2
value
.
Thus
,
the
variation in
the T1 and
T2 values
for the
background
material is much less than expected
if
the
varia-tion of the
measured intensity of
the
different section is
'"
w :::>...
'"
>
;:
,
'"
..
'
T 1 (sec)
Fig. 4.-S0s of T1 of different samples plotted as function of T1. Variation
in T1 is lowest in 400-650 msec range. T1 means and variations obtained from
500/2000 and 500/1500 msec TR sequence pairs.
VI •
w
::>
...
'"
> •
N
~
,
ci
vi
. . 3
30
T2 (msec)
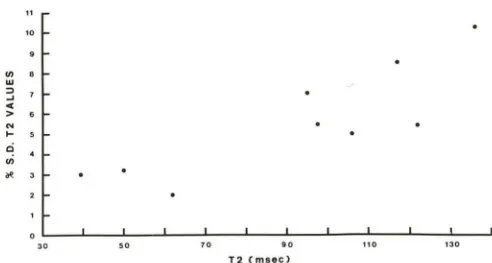
Fig. 5.-S0 of T2 of different samples plotted as function of T2. Variation
is less for samples of short T2 relaxation times (40-60 msec) and higher for long T2 samples (>90 msec).
independent of location. In this case
,
however, the band of
low intensity is present on all of the four images of a section
obtained with two TR sequences and two TEs each
.
This
intensity variation is largely canceled out in the
relaxation-time calculations. Thus
,
the calculated T1 and T2 relaxation
times
may be more reproducible than direct intensity
meas-urements in differentiating tissue
types.
Dependence on Machine Parameters
As mentioned in Materials and Methods, the T1 value of
the different regions was calculated using four different TR
sequence pairs: 500/2000
,
500/1500, 500/1000, and 1000/
2000 msec
.
These TR sequence pairs correspond to
those
often used in
the
past in clinical imaging at our institution. The
mean
T1
values and SOs for the different samples calculated
using these
four TR
pairs is shown in table 2. No significant
differences were present between
the
mean T1 values
ob-tained
from the four different TR sequence pairs
.
This would
not be
the
case if
the
simplified equation
(equation
2) were
used
[7]
.
Although
the
mean T1 values did not vary significantly
[image:4.613.316.561.82.218.2] [image:4.613.60.299.107.220.2] [image:4.613.315.561.291.423.2]calcula-AJNR:6, March/April 1985
REPRODUCIBILITY OF IMAGER-CALCULATED T1 AND
T2
281
TABLE 2: T1 Values and Standard Deviations Using Different
TR Sequence Pairs
Mean T1 (SO) per TR Pair (msec) Sample
500/2000 500/1500 1000/2000 500/1000
A 1252 (4.7) 1255 (4.8) 1290 (3.8) 1259 (12.9)
B 711 (3.6) 725 (4.2) 706 (5.8) 736 (3.9)
C ... . . . ... . 631 (3.3) 633 (2.9) 654 (5.1) 612 (4.2)
0 433 (2.4) 430 (2.6) 437 (3.1) 431 (4.0)
E 281 (3.8) 281 (3.0) 261 (21.3) 287 (3.3)
Background. 277 (3.4) 276 (3.0) 285 (9.9) 275 (4.3)
TABLE 3: T2 Values and Standard Deviations Using Different
TR Sequences
Mean T2 (SO) per TR Sequence (msec) Sample
2000 1500 1000 500
A 138.4 (8.1) 136.6 (9.3) 139.3 (10.4) 132.7 (11.9)
B. 118.6(7.8) 116.4 (6.8) 121.7 (7.4) 114.9 (9.7)
C ... 123.6 (5.5) 122.7 (4.1) 121.0 (3.7) 120.5 (6.3)
D . 106.0 (4.6) 105.0 (4.4) 107.2 (4.9) 105.9 (5.7)
E 98.3 (6.7) 97.6 (4.5) 98.3 (4.7) 97.4 (5.3)
F
...
..
.
..
.
61.8 (1.3) 62.1 (1.9) 62.3 (2.8) 62.1 (2.4)G. 51.1 (3.6) 50.5 (3.4) 51.2 (2.9) 50.8 (3.1)
H . 39.8 (4.0) 40.0 (1.7) 39.4 (2.6) 39.9 (2.5)
Background 97.8 (5.6) 94.4 (6.4) 95.1 (5.9) 95.6 (5.6)
tions
,
the SD did
vary
between different TR sequence pairs
.
As can be seen in
table
2, for all of the
samples
except the
one with the longest T1 relaxation
time
of 1253 msec
,
the
SD
was greater when the TR
sequence
pair of
1000/2000
msec
was used
than
for the other TR
sequence
pairs. This
higher
SD of the T1 values calculated using the 1000/2000
msec
TR
sequence
pair becomes greater for samples with
shortest
T1 relaxation times
.
No
significant
differences in the T1
relax-ation time variat
i
on were present between
the
500/2000 msec
TR pair and the 5
0
0/1500 msec TR pair
.
The T2 relaxat
i
on time for each sample
was
calculated
using each of the
four
different TR sequences. Thus
for each
ROI
,
four different T2 values were
calculated
.
As
shown
in
table 3
,
these calculated T2
relaxation times
as well as
their
SDs showed no significant differences
from
one TR sequence
to
another
.
Computer Simulation
The results of the computer simulation confirm the
experi-mental results
,
showing larger T1 calculation errors for
sub-stances with T1 relaxation times less than 300 msec or
greater than 900 msec
,
as well as the results showing
larger
error
for
calcu
l
ations based on
the
1000/2000 msec TR
sequence pair
.
Figure 6 demonstrates
the
maximum effect of
a 1
%
error in intensity measurement on
the
T1
calculation
using three different TR sequence pairs
.
We
see that effect
of an error in
intensity
measurement using a TR
sequence
pair of 500/2000 msec becomes significantly greater
for
substances with a T1 of less than 300 or greater than 900
msec. Of note, this TR
sequence
pair yielded
the smallest
5.,
.
.
,
z ~
.... ~
::J
2.
,
~
"
,.,
u
-
---
--
-
--
-
-
---
-
-
---::::::~-.::.::=---;:
..
~ -10)'
a:
0 a: -20,"
a:
[image:5.614.316.557.85.261.2] [image:5.614.56.296.108.195.2]w
...
---
-
---
-
---
-
---
-
-
--..
-30,"-40),
-50%
0.2 0.4 0.15 0.8 1.0 2 ••
ACTUAL T1 eooc)
0.5/2.0 sec - - 2.0/5.0 sec
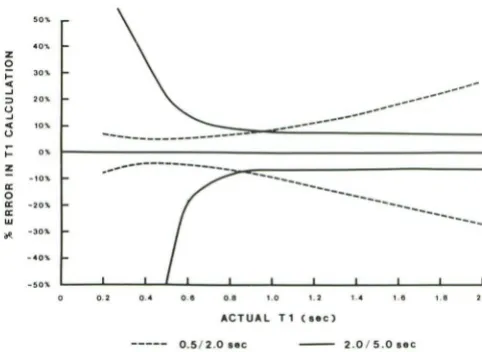
Fig. 6. -EHect of ±1 % intensity measurement error on calculated T1 values
compared for 500/2000 and 2000/5000 msec TR sequence pairs. Former sequence pair yields small errors of shorter T1 substances (similar to solid tissue), while latter yields small errors for long T1 substances (such as body
fluids).
errors in
T1
relaxation
measurements
of all of the TR pairs
for
equal-intensity errors
.
The
500/1500
msec
TR sequence
pair and
the
1000/2000 TR
sequence
pairs
are often clinically
used
in
T1
calculations,
but
as
is
seen
in figure
7 similar
-intensity
errors
will produce larger
T1 rela
x
ation
time errors
using
these
TR
sequence
pairs
than the 500/2000 msec pair
.
This
computer simulation confirms our e
x
perimental
measure-ments
that for the
T1
range of most
tissues
the variation in
T1
relaxation is
very
similar
for
the
500/2000
mse
c
and
t
he
500/1500 msec
TR
sequence pairs
.
Also both the simulation
and experimental
data
indicate that both of these TR pair
s
showed
less
variation
in
the T1 values than the 1000/2000
msec TR
sequence
pair.
It should be emphasized that for
the
TR
sequence pairs we
use
(2000
msec TR or less)
,
the effect
of an intensity
error
in
measuring
substances
with long T1 rela
x
ation
values
above
1500
msec
is large (such as for cerebrospinal or other fluids)
(fig
.
7)
.
Using
a simulated TR sequence pair of 2000/5000
msec (fig
.
6)
the effect on intensity variation would be much
smaller in such substances
.
While this
TR
sequence pair
would yield more accurate and
reproducible
T1 rela
x
ation
times for such fluids
,
this sequence would require a very long
imaging time
and
it would
be
unsuitable for measuring the T1
relaxation
t
imes
of solid
normal
tissues with T1
rela
x
ation
times
of less
than
1000 msec
.
As
seen
in
figure 8
,
for a
substance with a
T1 of 500 msec
,
a
1
%
intensity
measure
-ment
error will
lead
to a -50
%
to
+30
%
error
in the
calculated
T1 when a 2000/5000
msec
TR sequence
pair is
used
.
Figure 8
shows the maximum effect
of
a 1
%
intensity error
on the
calculated T2
values
for substances
of different
T2
relaxation times
.
From
this figure
,
it
is clear
that
substances
with T2 relaxation times of 30-90 msec are
least
susceptible
to significant
variations
in the calculat
i
on of T2 relaxation from
intensity-measurement
error.
This graph is similar to our
experimental results (fig
.
5)
.
As is seen in
both
our e
x
peri
[image:5.614.55.297.246.359.2]282
KJOS ET AL
.
AJNR:6, March/April198530%
Z
~ 0- 20%
"
..J:::> U
'0%
..J
"
U
;::
0% ~0:
0 -IO~
0:
0:
"'
..
-20"-30"
0.2 0.' 0.8 0.8 .. 0
,
.
.
...
ACTUAL T 1 I.oel
- - 0.5/2.0 sec _._.-. 0.5/1.5 sec ...••..• 1.0/2.0
Fig. 7.-Maximum positive and negative effects of ±1% error in
measure-ment of intensities on calculated T1 value for three different TR sequence pairs
used to calculate T1. Effect of intensity measurement error is much larger for
long T1 substances. For 500/2000 and 500/1500 msec TR sequence pairs,
effect of intensity measurement error is lowest in 300-700 msec range. This
corresponds to T1 value of most solid tissues. Finally, for substances with
short T1 relaxation times, 1000/2000 msec TR pair has large T1 error for small-intensity measurement errors.
of
fluids
with long T2 values are not well evaluated with SEs
obtained only at
28
and 56 msec.
Discussion
There
are
inherent limitations
in
accurate measurements of
T1 and
T2
relaxation values during routine
imaging
sequences
when
compared
with in vitro measurements
.
Potential
sources
of error
include
inhomogeneous radiofrequency
irra-diation,
gradient
nonlinearity
,
tissue bulk magnetic
suscepti-bility, diffusion
,
motion
,
and a lower signal-to-noise ratio
.
Nevertheless, given such limitations
,
reproducibility of those
measurements
that are
obtained is desirable. Our clinical
imaging system was able to calculate the T1 values by
routinely imaging
with two different TR sequences
.
However,
two TRs are the
minimum for this
calculation
,
and the inherent
problems in
attempting
to plot an exponential curve that
represents a given relaxation function
from
two
points is
obvious.
Similarly
,
the two SEs
we
use are the minimum
number necessary to
calculate
T2
.
If multiple pOints are used
to measure longitudinal or
transverse
relaxation
,
the accuracy
of the
measurement can
be
evaluated easily with
goodness-of-fit parameters
.
Because
only two points are used for both
the
T1 and T2 calculations,
there
is
no way to determine the
validity
of the
calculated values other
than
to test them with
known standards and/or
to measure the
reproducibility
of
such measurements
.
Even if
the
calculated values contain a
systematic
error,
the
values
may
nevertheless be very useful
in evaluating pathology
if
they
are reproducible
.
Given these
limitations,
the
question becomes how
repro-ducible are
T1
and T2 values generated
from routine
imaging
sequences?
Our
results show that for
samples with
relaxation
rates similar to those of
normal
body tissues
at 0
.
35 T, the
imager
-
based calculations
of
relaxation
values are in
fact
30"
z
o
20"
l-e(
...J ::l
U 10%
...J
e(
U
N 0"
I-Z
~ -10~
II: II:
W
~ -20"
-30%
/---40 80 120 160 200 240 280
ACTUAL T2 (msec)
Minimum Error - - Maximum Error
Fig. 8.-Effect of ±1% error in intenSity measurement on measurement of
T2 for TE pair of 28 and 56 msec. For substances with 30-80 msec T2, error
in measuring T2 relaxation times is lowest. This corresponds to T2 values of
normal solid tissues.
reproducible
.
Again, an imager measures the signal intenSity
of a region
,
and the relaxation times are calculated from these
intensities
.
The errors or variations in these intenSity
meas-urements are
responsible
for the variation in the calculated
T1 and T2 values. This dependence is not simple and linear
but reflects the complex relation between the relaxation times
of the substance and the imaging sequences used
.
The SD
in the calculated T1 and T2 relaxation times for our known
samples was only 2%-4%. In addition, the calculated
relax-ation values of a given sample was independent of
left-to-right and section-to-section positioning, and was stable on
separate occasions.
An important consideration in imager-based T1 and T2
measurements is the choice of imaging sequences
.
The
TR
and TE settings of the imager must be appropriate for the T1
and T2 relaxation values of the tissue. With our instrument,
using a short TR of 500 msec and a long TR of either 1500
or 2000 msec achieves the most reproducible results for
substances with T1 relaxation values similar to most
tis-sues-about 300-800 msec (at 0
.
35 T). A TR sequence pair
of 1000/2000 msec produced less reproducible results,
es-pecially for samples with a T1 relaxation time of less than 300
msec. This is because most of the longitudinal relaxation (T1)
in tissue where the T1 relaxation time is
less
than 1000 msec
has already occurred before the first measurement at 1000
msec takes place. While we do not have control over
the
TE
setting of our imager, a similar analysis on samples with
different T2 relaxation times
reveals
that for the TE pair of 28
and 56 msec
,
substances with T2 values of
40-60
msec
demonstrate the smallest variation
.
Again,
this
corresponds
[image:6.612.57.304.76.251.2] [image:6.612.315.561.79.288.2]AJNR:6, March/April 1985
REPRODUCIBILITY OF
IMAGER-CALCULATED T1 AND T2
283
The results reported herein document
the relative lack
of
instrument-related
variability in relaxation-time calculations
of
samples
with relaxation
times similar
to most
tissues
.
Other
sources
of variability exist when analyzing
living
subjects.
One difficulty in measuring
phantoms
is
the
lack of physiologic
and geometric variation inherent to
biologic
systems
. For this
reason, similar
analyses
of measurement of reproducibility
are needed
in human subjects.
These also have been
per-formed and
are
reported in another communication [5].
REFERENCES
1. Wehrli FW, MacFall JR, Shutts D, Breger R, Herfkins RJ.
Mech-anisms of contrast in NMR imaging. J Comput Assist Tomogr
1984;8: 369-380
2. Wehrli FW, MacFall JR, Glover GH, Grisby N. The dependence
of NMR image contrast on intrinsic and pulse sequence timing
parameters. Magnetic Resonance Imaging 1984;2: 3-16
3. Mills CM, Crooks LE, Kaufman L, Brant-Zawadzki M. Cerebral
abnormalities: use of calculated T1 and T2 magnetic resonance
images for diagnosis. Radiology 1984;150:87-94
4. Brant-Zawadzki M, Bartkowski HM, Ortendahl DA, et al. NMR
in experimental cerebral edema: value of T1 and T2 calculations.
AJNR 1984;5: 125-129
5. Kjos BO, Ehman RL, Brant-Zawadzki M, Kelly WM, Norman D,
Newton TH. Reproducibility of relaxation times and spin density
calculated from routine MR imaging sequences: clinical study of
the CNS. AJNR 1985;6:271-276, AJR 1985;144 (in press)
6. Crooks LE, Arakawa M, Hoenninger J, et al. Nuclear magnetic
resonance whole-body imager operating at 3.5 kGauss (work in
progress). Radiology 1982;143:169-174
7. Mills CM, Brant-Zawadzki M, Crooks LE, et al. Nuclear magnetic
resonance: principles of blood flow imaging. AJNR 1983;4: 1161
-1166, AJR 1984;142:165-170
8. Crooks LE, Mills CM, Davis PL, et al. Visualization of cerebral
and vascular abnormalities by NMR imaging. The effects of
imaging parameters on contrast. Radiology 1982;144:843-852
9. Ehman RL, Kjos BO, Brasch RC, Brant-Zawadzki M, Higgins
CB. Spin echo imaging: method for correction of systematic
errors in calculated T1 and spin density (abstr). In: Scientific
program. Society of Magnetic Resonance in Medicine (third
annual meeting). Berkeley, CA: SOCiety of Magnetic Resonance
in Medicine, 1984:206-207
10. Rosen BR, Pykett IL, Brady T J. Spin lattice relaxation time
measurements in two-dimensional nuclear magnetic resonance
imaging: corrections for plane selection and pulse sequence. J
Comput Assist Tomogr 1984;8:195-199
11. Bryant DJ, Payne JA, Bailes DR, Young IR. Effect of slice
distortion in MR imaging on accuracy of measurement. In: Sci
-entific program. Society of Magnetic Resonance in Medicine
(third annual meeting). Berkeley, CA: Society of Magnetic Res
-onance in Medicine, 1984: 1 09-11 0
12. Edelstein WA, Bottomley PA, Hart HR, Smith LS. Signal, noise,
and contrast in NMR imaging. J Comput Assist Tomogr