An experimental study on influence of aesthetic interface in B2C
E-retail website concerning first impression and behavioral intention
Yunfeng Hong
Master thesis of Communication Studies program New Media and Communication Technology
The Faculty of Behavioral Sciences University of Twente
2010
Supervisors:
Prof. Dr. M.F. Steehouder Dr. N.P. Kotamraju
Abstract
This study focused on exploring users’ attributed affect, cognitive process and behavior on high aesthetic website interface which had been overlooked in B2C E-retail researches. Basing on literature review of Munsell’s color harmony formula and Golden Section theory, this experiment conducted a 2×2 factorial design, in which there were two independent variables of aesthetical interface – layout balance (Golden Section layout vs. Symmetrical balance layout) and color harmony (color harmony vs. color disharmony), to investigate individual effect on three dependent variables, customers’ perceived attractiveness, emotions and behavioral intention to use. During the experiment, through respondent-driven sampling technique, 150 Chinese participants made assessment on emotional reflection and users’ behavioral intention of target website, and then gave responses to seven questions about its aesthetic quality. Ultimately, the results indicated that only the presence of layout balance significantly impacted on users’ emotion, whereas the presence of color harmony had no significant influence on three dependent variables. Due to the results of this study are inconsistent with previous studies, further researches should continuously devote to author’s research direction. Additionally, with respect to designing E-retail websites, the results suggested that website designer should adopt Golden Section layout rather than symmetrical balance layout. Besides that if E-retail websites are consisted of abound colorful images, designers should pay more attention on the structure rather than color scheme of interface frame.
Table of Content
Abstract... 2
Table of content... 3
List of figure... 5
List of table... 6
Chapter 1 Introduction... 7
1.1 China E-commerce... 7
1.2 The importance of aesthetic interface ... 7
1.3 Research question ... 8
1.4 Report structure... 8
Chapter 2 Theoritical background... 9
2.1 Objective aesthetic of E-retail website... 9
2.1.1 Balance ratio of layout ... 10
2.1.2 Color harmony ... 12
2.2 Effects of aesthetic ... 18
2.2.1 Aesthetics and usability ... 18
2.2.2 Aesthetics and overall satisfaction ... 19
2.2.3 Aesthetics and perceived information quality ... 20
2.2.4 Aesthetics and spending time on the site ... 20
2.2.5 Aesthetics and the likeliness of revisiting the website ... 20
2.3 Explanation of aesthetic interface trigger users’ emotion ... 21
2.4 Research hypothesizes ... 22
Chapter 3 Research method and experiment setting... 23
3.1 Research design... 23
3.2 Operationalization of Independent variables... 24
3.2.1 Layout balance ... 25
3.2.2 Color harmony ... 26
3.3 Operationalization of dependent variables... 29
3.3.1 Perceived attractiveness ... 29
3.3.2 Users’ emotion ... 30
3.3.3 Users’ behavioral intention to use... 31
3.4 Participants... 31
3.4.1 Participants recruiting ... 31
3.4.2 Personal characteristic of participant ... 32
3.4.3 Demographic of participants ... 33
Chapter 4 Data analysis and results... 35
4.1 Description statistics ... 35
4.2 The effectiveness of independent variables on dependent variables... 35
4.3 Correlation between dependent variables ... 36
4.4 The influence of personal characteristics ... 37
4.4.1 The influence of frequency of internet use on users’ behavioral intention ... 37
4.4.2 The influence of education on users’ behavioral intention ... 39
Chapter 5 Discussion and recommendations... 41
5.1 Findings... 41
5.2 Limitations ... 43
5.3 Contributions... 43
References... 44
Appendix-A: E-mail... 47
List of Figure
Figure 1. Golden Rectangle... 10
Figure 2. Parthenon in Athens, Greece... 10
Figure 3. Facial analyze of Mona Lisa ... 11
Figure 4. Caluation of Golden Section ratio... 11
Figure 5. RYB Color Wheel... 12
Figure 6. Analogous color scheme ... 13
Figure 7. Triadic color scheme... 13
Figure 8. Split-complementary color scheme... 13
Figure 9. Square color scheme ... 14
Figure 10. Rectangle color scheme ... 14
Figure 11. Complementary color scheme... 14
Figure 12. Tints - adding white to a pure hue... 15
Figure 13. Shades - adding black to a pure hue ... 15
Figure 14. Tones - adding gray to a pure hue... 15
Figure 15. Munsell’s Color System... 16
Figure 16. Munsell’s color harmony formula... 17
Figure 17. Research model ... 22
Figure 18. Original Eachnet website (homepage) ... 24
Figure 19. The variant website ... 24
Figure 20. Condition 1: Color harmony with Golden Section layout version ... 27
Figure 21. Condition 2: Color harmony with symmetrical balance layout version... 27
Figure 22. Condition 3: Color disharmony with Golden Section layout version ... 28
Figure 23. Condition 4: Color disharmony with symmetrical balance layout version ... 28
Figure 24. Chinese respondents-driven sampling models ... 31
Figure 25. Forbidden City ichnography ... 41
Figure 26. National Emblem ... 41
Figure 27. Tiananmen Square in Beijin... 41
List of Table
Table 1. China education system... 32
Table 2. Demographic table of respondents ... 33
Table 3. Means (M) and Standard Deviations (SD) on dependent variables ... 35
Table 4. Means and Standard Deviations of independent variables on dependent variables ... 36
Table 5. Two sample T-tests on pependent variables... 36
Table 6. Pearson Correlation and linear regression ... 36
Table 7. ANOVA output for layout balance and dependent variables ... 37
Table 8. Nonparametric test output (1) for age ... 38
Table 9. Nonparametric test output (2)... 38
Table 10. ANOVA output for color harmony and dependent variables ... 39
Table 11. Mean scores, standard deviations, number and Two-sample T-Test... 40
Chapter 1 Introduction
The first chapter primarily introduces current situation and development of E-commerce in China, and points out that improving the aesthetic of E-retail websites help to enhance users' behavioral intention to use target websites. At the end of this Chapter, the research question and paper structure are exhibited.
1.1 China E-commerce
During the havoc of current financial crisis, E-commerce distinguishes itself from other industries due to its remarkable low-cost and high-efficiency. However, some negative factors constrain E-commerce development from birth, such as customer diversity, insecurity payment, and unguaranteed logistics… it is believed that an unprecedented opportunity is facing towards E-commerce, especially in China, the largest and fastest-growing market all over the world. According to IDC (International Data Corporation) white paper, the entire E-commerce transaction in China reached 195-billion Euro in 2008, which maintained a more than 20% growth compared with its 160-billion Euros in 2007. China presented sharp contrast against the worldwide macroeconomic downturn accompanied with market depression. Meanwhile, this white paper pointed out that China E-commerce in the coming 5 years will continue manage a remarkable rapid growth and estimated that by 2010, the total transactions will reach 322 billion Euros (Zhang, 2008). Nevertheless, the previous investigations of Chinese consumption behavior can be counted on the fingers of one hand in distinct contrast with its prosperous E-commerce market represented.
1.2 Importance of Aesthetic
The effectiveness of aesthetic was empirically supported by extensive researches. Intuitively, it is evident that beautiful things can induce individual's desire (Norman, 2004). So, the visual appeal can influence human attitude, and is major determinant of success of the market is obvious (Bloch, 1995). Therefore, the visual effect of products design is increasingly considered by industries in order to carter to the increasing needs of fastidious customers.
1.3 Research Question
The research question is whether an aesthetic E-retail website can significantly engender customers’ perceived attractiveness, emotions and behavioral intention to use target E-retail websites.
1.4 Report Structure
In order to answer research question mentioned above, a serious of experiments were conducted to investigate the role of aesthetic website playing on customers’ first impression, which subsequently impacted customers’ perceived attractiveness, emotions and behavioral intention to use the website. Redefining the aesthetic of websites interface is prerequisite, which contributed to establish an exciting new path on scientifically designing E-retail website. The following chapters are organized, as follows:
Chapter 2 Theoretical Background
Chapter two primarily basic principles of aesthetic interface are introduced for constructing a scientific and quantitative definition of aesthetic websites via two core concepts (color harmony and layout balance). Subsequently, based on previous empirical studies of aesthetic reviews, a basic mechanism of triggering emotion is proposed to capture users’ affective impression, cognitive judgments and behavior, when they faced aesthetic interfaces. Finally, six hypotheses and corresponding research model are proposed.
2.1
Objective Aesthetic of E-retail Website
Aesthetics is an extremely subjective concept, which is difficult to be explained and objectively explored in quantifiable ways. As a result, most of the pervious researches focused on qualitative description and summarizing and did not utilize any quantitative or mathematical modeling approach. For instance, Gilboa and Rafaeli (2003) operationally defined aesthetic as beauty, tidiness, and order. Then, Lavie and Tractinsky (2004) termed “classical aesthetics” and “expressive aesthetics” to classify aesthetics websites. The “classical aesthetics” emphasize orderly, clear and following design rules, which are advocated by numerous usability experts; whereas, the “expressive aesthetics” dimension refers to break design in line with design creativity and originality. Consequently, majority of human-factor design were qualitative, and the effectiveness of many design techniques were left to debate because there were no methods to provide numerical analysis or credible comparison between different design proposals. In this paper, via quantitative mathematical modeling approach, an objectively and scientifically defined aesthetic will be promoted, which relates to the perception of harmony appearance, physical beauty and balance (Locher, Stappers & Overbeeke, 1998).
2.1.1 Balance Ratio of Layout
It is a common knowledge that the spatial relationships of the elements in a space should provide certain degree of balance. Website interface is no more than a kind of two-dimensional space. As any objects retain a sort of balance distribution, the elements of website should balance each other adheres to principles. Generally speaking, there are two kinds of visual balance: symmetrical balance and asymmetrical balance.
Symmetrical Balance
Symmetrical balance (SB) refers to that the compositional elements locate equally basing on certain reference axis, which manifest elements are almost the same in position and proportion, even mirror-reflects each other to some extent. However, several definitions of symmetry exist. Ismail and Kadir (2004) defined that symmetry refers to axial duplication or unit on one side of the centerline is exactly replicated on the other side. For instance, vertical symmetry is balanced arrangement of elements about vertical axis, and of course, horizontal symmetry is about horizontal axis. Radial symmetry consists of equivalent elements balanced interest at central point. However, the Greeks clarify symmetry in different way, in which each element must be related to every other element.
Asymmetrical Balance -- Golden Section principle
Asymmetrical balance achieved through arranging dissimilar elements, such as allocating many elements of smaller weight to balance one large element, which is more versatile, unlike symmetrical balance. Asymmetrical balance is applied much more often on the website design. The well-known Golden Section (GS) principle is a kind of asymmetrical-balanced ratio which was proved can best support many layout designs and ultimately is considered to achieve aesthetically pleasing (Ngo & Ch’ng, 2001) and preferred (Benjafield & McFarlane, 1997).
The GS has a central value of 1.618. According to Fechner (1997) who firstly examined GS in a psychological perspective, individuals have a preference for rectangles (Fig. 1) with ratio of 1:1.618 for their width to height. The GS since has a significant impact on art and architecture in the history because of this core ratio. The artists of Renaissance used GS to design architecture (Fig. 2), sculpture, and their paintings (Fig. 3).
Fig. 3 Facial analyze of Mona Lisa
For example, as for the famous painting ---- the Mona Lisa, GS is perfectly applied to her face, the ratio of the length from head to chin divided by the width of head satisfied GS. Beside this, the ratio of the distance from forehead to eyes divided by the distance from eyes to chin, the ratio of the width of her left face divided by the width of right face all met GS. Furthermore, it is worth mentioning that most of computer monitors content GS too, for example, popular 1280 × 800 sized screen is manufactured approximately approaching to the ratio of 1.618.
Ancient Greek mathematicians first studied what is golden ratio in geometry. The golden section satisfies that the ratio of the sum to the larger equals the ratio of the larger to the smaller. And this specific ratio can be calculated, the value approximate 1.618 (Fig. 4).
Fig. 4 Calculation of Golden Section ratio
[image:12.595.91.468.388.442.2]2.1.2 Color Harmony
In order to create triumphant website, besides balanced management of elements in principle, color harmony is another dominant factor, strongly impacting human emotions and behaviors. Plenty of studies have investigated color effect on human emotions, and how to influence customers’ decision to buy certain products (Ou, Luo, Woodcock & Wright, 2003). Moreover, color not only immediate influence individuals’ emotions, but also “power on” users’ overall satisfaction after operating certain system (Watzman, 2003). For instance, Nakarada-Kordic and Lobb (2005) proved perceived attractiveness had statistically significant effect on search perseverance after comparing six color-variant website-designs.
However, absolutely defining color harmony is always a problem in aesthetics research. In 1975, Judd and Wyszecki proposed that color harmony means two or more juxtaposed colors produce pleasing effect. Afterwards, the keyword ‘pleasing effect’ was widely adopted as the operational definition of color harmony. In general point of view, the alleged ‘pleasing effect’ remains sort of subjective perception.
This study aims to figure out quantitative approach to define color harmony. To define color harmony in quantitative approach, the characteristics of colors need to be analyzed. For example, Morriss and Dunlap (1987) defined color harmony as the suitability of juxtaposed colors, which influence by characteristics of individual colors (i.e., hue, brightness/value, and saturation/chroma), based on the study of Morriss and Dunlap (1987). For the study purpose, it is worth to firstly introduce three basic color concepts: hue, chroma and value.
(1) Harmonious Color Set of Hue difference
Hue refers to a property of colors determined by the dominant wavelength of the visible light. Standard RYB (Red, Yellow, and Blue) color wheel (Fig. 5) is primarily utilized to exhibit hue value of different color in art or art lectures, particularly in painting theory. ‘Red, yellow and blue’ is a set of primary colors in the RYB color model. The three secondary colors (green, orange and purple) are created by mixing two of primary colors. Another six tertiary colors are created by mixing its two neighbor colors (one primary color with another secondary color).
(1.1)Analogous Color Scheme
In line with highest harmonious coefficient, analogous color scheme introduces colors adjacent to each other in the color wheel, like the combination of green-yellow, green and blue-green (Fig. 6). The analogous colors compose adaptive system and can create serene, comfortable and harmonious interface for website. However, audiences feel monotonous, vague and dull to website dominated by analogous color scheme.
Fig. 6 Analogous color scheme
(1.2) Triadic Color Scheme
The second-highest harmonious scheme is triadic color scheme, in which each color evenly located on the color wheel with triangular balance, for instance, triangular location of orange, green and purple on the color wheel (Fig. 7). Triadic colors have variegated appear and characterized by variation on color, they are lively, but own the nature of unified, elegant and harmonious. Therefore, Triadic colors are widely adopted even in pale or unsaturated tone.
Fig. 7 Triadic color scheme
(1.3) Split-complementary Color Scheme
Split-complementary color scheme is a slightly scaled-down compared with triadic color scheme. It locates at third place which is variation on complementary color scheme. Adjacent choices surrounding complementary color make design less harmony than triadic color association,for instance, red-purple, red-orange and green (Fig. 8).
(1.4) Square Color Scheme
Square color scheme locates at the fourth place, which comprise four colors that quartering allocated on the color wheel and also could be viewed as two complementary-pairs, for instance, the set of red, yellow, green and blue (Fig. 9). Using this scheme, website manifest themselves powerfully, lively and exciting to audiences, can better attract users’ attention.
Fig. 9 Square color scheme
(1.5) Rectangle Color Scheme
Rectangle color scheme can be treated as the derivative of square color scheme, providing strong contrast and offering plenty of possibilities to make variation, such as the combination of red, orange, green and blue (Fig. 10). The effect of Rectangle color scheme is so strong, easily causes visual fatigue.
Fig. 10 Rectangle color scheme
(1.6) Complementary Color Scheme
The least-harmonious color scheme of all is complementary color scheme. Complementary color refers to colors locate opposite and mirror each other on the color wheel, for example, pair of red and green (Fig. 11). The effect of complementary color scheme is extremely violent, eye-opening and powerful. If designers cannot handle it properly, it is easily to produce vulgar, instability, disharmony and even bad feelings.
Fig. 11 Complementary color scheme
(2) Chroma
Chroma represents the color purity. Birren(1969) confirmed a linear relationship between Chroma and color purity. Technically, the more other colors were added, the lower scales of Chroma achieved.
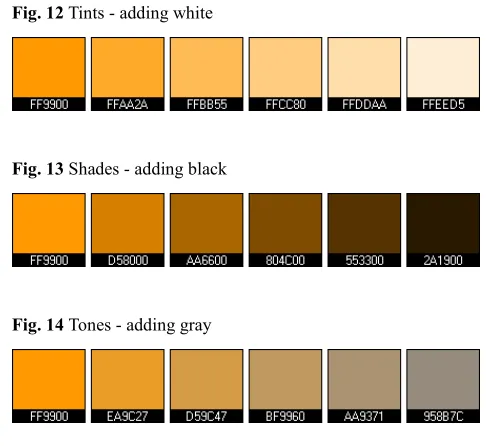
(3) Value
[image:16.595.84.329.261.484.2]The third parameter, value, refers to color’s lightness or darkness (Birren, 1969). Dark colors have low value, while and light colors provide higher value. The method to modify the value of color is simply adding white, black or grey into target. Specially, adding white into pure color can make target lighter, which is termed tint (Fig. 12); adding black get target darker that is termed shade (Fig. 13); and adding gray could achieve different tone (Fig. 14).
Fig. 12 Tints - adding white
Fig. 13 Shades - adding black
Fig. 14 Tones - adding gray
(4) Adjusting Size of Colors
Color size can significantly remodel the visual gravity of frame. Ismail and Kadir (2004) defined balance as the distribution of optical weight in pictures, which means the perception of two or more objects appear same weight. In detail, optical weight relates three variables: color, shape and size of objects. Therefore, the harmonious combination can be achieved via changing size or location of color block. When color has relatively large area and locates in the visual center, its color weight is heavier. Ismail and Kadir (2004) proved that the dark colors, unusual shapes, and large objects are heavier than light colors, regular shapes and small objects. Thus, balance in screen design refers to provide an equal weight of elements.
After above basic introduction of how to achieve color harmony through adjusting hue, chroma, value and area of colors, a scientific approach ---- Munsell’s color balance principle is adduced to define the color harmony mathematically.
(5) Munsell’s Color Balance Principle
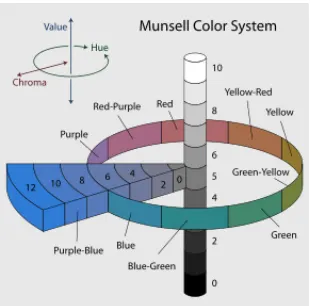
Albert Munsell in 1898 firstly executed a mathematical method to quantify the concept of color harmony ---- this is Munsell’s color model (Birren, 1969). The Munsell’s color model specifies that colors based on three dimensions: Hue, Value and Chroma.
Hue
Munsell identified visible colors with ten milestones on circle (Fig. 15), including five “simple hues” — red, yellow, green, blue, purple; and five “compound hues” — yellow-red, green-yellow, blue-green, purple-blue, red-purple, which were compounded by five “simple Hues”.
Value
Value (or lightness) of color was measured on the central pole which originates from gray with neutral value of zero-hue. In his model (Fig. 15), pure black located at the basal end with value of zero, and pure white flied at the peak end with value of ten. Take “red” as an example, the value scales of "maroon" was located lower because it is darker, whereas the value scale of "pink" was located higher so it is lighter.
Chroma
Chroma referred to color’s strength or weakness that measured on the horizontal paths (shown in Fig. 15) counting from the neutral pole to the equator. Weak colors had low Chroma, while strong colors had high Chroma. For instance, red and blue-green opposite located on color circle, blue-green occupied middle value, red was twice as strong as blue-green.
[image:17.595.354.509.307.460.2]In order to achieving color harmony, colors should be adjusted on their chroma, value and the size. Because no matter combines what hues of colors are, color harmony can be achieved through
adjusting the characteristics of colors, thus, hue of color does not be taken into account in Munsell's color harmony formula (Birren, 1969). In detail, to achieve possible balanced on two color blocks, color occupying large area should use relative weaker color (the score of chroma × value is small), instead of strong color application in Munsell’s theory. To produce a balanced or harmonious color design, the value of Chroma1 × Value1 × Area (size) 1 should be equal to the value of Chroma2 × Value2 × Area (size)2 (Fig. 16).
Chroma1 × Value1 × Area (size)1 = Chroma2 × Value2 × Area (size)2 Fig. 16 Munsell’s color harmony formula
2.2 Effects of Aesthetic
Basing on previous researches of aesthetics, the possible causal effect of aesthetic interface could be roughly divided into five categories.
2.2.1 Aesthetics and Usability
In the research field of HCI, usability always emphasized its prominence. Abundant researches devoted into investigating the effect of aesthetic on objective aspects of usability and exploring that aesthetic or perceived aesthetic take effect on perceived usability.
When performance of websites is involved, efficiency, effectiveness and reliability are regularly examined as objective factors, specifically, in order to test how quickly, accurately and consistently users search functional needs from a website, the concept of “ease of use” is widely concerned in HCI researches (Van der Heijden, 2003). A recent study of Cawthon and Moere (2007) explored the relationship between perceived aesthetics and usability, three independent variables (color, typography and layout balance) and four outcomes (the speed of completing tasks, accuracy rate, task abandonment, and latency of erroneous response), reflecting the efficiency and effectiveness of target website, were tested in this experiment. The findings showed that only “latency in task abandonment” and “erroneous response time” relevant to users’ perceived aesthetic, others are not significant.
However, the visual appeal of interface not only plays a role in usability, but also in perceived usability, which is validated by plentiful empirical studies. When system with high quality of aesthetic, users will perceive the usability is high. For instance, Kurosu and Kashimara (1995) investigated the relationship between users’ perceived attractiveness and perceived usability via evaluating aesthetically appealing of ATM (automated teller machine). The results indicated that users’ perceived usability is strongly affected by visual appeal rather than inherent usability. Similarly, Tractinsky, Katz and Ikar (2000) confirmed that the ATM with high aesthetic interface was perceived more usable, in condition that all ATM are in the same level of functionality.
In 2008, Ilmberger, Schrepp and Held accomplished an empirical study to explore the cognitive processes underlying the high correlations between aesthetic impression and perceived usability of a user interface. Four online shops were tested varying color schemes and usability levels. These four interfaces were tested twice before and after an interaction period. By comparing these two mean scores of mood (before and after exploring interface), the results indicated that the users’ mood can initially be influenced by aesthetic qualities. A high aesthetic interface can decrease bad experienced usability, and a good aesthetic impression can amplify the experience of good usability.
2.2.2 Aesthetics and Overall Satisfaction
2.2.3 Aesthetics and Perceived Information Quality
Amount of the experiments evidenced how the aesthetic influence users’ perceived information quality of website, and indicated aesthetic quality of website design is radically important, must be taken into account by interfaces designers. For instance, McKnight, Chounhury and Kacmar (2002) found that consumers’ perception of website quality was a strong predictor of trusting beliefs in the retailer and of consumers’ intention to buy from certain website. Lavie and Tractinsky (2004) guided an online survey of 125 engineering students to explore users’ perceptions of aesthetic quality on websites. The results revealed that the interface with higher level of aesthetic can positively influence users’ perceived information quality of target website.
Similarly, a recent study of Robins and Holmes (2008) explored the extent on people make credibility judgment when they first view target website. Using self-report technology, 20 graduate students judged credibility of 42 websites at first glance. Robins and Holmes compared the credibility judgments of higher-aesthetic websites with the lower aesthetic websites. Results manifested websites with high quality of aesthetic website had positive effect on users’ credibility judgment.
2.2.4 Aesthetics and Time Stay On Websites
In previous studies of HCI, it is widely mentioned that website with higher aesthetical interface could make users spend more time on the website. However, no empirical studies directly measured this issue. The researchers of HCI could use homepages as stimuli to determine whether viewers willing to spend time exploring a site in the future.
2.2.5 Aesthetics and Likeliness of Revisiting the Website
2.3 Explanation of Aesthetic Interface Trigger Users’ Emotion
Although ubiquity and popularity of Internet applications has generated a large body of researches in HCI regarding the importance of website visual aesthetics, paucity of research on exploring the effectiveness of website interface features on the cognitive process. In general, two explanations exist in the context of E-retail website (Tractinsky & Lowengart, 2007), which could be explained how phenomenon of aesthetics may affect users’ decision making in particular. Firstly, many researchers believe halo effect exists as a cognitive bias whereby the perception of a particular trait is influenced by the perception of the former traits in a sequence of interpretations. In E-retail website, the halo effect carries over first impressions of products or shopping environments to consumer evaluations of other attributes of these products or environments. However, due to the characteristics and causes of halo effect is more complicated; there little research to quantify the impact of halo effect.
2.4 Research Hypothesizes
Based on the assumption of the traditional Stimulus-Organism-Response (S-O-R) paradigm which could be applied in a Web environment (Eroglu, Machleit & Davis, 2001), the aesthetical interface (layout balance and color harmony) could act as stimuli affecting cognitive and emotional states during online shopping episode. In SOR, “stimuli” refers to the atmospheric cues were operationalized, such as website interface; “organism” means users’ emotional reactions; and “response” represents users’ approach or avoidance behaviors after stimuli exposed. The empirical evidences supported that the relationship between pleasure (whether individuals perceive the environment as being enjoyable or not) and several approach behaviors, such as staying longer in the store, impulse purchase and affiliation with the store’s personnel (Turley & Milliman, 2000; Yalch & Spangeberg, 2000).
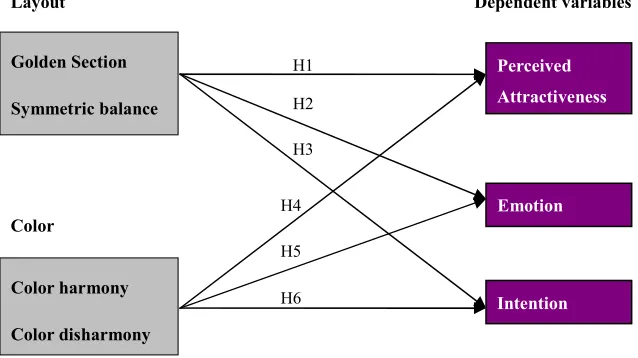
Based on psychology theories and empirical evidences revealed in HCI, six relevant hypotheses and corresponding research model (Fig. 17) are proposed, as follows:
Hypothese1: The presence of golden section layout has a more positively influence on perceived attractiveness than the presence of symmetrical balance layout.
Hypothese2: The presence of color harmony has a more positively influence on perceived attractiveness than the presence of color disharmony.
Hypothese3: The presence of golden section layout has a more positively influence on users’ emotion than the presence of symmetrical balance layout.
Hypothese4: The presence of color harmony has a more positively influence on users’ emotion than the presence of color disharmony.
Hypothese5: The presence of golden section layout has a more positively influence on users’ behavioral intention to use the website than the presence of symmetrical balance layout.
[image:23.595.90.409.538.717.2]Hypothese6: The presence of color harmony has a more positively influence on users’ users’ behavioral intention to use the website than the presence of color disharmony.
Fig. 17 Research model
Chapter 3 Research Methodology
3.1 Research Design
The purpose of this experiment is to prove attractive E-retail website can trigger Chinese E-consumers’ good first impression, emotions and subsequent behavioral intention to use target website. According to above argumentation, two essential concepts would be discussed as research variables: one is color harmony versus disharmony based on Munsell’s color harmony formula; another is layout balance based on GS theory against symmetrical balance.
Brady and Phillips (2003) introduced a valuable reference for this study. They investigated the role of aesthetics plays in website usability. In their study, the original website and three variations, modified on color, balance, or combination of above two, were employed to test the impact of color and balance on user satisfaction, aesthetic appeal and perceived usability. However, they ignored the aesthetic can be influenced by numbers of factors; any discord may lead to the failure of design. In their experiments, the sample interface was not expert in aspect of aesthetics. Researchers only create a concept website interface far away from real life. As for the Homepage of E-retail website, abundant product images also play a central role and should be taken into account. Researchers cannot simply ignore these factors and execute experiment on an optional sample interface. This study will explore the viability of Brady and Phillips’s framework in the field of investigating on users’ perceived attractiveness, emotions and willingness for website interface, through modifying an existing E-retail experimental website layout was created.
The current experiment conducted a 2(layout balance: Golden Section layout vs. symmetrical balance layout) × 2(color balance: color harmony vs. color disharmony) array-structure design to analyze two independent variables, layout balance and color harmony which influence three dependent variables: emotional factors of customers’ perceived attractiveness, emotions, and behavioral intention to use the target website.
Independent variables: layout balance (Golden Section layout vs. symmetrical balance layout) color balance (color harmony vs. color disharmony)
3.2 Operationalization of Independent Variables
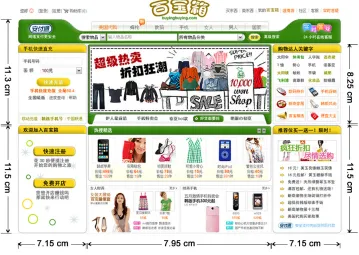
[image:25.595.142.456.141.348.2]The current study selected a popular Chinese E-retail website ---- “Eachnet” (www.eachnet.com ) as template for this experiment (Fig. 18).
Fig. 18 Original Eachnet website (homepage)
The original ‘Eachnet’ web page is redesigned, as follows:
Firstly, parallel identity of the sample-interface is created, in order to avoid the brand dispute with ‘Eachnet’. Secondly, several icons of digital products and popular dresses are added, in order to avoid the deviation of individual preferences. Finally, frames of homepage are modified on layout and color aspects for research purpose (Fig. 19).
[image:25.595.144.452.480.705.2]3.2.1 Layout balance
For research purpose, the layout of original ‘Eachnet’ web homepage was changed into Golden Section layout (GSL) and Symmetrical Balance layout (SBL). The reason why author applied the symmetrical balance to play the role against the golden section layout rather than a random proportion layout is that symmetrical balance layout is proved as perfectly appropriate for user interface (Mullet & Sano, 1995). In website design, GSL and SBL which are optical balance layouts are widely used. By comparing GSL and SBL, the value of GSL could be powerfully confirmed.
Golden Section Layout
To be in line with Golden Section principle, which means the overall layout ration of two parties should approximately approach 1:1.618, the website is reformed as: two blocks lead by yellow bars on the right side of the webpage is in the scale of 8.6cm/13.1cm, which is equal to 0.66, approximate to 1:1.618. Meanwhile, two green blocks on the left side identified by a 0.5cm gap, almost have a ratio of 1:1.618 too. Finally, consider of the entire left party against the entire right side, obviously, the overall ration of these two color blocks, green and yellow, is closed to 1:1.618 as well. To sum up, the layout factor of the condition one closely adheres to the principles of Golden Section principle. (Fig. 20 & 22)
Symmetrical Balance Layout
3.2.2 Color harmony
As regards the color harmony aspect, basing on Munselll’s color harmony formula, if two color blocks requires to performance in balance, they should be equal on the products of Chroma×Value×Area.
Color harmony
In order to create the most harmony scheme in experiment, yellow and yellow-green were selected basing on Analogous color scheme. This was proved by the study of Polzella and Montgomery (1993) which certificated the combination of green and yellow was judged as one of the best harmonious combination. The current green (Hue1 = 100, Chroma1 = 90%, Value1 = 53%, Area1 ≈
0.0088㎡) has product of 41.976; while the current yellow (Hue2 = 50, Chroma2 = 90%, Value2 =
99%, Area2 ≈ 0.0047㎡) possesses product of 41.877. It is obvious that the current combination of
green and yellow approach the perfectly balance ratio situation.
Color disharmony
Basing on the study of Wright, Mosser-Wooley and Wooley (1997), in which the results of study indicated the combination of cyan and yellow is the worst combination on white background, we purposely arrange the cyan-yellow combination to make sample unharmonious, which can be demonstrated by Munselll’s formula too, the current cyan (Hue1 = 180, Chroma1 = 96%, Value1 = 98%, Area1 ≈ 0.0088㎡, with product of 82.79) and the current yellow (Hue2 = 60, Chroma2 = 95%, Value2 = 72%, Area2 ≈ 0.0047㎡, with product of 32.148) are totally unequal.
The following 2 × 2 array-structure union was used, in terms of the discussion in 3.2.1 and 3.2.2, Condition 1: Color harmony with Golden Section layout version (Fig 20);
Fig. 20 Condition 1: Color harmony with Golden Section layout version
[image:28.595.127.486.418.673.2]Fig. 22 Condition 3: Color disharmony with Golden Section layout version
[image:29.595.124.475.389.645.2]3.3 Operationalization of Dependent Variables
3.3.1 Perceived Attractiveness
In order to investigate users’ perceived attractiveness of the interface on the graphic design perspective, seven questions are asked on a 9-point scale (from “1” negative to “9” positive) based on previous studies (Lindgaard, Fernandes, Dudek & Brown, 2006; Vilnai-Yavetz & Rafaeli, 2006).
‘Base on the website you observed, answer the following questions: I judge this web page to be’
Negative --- Positive
Complex 1 2 3 4 5 6 7 8 9 Simple
Boring 1 2 3 4 5 6 7 8 9 Interesting
Confusing 1 2 3 4 5 6 7 8 9 Clear
Bad layout 1 2 3 4 5 6 7 8 9 Good layout
Bad use of color 1 2 3 4 5 6 7 8 9 Good use of color
Ugly 1 2 3 4 5 6 7 8 9 Beautiful
3.3.2 Users’ emotion
The second dependent variable is users’ emotion. To test user’s first impression or feeling once the participants face website variant, Layered Emotion Measurement Tool (LEM tool) is adopted to evaluate emotional experience, LEM tool constructed on Pleasure-Arousal-Dominance (PAD)
Emotional State model, which measures emotion on three dimensions of valence, arousal and dominance, which is developed by Mehrabian and Russell in 1974.
Recently, Capota, van Hout and van der Greest (2007) utilized the LEM tool to measure emotion during interaction on websites. By registering user experience emotions in combination with gathering specific data, they explained the way that user interacted with website; such as how they move the mouse and click. However, making participants relate word-describing of emotion is difficult. In this study, more direct approach was adopted, in which four feeling description were represented as images instead of texts, because participants’ “feeling” is an instant experience (Beedie, Terry & Lane, 2005) within few seconds, the image can reflect what they truly felt inside more efficiently than the texts in such few seconds. Thus, the graphic questions in terms of LEMtool was ranging from 1 to 9 with the following equivalences, “1” is the most negative emotion, “9” is the most positive emotion and “5” means natural, as follows:
‘Please answer the following four questions with emotional scales you felt on the website.’ 1 --- 9
1 2 3 4 5 6 7 8 9
1 2 3 4 5 6 7 8 9
1 2 3 4 5 6 7 8 9
1 2 3 4 5 6 7 8 9
3.3.3 Users’ behavioral intention to use
To test what extent users would consume in target website, a 9-point Likert scales (1= absolutely not, 9= definitely will) is used, as follows:
3.4 Participants
3.4.1 Participants recruiting
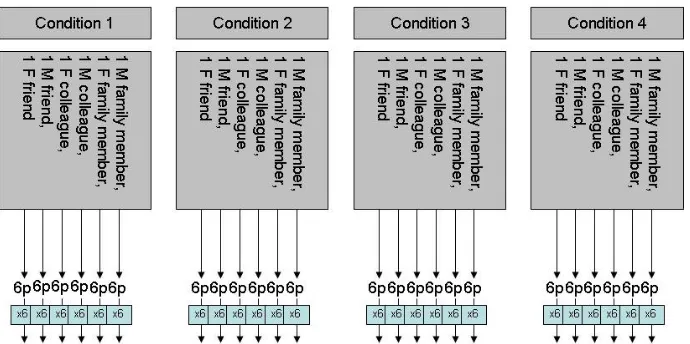
Current study targeted at Chinese E-consumers, a target group with huge contrast on region, age, and education background. It is difficult that recruiting hundreds of Chinese in different city. In view of these facts, the respondent-driven sampling technique was appointed, which is a variation of chain-referral sampling methods accomplishing asymptotically unbiased estimates. Based on the study of Matthew, Salganik and Heckathorn (2004), the sampling procedure (Fig. 24) was framed as follow.
[image:32.595.127.472.382.554.2]At the first stage, 24 participants were chosen in author’s social network, purposely and impartially assigned into the four conditions mentioned in Chapter two; meanwhile, e-mails including the experiment details will reach them before experiment. In the second stage, these 24 participants forwarded these E-mails to two of their family members, two colleagues, and two friends (one male and one female in each pair) to invite them join into the study. Afterwards all involving participants on the second stage continuously extend the sample size (two family members, two colleagues, and two friends) of this experiment to make the samples size as large as rolling snowball.
3.4.2 Personal characteristic of Chinese participants
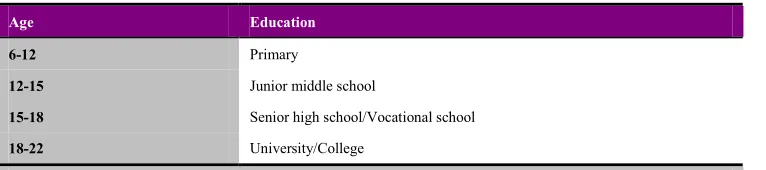
China clearly distinguished itself from other countries, as Internet is a latecomer to the China market. In September of 1987, CANET (Chinese Academic Network) in Beijing Institute of Computer Application Technology established China first Internet E-mail node, and on 14th of September issued China's first e-mail: "Across the Great Wall we can reach every corner in the world”, which formed a prelude to Chinese use the Internet. Afterwards, this latecomer cause a unique Internet phenomenon in China, official survey shows that the age of China Internet users is unbalanced, most of the users are youth between 18 to 24 years old; in the current 162 million Internet users, social freshmen under 25-year old occupy half (51.2%), users below 30-year old even reached tremendously percentage of 70.6%. The majority of the elderly, whose learn prime-time is before the Reform and Opening-up policy in 1979, have lost their desire and ability to accept Internet. Therefore, the unique phenomenon in China, age factor will be investigated during the experiments in this paper. In addition to the exceptive impact of age, there is a great difference in the structure and hierarchy of China education system. Table 1 showed the age and education stages for Chinese education system.
Table 1
China education system
Age Education
6-12 Primary
12-15 Junior middle school
15-18 Senior high school/Vocational school
18-22 University/College
( http://en.wikipedia.org/wiki/Education_in_the_People's_Republic_of_China )
[image:33.595.91.474.367.452.2]3.4.3 Demographic of participants
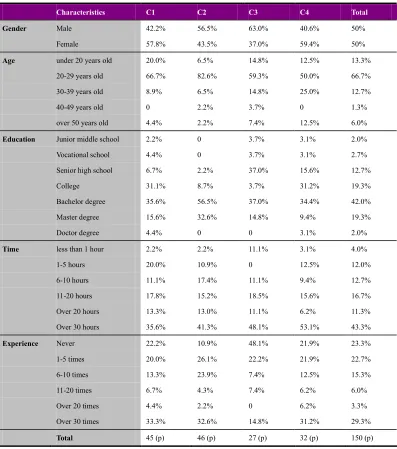
The last count showed that 150 participants (75 male, 75 female) attended online investigation, who were obtained via respondent-driven sampling technique. Table 2 specified the demographic characteristics of participants. Most of them (80%) are younger than 30 years old, and 82.6% participants have higher education experience (college, bachelor, master or doctor). 49.4% participants spend over thirty hours online per week. Approaching one third (30%) of the participants have more than thirty times experience of online shopping.
Table 2
Demographic of respondents
Characteristics C1 C2 C3 C4 Total
Gender Male 42.2% 56.5% 63.0% 40.6% 50%
Female 57.8% 43.5% 37.0% 59.4% 50%
Age under 20 years old 20.0% 6.5% 14.8% 12.5% 13.3%
20-29 years old 66.7% 82.6% 59.3% 50.0% 66.7%
30-39 years old 8.9% 6.5% 14.8% 25.0% 12.7%
40-49 years old 0 2.2% 3.7% 0 1.3%
over 50 years old 4.4% 2.2% 7.4% 12.5% 6.0%
Education Junior middle school 2.2% 0 3.7% 3.1% 2.0%
Vocational school 4.4% 0 3.7% 3.1% 2.7%
Senior high school 6.7% 2.2% 37.0% 15.6% 12.7%
College 31.1% 8.7% 3.7% 31.2% 19.3%
Bachelor degree 35.6% 56.5% 37.0% 34.4% 42.0%
Master degree 15.6% 32.6% 14.8% 9.4% 19.3%
Doctor degree 4.4% 0 0 3.1% 2.0%
Time less than 1 hour 2.2% 2.2% 11.1% 3.1% 4.0%
1-5 hours 20.0% 10.9% 0 12.5% 12.0%
6-10 hours 11.1% 17.4% 11.1% 9.4% 12.7%
11-20 hours 17.8% 15.2% 18.5% 15.6% 16.7%
Over 20 hours 13.3% 13.0% 11.1% 6.2% 11.3%
Over 30 hours 35.6% 41.3% 48.1% 53.1% 43.3%
Experience Never 22.2% 10.9% 48.1% 21.9% 23.3%
1-5 times 20.0% 26.1% 22.2% 21.9% 22.7%
6-10 times 13.3% 23.9% 7.4% 12.5% 15.3%
11-20 times 6.7% 4.3% 7.4% 6.2% 6.0%
Over 20 times 4.4% 2.2% 0 6.2% 3.3%
Over 30 times 33.3% 32.6% 14.8% 31.2% 29.3%
[image:34.595.93.490.241.690.2]3.5 Procedures
Before participants started the online survey, all participants received e-mails presenting the survey instructions, and including only one link of four conditions. From now, the sample snowball started its rolling. Once the participants entered the testing website, a general introduction would be presented with the following introduction: “Welcome to E-retail homepage survey. The survey is estimated to take about 10 minutes and you can quit at anytime if the survey is inconvenient or makes you uncomfortable. Please remember that the focus of this study is the homepage — not you, so I hope you can be objective, impartial and provide your valuable advice. (In order to ensure the impartiality of the experimental data, please do not repeat this test.)”. Then a group of demographic questions (about gender, age, education, time online per week and online shopping experience) would be exhibited to gather references data of participate.
Next to the online survey stage, all participants provided response to twelve questions. Then, four emotional questions would be answered about the first impression once the participants facing experiment variant. Followed by four graphical questions, all participants should make choices on what percentage they possibly consume on target website. Then, in the last seven questions, all participants should evaluate website interface on the graphic design perspective, which indicated the users’ perceived attractiveness (Lindgaard, Fernandes, Dudek & Brown, 2006).
Chapter 4
Data Analysis and Results
Analysis of the collected data is conducted using SPSS. The following paragraphs present the data analysis and casual results including two-sample T-Test, correlation, linear regression and Two-way ANOVA.
4.1 Description Statistics
[image:36.595.88.487.323.419.2]Table 4 reveals the Means (M) and Standard Deviations (SD) of four versions of aesthetic-variant stimulus. In Table 3, Condition 1 has the remarkable highest Mean scores on three dependent variables among all conditions, while Condition 4 has the second highest Mean scores.
Table 3
Means (M) and Standard Deviations (SD) on dependent variables
Condition (Number) PA Emotion Intention to use
M (SD) M (SD) M (SD)
Condition 1 (45) 39.07 (10.17) 23.00 (6.21) 5.24 (1.20)
Condition 2 (46) 33.20 (11.54) 20.09 (5.82) 4.63 (2.15)
Condition 3 (27) 35.26 (10.23) 20.93(6.58) 4.78 (2.39)
Condition 4 (32) 37.72 (6.53) 21.16 (6.31) 5.03 (2.16)
4.2 The effectiveness of independent variables on dependent variables
To investigate the effectiveness of layout balance and color harmony on users’ perceive attractiveness, emotion and behavioral intention to use the website, a series of two sample T-tests are conducted. According to the data in Table 4 and 5, only the Mean scores of website with GS on users’ emotion (M = 22.22, SD = 6.38) is statistically significantly (t = 1.68, df = 148, p = 0.024, p < 0.05) higher than website with SBL (M = 20.53, SD = 6.01). Thus, H3 is supported.
H1 and H5 are not supported. In respect that the Mean scores of website with GSL on users’ perceived attractiveness (M = 37.64, SD = 10.29) is insignificantly (t = 1.54, df = 147, p = 0.063 > 0.05) higher than website with SBL (M = 35.08, SD = 9.97). Additionally, GS does not have significant impact on behavioral intention to use target website (t = 0.78, df = 148, p = 0.218 > 0.05).
Table 4
Means and Standard Deviations of independent variables on dependent variables
Variable PA Emotion Behavioral Intention
M (SD) M (SD) M (SD)
C1+3 37.64 (10.29) 22.22 (6.38) 5.07 (2.14)
Layout
C2+4 35.08 (9.97) 20.53 (6.01) 4.79 (2.15)
C1+2 36.13 (11.21) 21.53 (6.16) 4.93 (2.09)
Color
[image:37.595.89.491.249.316.2]C3+4 36.59 (8.44) 21.05 (6.37) 4.92 (2.25)
Table 5
Two sample T-tests on dependent variables
Variable PA Emotion Behavioral Intention
F t P F t P F t P
Layout (C1+3 vs. C2+4) 0.23 1.54 0.063 0.64 1.68 0.048 0.13 0.79 0.218
Color (C1+2 vs. C3+4) 3.11 - 0.27 0.394 0.01 0.46 0.325 1.27 0.05 0.479
Basing on the output a series of ANOVA test, layout and color have interactive effect on users’ perceived attractiveness (F = 6.17, p = 0.014 < 0.05, R2 = 614.96), but they have no effect on users’ emotion (F = 2.31, p = 0.131 > 0.05, R2 = 88.03) and behavior intention (F = 1.45, p = 0.231 > 0.05, R2 = 6.70).
4.3 Correlation between Dependent Variables
The internal-correlation of three dependent variables, a series of Pearson Correlations is conducted. The data of Table 6 indicates that all independent variables have statistically significant correlation between each other and the correlations were all smaller than 0.8 (Emory & Cooper, 1991).
Table 6
Pearson Correlation and linear regression (N = 149)
Independent variable Dependent variable Correlation β R² p
Users’ perceived attractiveness Users’ emotion .692** 0.42 0.48 .00
Users’ perceived attractiveness Users’ behavioral intention .616** 2.94 0.38 .00
Users’ emotion Users’ behavioral intention .640** 0.22 0.41 .00
**. Correlation is significant at the 0.01 level (2-tailed).
[image:37.595.92.488.550.618.2]4.4 The influence of personal characteristics
To deeply testify whether five interactive effects (gander, age, education, online time per week, and experience of online shopping) influence the links between dependent variables (layout balance and color harmony) on three dependent variables, a series of analysis of variance are conducted.
4.4.1 Users’ perceived attractiveness
[image:38.595.90.455.337.599.2]Table 7 reveals the output of a series of ANOVA tests of five interactive effects influencing linking between layout balance and three dependent variables. The factors of online time per week has statically significant interactive effect with the effect of layout balance on users’ perceived attractiveness (F = 6.23, Mean2 = 543.59, p = 0.000 < 0.05), users’ emotion (F = 7.96, Mean2 = 248.46, p = 0.000 < 0.05) and behavioral intention (F = 6.21, Mean2 = 24.82, p = 0.00 < 0.05).
Table 7
ANOVA output for layout balance and dependent variables
Dependent variables Source df Mean Square F Sig.
layout * Gender 1 184.790 1.824 .179
layout * Age 4 109.702 1.122 .349
layout * Education 6 20.527 .211 .973
layout * Time 5 543.592 6.234 .000
Attractiveness
layout * Experience 5 49.656 .465 .801
layout * Gender 1 6.171 .163 .687
layout * Age 4 162.388 4.792 .001
layout * Education 6 62.080 1.696 .126
layout * Time 5 248.455 7.962 .000
Emotion
layout * Experience 5 57.537 1.521 .187
layout * Gender 1 .012 .003 .959
layout * Age 4 9.112 2.055 .090
layout * Education 6 6.930 1.609 .149
layout * Time 5 24.821 6.209 .000
Intention
layout * Experience 5 5.411 1.160 .332
The output of ANOVA test (Table 8) indicates that the factor of age has a statically significant interactive effect with the effect of layout balance on users’ emotion (F = 4.79, Mean2 = 162.39, p = 0.001 < 0.05).
Results of Table 8 indicate that although the average ranks of old group is larger than young group on users’ perceived attractiveness (MR old = 104.09 > MR young = 72.68), emotion (MR old = 94.91 > MR young = 73.96) and behavior intention (MR old = 79.14 > MR young = 75.21). The results of Table 9 suggest that there is a statistically significant difference between the underlying distributions of the perceived attractiveness scores of young group and the perceived attractiveness scores of old group (z = -2.33, p = 0.02 < 0.05), other two are insignificant.
Table 8
Nonparametric test output (1) for age (layout as independent variable on dependent variables) N Mean Rank Sum of Ranks
Young Old Young Old Young Old
Attractiveness 138 11 72.68 104.09 10030.00 1145.00
Emotion 139 11 73.96 94.91 10281.00 1044.00
Intention 139 11 75.21 79.14 10454.50 870.50
Table 9
Nonparametric test output (2)
PA Emotion Behavioral Intention
Mann-Whitney U 439.00 551.00 724.50
Wilcoxon W 10030.00 10281.00 10454.50
Z -2.33 -1.56 -.30
Asymp. Sig. (2-tailed) .020 .12 .77
[image:39.595.88.490.345.435.2]4.4.2 The Influence of Education on Users’ Behavioral Intention
[image:40.595.90.455.211.477.2]In order to explore the interactive effects between five personal factors and color harmony as regards three dependent variables, the same ANOVA tests are performed. The output of Table 10 indicates that the factor of education has a statically significant interactive effect with the effect of color harmony on users’ behavioral intention (F = 2.16, Mean2 = 9.06, p = 0.05).
Table 10
ANOVA output for color harmony and dependent variables
Dependent variables Source df Mean Square F Sig.
color * Gender 1 228.667 2.228 .138
color * Age 4 72.639 .727 .575
color * Education 6 192.123 2.157 .051
color * Time 5 78.746 .749 .588
Attractiveness
color * Experience 5 81.424 .759 .581
color * Gender 1 .001 .000 .997
color * Age 4 2.269 .058 .994
color * Education 6 49.762 1.330 .248
color * Time 5 21.529 .537 .748
Emotion
color * Experience 5 8.096 .199 .963
color * Gender 1 2.366 .514 .475
color * Age 4 10.324 2.341 .058
color * Education 6 9.056 2.162 .050
color * Time 5 10.198 2.242 .054
Intention
color * Experience 5 3.559 .746 .590
Table 11
Mean scores, standard deviations, number and Two-sample T-Test (university group vs. non-university group on dependent variables)
Non-university University
M (SD), N M (SD), N t df Sig.
Attractiveness 42.96 (11.26), 26 34.91 (9.39), 123 3.83 147 .000
Emotion 21.96 (8.63), 26 21.21 (5.64), 124 .56 148 .289
Intention 5.85 (2.75), 26 4.73 (1.96), 124 2.44 148 .008
For the purpose of understanding why non-university group has higher Mean scores on three dependent variables than university group, demographic analysis of non-university group and the university group is performed (Table 12). Most of non-university participants are under 20 years old (38.5%) and over 50 years old (26.9%), while participants in university group are almost around 20-29 years old (76.6%). University group spent more time online and have more online shopping experience than no-university group. Instead of attractive appearance of Web interface, the university group more directly focuses on the images of products, which may provide the reason why the Mean scores on three dependent variables for university group are lower than non-university group.
Table 12
Demographic of non-university group vs. university group
Characteristics Non-university University
Gender Male 38.5% 52.4%
Female 61.5% 47.6%
Age under 20 years old
38.5% 8.1%
20-29 years old
19.2% 76.6%
30-39 years old
11.5% 12.9%
40-49 years old
3.8% .8%
over 50 years old
26.9% 1.6%
Time less than 1 hour
15.4% 1.6%
1-5 hours
23.1% 9.7%
6-10 hours
3.8% 14.5%
11-20 hours
34.6% 12.9%
Over 20 hours
11.5% 11.3%
Over 30 hours
11.5% 50.0%
Experience Never
69.2% 13.7%
1-5 times
23.1% 22.6%
6-10 times
7.7% 16.9%
11-20 times 0
7.3%
Over 20 times 0
4.0%
Over 30 times 0
[image:41.595.92.471.403.732.2]Chapter 5 Discussion and Recommendations
5.1 Findings
This study explored the effectiveness of harmony website interface on users’ first impression and users’ subsequent behavior. For this purpose, an empirical experiment is conducted by using a scientific and quantitative approach to redefine the aesthetic of websites interface, in which two variations of aesthetical interface – layout balance (GSL vs. SBL) and color harmony (color harmony vs. color disharmony) are used to investigate individual effects on three dependent variables, customers’ perceived attractiveness, emotions and behavioral intention to use the website. The results of this study demonstrate that only layout balance variable has statically significant influence on users’ emotion, and there is a huge gap between aesthetic and users’ perceived attractiveness. Common users are not the expert on aesthetic, cannot distinguish GS layout with symmetrical layout on the aspect of attractiveness, but they have significant emotional bias upon these two layouts. As for behavioral intention, negative influence appeared in the experiment either. While the results show that the factor of color harmony does not have any effect on three dependent variables.
It is very interest that the findings of this study are contrary to the historical Chinese aesthetic. Participants reflected higher scores of perceived attractiveness and more positive emotion on website interface with GS instead of website interface with SBL.
However, symmetrical composition has dominated ancient China architectural design, layout design, and pattern design for centuries. Its proper and dignity give Chinese a sense of permanence in a long age of change (Fig. 25). As for Chinese, fully aesthetic recognition of symmetric significantly reflected in the design of its national emblem (Fig. 26). Besides, one important element in the emblem design, the Tiananmen Square is also constructed basing on symmetrical design (Fig. 27).
Times have changed and so does the way esthetic presents itself to us, the Chinese contemporary design are no longer rigidly adhere to the absolute symmetry, the emergence of asymmetrical balance layout is rising up recently. In modern design, it is very hard to find absolute symmetry, which is replaced by asymmetrical balance (Fig. 28).
Based on the exploring of five interactive effects (gander, age, education, online time per week, and experience of online shopping) with layout balance on dependent variables, the results reveal that the factor of time spent online has significant interactive effect on three dependent variables, which means users who had more experience online, are more possible use websites toward balance layout interface. And the factor of age has significant interactive effect on users’ emotion. The Mean ranks of old group are larger than young group on three dependent variables. The outputs of a series of two-sample T-Tests indicate that only the Mean rank of perceived attractiveness has a statistical significant difference between two groups.
Furthermore, the results of this study inconsistent with previous studies (Brady & Phillips, 2003). The effectiveness of color harmony does not have significant influence on dependent variables. Users seemed refuse to pay attention on designer-perceived color harmony website, which could spring from that the sample website is an E-retail website, full of colorful products broadcasting images. Therefore, as regards the website design in the future, designer should lay main emphasis on layout structure rather than selective colors against the background of colorful image as the dominant factor
[image:43.595.90.508.131.229.2]However, several interactive effects might cause bias.First, according to the analysis of interactive effect, the factor of time spends online significantly interactively impact the links between layout balance and three dependent variables. Second, the factor of age significantly interactively impacts the relationship between the effect of layout balance and users’ emotion. All participants were divided into two groups (young group: below 40-year old; old group: above 40-year old) based on the age of the first generation of Chinese computer learners. Results indicate that although the average ranks of old group is larger than young group on three dependent variables. Third, the factor of education significantly interactive influences the relationship between color harmony and users’ behavioral intention. By re-categorizing all participants into university group and non-university group, non-university group had high Mean scores of three dependent variables than university group. The outputs of a series of two-sample T-Tests indicate that only the Mean scores of perceived attractiveness and behavioral intention have statistical significant difference between non-university group and university group.
5.2 Limitations
There are several limitations in current study. First, because the respondent-driven sampling technique is executed in experiment, participants cannot be fully controlled. Part of participants might share one computer, which means they might talk and influence each other, that might bias results of this study. Second, majority of factors possibly effects on users’ emotion in real life shopping experience. But, a pre-text of users’ emotions is missed in this study. Thus, the results could not confirm the prediction that the effectiveness of aesthetic interface has positively influence on users’ emotion. Third, only 11 participants are older than 40 years old in current experiment, a Non-parametric test has to be conducted for comparing young group and old group. Finally, contrast to the population of China, the sample size of this study nevertheless is limited, which may make generalization difficult.
5.3 Contributions
Despite these limitations, the study has several contributions to website designers and researchers interesting with this issue.
For practiced design
In summary, two suggestions are offered to practical website designers. First, users prefer website interface with GSL than with SBL. Thus, we suggest website designer apply Golden Section layout for homepage design. Second, if E-retail Website includes lots of colorful product images, then designers should concentrate on the structure of website rather than the color scheme of interface frame.
For further research
Finally, there are two suggestions for researches who are interested with this issue in the future. First of all, due to a pre-test of emotion did not be conducted before exposed stimuli, the correlation between users’ emotion and use intention cannot be proved in this study. The further research could follow this direction and replicate this experiment.
References
Beedie, C., Terry, D., & Lane, A. (2005). Distinctions between emotion and mood. Cognition &
Emotion, 19(6), 847-878.
Ben-Bassat, T., Meyer, J., & Tractinsky, N. (2006). Economic and subjective measures of the perceived value of aesthetics and usability. ACM Transactions on Computer-Human
Interaction, 13(2), 210-234.
Benjafield, J., & McFarlane, K. (1997). Preference for proportions as a function of context.
Empirical Studies of the Arts, 15, 143-151.
Birren, F. (1969). MUNSELL: A Grammar of Color: Van Nostrand-Reinhold.
Bloch, P. (1995). Seeking the ideal form: Product design and consumer response. J. Market, 59, 16-29.
Brady, L., & Phillips, C. (2003). Aesthetics and Usability: A Look at Color and Balance. Usability
News, 5 (1), 1-4.
Capota, K., van Hout, M., & van der Greest, T. (2007). Measuring the emotional impact of websites: a study on combining a dimensional and discrete emotion approach in measuring visual appeal of university websites. Designing Pleasurable Products and Interfaces. Proceedings of the 2007 conference on Designing pleasurable products and interfaces,
135-147.
Cawthon, N., & Moere, A.V. (2007). The effect of aesthetic on the usability of data visualization. In IV ’07: Proceedings of the 11th International Conference Information Visualization. IEEE
Computer Society, 637–648.
Emory, C.W., & Cooper, D.R. (1991). Business Research Method. Irwin, Homewood, IL.
Eroglu, S.A., Machleit, K.A., & Davis, L.M. (2001). Atmospheric qualities of online retailing: a conceptual model and implications. Journal of Business Research, 54(2), 177-184.
Fairchild, M. D. (2005). Color Appearance Models: CIECAM02 and Beyond. Tutorial slides for IS&T/SID 12th Color Imaging Conference.
Fechner, T. (1997). Various attempts to establish a basic form of beauty: Experimental aesthetics, golden section and square. Empirical Studies of Arts, 15, 115-130.
Gilboa, S., & Rafaeli, A. (2003). Store environment, emotions and approach Behavior: Applying environmental aesthetics to retailing. The International Review of Retail, Distribution and Consumer Research, 13 (2), 195-211.
Hassanein, K., & M Head, M. (2007). Manipulating perceived social presence through the web interface and its impact on attitude towards online shopping. International Journal of
Human-Computer Studies, 65 (8), 689-708.
van der Heijden, H. (2003). Factors influencing the usage of websites: the case of a generic portal in the Netherlands. Information and Management, 40, 541-549.
Ilmberger, W., Schrepp, M., & Held, T., (2008). Cognitive processes causing the relationship between aesthetics and usability.HCI and Usability for Education and Work, 5298, 43-54. Ismail, N.A.F., & Kadir, R.A. (2004). The characteristics of aesthetic screen design. 2nd National
Conf. On Computer Graphics & Multimedia, Selangor Malaysia.