warwick.ac.uk/lib-publications
Manuscript version: Author’s Accepted Manuscript
The version presented in WRAP is the author’s accepted manuscript and may differ from the
published version or Version of Record.
Persistent WRAP URL:
http://wrap.warwick.ac.uk/106517
How to cite:
Please refer to published version for the most recent bibliographic citation information.
If a published version is known of, the repository item page linked to above, will contain
details on accessing it.
Copyright and reuse:
The Warwick Research Archive Portal (WRAP) makes this work by researchers of the
University of Warwick available open access under the following conditions.
Copyright © and all moral rights to the version of the paper presented here belong to the
individual author(s) and/or other copyright owners. To the extent reasonable and
practicable the material made available in WRAP has been checked for eligibility before
being made available.
Copies of full items can be used for personal research or study, educational, or not-for-profit
purposes without prior permission or charge. Provided that the authors, title and full
bibliographic details are credited, a hyperlink and/or URL is given for the original metadata
page and the content is not changed in any way.
Publisher’s statement:
Please refer to the repository item page, publisher’s statement section, for further
information.
Evaluating How Interfaces Influence the User Interaction
with Fully Autonomous Vehicles
Luis Oliveira
1, Jacob Luton
2, Sumeet Iyer
3, Chris Burns
1,
Alexandros Mouzakitis
2, Paul Jennings
1, Stewart Birrell
11
WMG, University of Warwick, Coventry, United Kingdom
{l.oliveira, c.burns.2, s.birrell, paul.jennings}@warwick.ac.uk
2
Jaguar Land Rover, Coventry, United Kingdom {jluton1, amouzak1}@jaguarlandrover.com
3Tata Elxsi, London, United Kingdom [email protected]
ABSTRACT
With increasing automation, occupants of fully autonomous vehicles are likely to be completely disengaged from the driving task. However, even with no driving involved, there are still activities that will require interfaces between the vehicle and passengers. This study evaluated different configurations of screens providing operational-related information to occupants for tracking the progress of journeys. Surveys and interviews were used to measure trust, usability, workload and experience after users were driven by an autonomous low speed pod. Results showed that participants want to monitor the state of the vehicle and see details about the ride, including a map of the route and related information. There was a preference for this information to be displayed via an onboard touchscreen device combined with an overhead letterbox display versus a smartphone-based interface. This paper provides recommendations for the design of devices with the potential to improve the user interaction with future autonomous vehicles.
Author Keywords
Autonomous Vehicles; AVs; interfaces; User Experience; Trust in automation; usability; workload; Level-4; user study.
CCS Concepts
• Human-centered computing~Displays and imagers
INTRODUCTION
Automated driving is receiving increased attention due to technology developments, investments, early deployments and media coverage. There is the tendency to consider six levels of vehicle automation, from zero, where the driver is fully responsible for driving, to five, where an automated driving system is capable of handling all driving in all
circumstances [23,56]. Autonomous Vehicles (AVs) have the potential to increase mobility, improve road safety, reduce traffic, eliminate the burden of driving, use less energy, and reduce costs related to transportation [12,64]. However, there are hesitations towards the adoption of these vehicles [18] and even long-term projections indicate modest adoption of fully AV technologies [1]. In addition, the extent of the potential benefits depends on the level of automation implemented.
It has been suggested that dedicated automated driving systems could cause a remarkable increase in accessibility [43], benefiting those unable to drive and living in remote locations. However, additional benefits such as less traffic, less emissions and lower costs will require the implementation of schemes providing shared vehicles and ride shares [29]. The introduction of mobility as a service could challenge the current model of car ownership. AVs could be at the centre of schemes of shared ownership and ridership, with the potential to reduce costs per distance travelled and the number of vehicles needed to provide the required transportation [39]. Projections show that up to nine privately owned vehicles could be replaced by one shared autonomous electric vehicle [9]. Further developments of these schemes include the implementation of dynamic ride
Figure 1 – The level-4 vehicle (pod), designed and manufactured by RDM Automotive, used during this study
Permission to make digital or hard copies of all or part of this work for personal or classroom use is granted without fee provided that copies are not made or distributed for profit or commercial advantage and that copies bear this notice and the full citation on the first page. Copyrights for components of this work owned by others than the author(s) must be honored. Abstracting with credit is permitted. To copy otherwise, or republish, to post on servers or to redistribute to lists, requires prior specific permission and/or a fee. Request permissions from [email protected].
AutomotiveUI '18, September 23–25, 2018, Toronto, ON, Canada © 2018 Copyright is held by the owner/author(s). Publication rights licensed to ACM.
[image:2.612.316.557.497.675.2]sharing, which could reduce costs. The combination of savings, travel time and waiting time may determine the use and acceptance of shared rides [29]. Therefore, it is important to understand the user acceptance of the specific vehicles which users can share.
Proposed vehicles of the future could be available by demand, provide “last mile” transportation and be shared [46]. Early tests have been performed with AVs to transport passengers on the last mile of their journeys. It is possible to optimize scheduling and dispatching services to improve efficiency [15] and promote sustainability via mode shift from private to public means of transportation [47]. One study demonstrated a prototype for last mile transport capable of negotiating traffic and pedestrians in dynamic environments [11]. This vehicle could be booked via a smartphone application, but user perceptions were not measured. One survey of users of autonomous garden golf cars fitted with control screens focused on safety and comfort [53]. One extensive study of users of short distance AVs focused on how the vehicle should communicate intention to pedestrians and cyclists via external human-machine interaction [41]. These vulnerable road users still want to have priority over AVs on shared public spaces, and external communication can minimise the possibility of conflict when both have to share the same environments [13].
There is a growing body of research among the Automotive User Interface community to understand several aspects of user interaction with AVs [31]. A number of challenges and questions are frequently discussed but still need to be addressed, such as the ergonomics of interactions with a vehicle, situation awareness, acceptance, trust and ethical issues [42]. Trust in automation is a recurrent topic of research [25,51], and is characterised by the relation between two agents, one with expectations that the other will help towards the achievement of goals, especially in situations of uncertainty and vulnerability [45]. There have been a number of attempts to measure or improve trust in AVs in recent years [35]. One large scale survey indicated that user acceptance and user experience tends to decrease as the level of automation increases [55]. As passengers expect to have lower levels of control with more advanced AVs, they also report decreased fun and less trust in the technology. Ethnographic research and interviews are also used to understand experiences, attitudes and perceptions of trust in relation to AVs [36]. It is important to calibrate drivers’ trust in the systems to match the true capabilities of the vehicles and set appropriate levels, given that overtrust can result in failures [27,45]. Drivers tend to delegate full control to vehicles and engage in other activities, even when knowing that the car does not provide full autonomy [34].
There are numerous studies examining communication methods between automated agents and users or other co-located people. A thorough literature review lists current strategies for signalling machine behaviours, and indicates numerous challenges to be addressed [8]. There are usually multiple interfaces aboard vehicles, both embedded displays
and brought-in devices, which provide a range of services such as navigation instructions or non-driving related information [3,4]. Previous research evaluated how different sized screens affect the driving experience in an attempt to understand whether mobile phones are adequate interfaces for presenting real-time safety information[14]. Their results show that users glanced at small screens for longer than larger screens. This can be a safety risk when occupants are in charge of the driving functions. Diverse interfaces with the potential to improve the utility of automated systems have also been tested [40].
If an AV signals its actions and intentions or communicates its state to users, it can improve trustworthiness and acceptance [8]. To increase trust, the intelligent vehicle could inform its intentions and short term plans to occupants, either through explicit messages or ambient displays [24,37,57]. Trust in autonomous driving may be increased by adding interfaces showing the car’s interpretation of the environment and allowing users to forecast its behaviour [10]. One recent study showed that a map of the environment, similar to those currently used by driving assistants, improved participants’ trust, fostered feelings of safety and improved the user experience [21]. The design of an interface which communicates the automation reliability is particularly useful for conditions where drivers have to take back control of the car, for example, during failures or situations where the system is unable to handle the situation [49].
With increased automation, the occupant of the vehicle will be disengaged from the driving task and therefore may need to see less potential hazards [22]. However, even with no operational or tactical aspects of driving required, there are still strategic tasks [44] that will require interfaces between the vehicle and occupants. It is not clear whether screens will have to be provided for occupants so they can track the progress of the journey and receive additional information. Since trust in automation decreases as the levels of automation increases [55], and information can improve trust [8], there are opportunities for research to investigate the relationship between trust and the interfaces available for occupants of AVs.
[image:3.612.317.560.543.684.2]Aims
The aim of this study was to understand the influence of using different devices and screens to display information and control the destination of the vehicle. In particular, we explored trust, usability, user experience and workload in the relationship between the passenger and a fully AV. The intention was to evaluate the impact of using a personal device to control the journey compared to onboard devices. The research questions used to guide this study were the following: What are the preferred interfaces for receiving trip-related information and controlling journeys in AVs? Why do participants prefer one interface to another?
METHODS
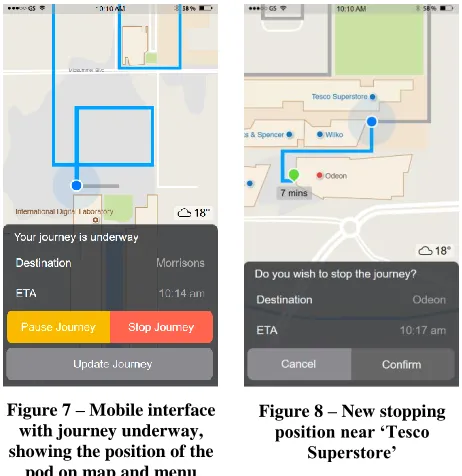
Experiments were performed in the Urban Development Lab in Coventry, UK, consisting of a large warehouse fitted with partitions decorated to resemble brick walls and curtains with projections portraying shop fronts (Figure 2). The environment was created to simulate pedestrianised areas in a town centre. Participants were invited to be passengers in a level 4 AV (Figure 1), meaning that the vehicle is capable of handling all driving functions under certain circumstances [23,56]. There are no pedals or steering wheel in the test vehicles (named ‘pods’), and the occupant has no control of the vehicle beyond an emergency-stop button. Participants were asked to consider that the pods used in this study were prototypes, which would operate in pedestrianised areas and allow passengers to make short journeys. For example, a passenger may make a trip of around one km from the train station to a supermarket or the cinema.
The recruitment of participants was made via internal emails sent to employees of a large car manufacturer based in the UK. We targeted only personnel working on administrative activities, largely avoiding those with the engineering and design of vehicles as their main jobs. By so doing, we intended to minimise previous knowledge, experience and biases towards AVs and automotive user interaction. We had twenty participants (five females) joining this experiment, with ages from 18 to 54 (M = 36).
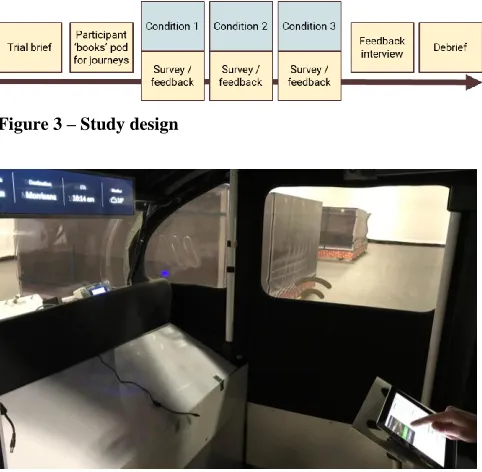
Before starting the experiment (Figure 3), we briefed participants the aims of the study, informed them of the fact that the study required video and audio recordings, and requested informed consent. They also received an induction to the arena and an overview of the risks and safety features of the pod. If they felt uncomfortable at any time, including during the actual runs, they could notify one of the trial coordinators at any time using a radio communicator. Participants could also stop the pod by pressing one of the emergency stop buttons fitted in the vehicle, but none did so. A “walkie-talkie” personal radio was placed inside the pod to relay instructions between study subjects and the researchers in the control booth.
Participants had to interact with interfaces to control the destination of the vehicle during the experiment. The three study conditions were (1) a mounted tablet with a “letterbox” overhead display fitted in the pod (Figure 4), (2) a handheld
[image:4.612.318.559.94.330.2]mobile phone and the letterbox display (Figure 5), and (3) a handheld mobile phone only.
[image:4.612.317.557.362.532.2]Figure 3 – Study design
Figure 4 – Mounted tablet in pod and letterbox (condition 1)
[image:4.612.316.558.568.692.2]Figure 5 – Mobile phone and letterbox (condition 2)
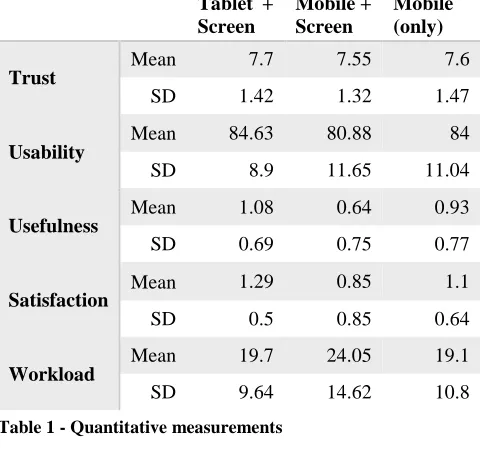
Figure 7 – Mobile interface with journey underway, showing the position of the
pod on map and menu
Figure 8 – New stopping position near ‘Tesco
Superstore’
All users made three journeys in the pod, counterbalanced to experience the journeys in different order. The information displayed on the phone and tablet included a map of the arena with the different shops, the position of the pod as it drove through the specified route, and the expected time of arrival (ETA) (Figure 7 and Figure 8).
The experiment included a “wizard of Oz” interaction [60], in which participants believed that they were controlling the robotic vehicle in real time via the interfaces. Although the pod is a fully autonomous level 4 vehicle, the initial and final positions were controlled by the experimenters and coordinated with the operators of the pod systems behind a black mirror. The phone and tablet applications contained animations of maps, which were timed to match the vehicle’s pre-defined route, and the operators would remotely start and stop the vehicle at specific times and locations according to user actions. Although deceptive, this technique is frequently used to test computational systems and AVs that are not yet actually autonomous [17,62].
The first task was to book the pod. Whilst still in the waiting area outside the arena, participants tapped on the specific button on the mobile device to call the pod. Participants were then asked to set the trip to Morrisons [a supermarket in the UK]. We then escorted the participant to the trial arena and into the pod, which was parked at the starting position. Once they were seated in the pod, the second task for the participant was to start the journey using the available device. The pod was remotely started in sync with the participant's input. After a few minutes, participants were given another task to complete. Using the radio, they were asked to use the available interfaces and devices to tap ‘Update journey’ to change the destination of the pod (Figure 7). We instructed participants with the following line:
Imagine that you have just had a phone call from a friend
who wants to meet you at the Odeon [Cinema]. Please could you update the journey so that the pod is going to the Odeon. The pod would then proceed to the new destination. Closer to the new destination we gave another instruction to participants: I would now like you to imagine that you have decided to stop at Tesco before you meet your friend so please could you stop the journey when the pod reaches Tesco Superstore (Figure 8). This was the final position for the current run.
Each session lasted five minutes, and after participants completed each session, a researcher escorted them to a desk where they completed questionnaires. One of the instruments evaluated trust in the technology they just interacted with, and was based on existing questionnaires for evaluating trust in autonomous systems [25,58]. The trust scale contains twelve items assessing concepts such as security, dependability, reliability and familiarity. Another questionnaire was the System Usability Scale (SUS) [6,7], an established questionnaire to measure usability of technological systems. The SUS consists of ten statements (for example ‘I thought the system was easy to use’) on a five point scale (from strongly agree to strongly disagree). One additional measurement was implemented to measure the participants’ experience whilst in the pod. Questions were based on the Advanced Transport Telematics survey [33], which have pairs of adjectives on a five point scale (e.g. useful/useless, pleasant/unpleasant, bad/good). We also administered the NASA-TLX (Task Load Index) [20], a survey to understand the perceived workload following specific tasks. This questionnaire evaluates mental, physical and temporal demands, performance, effort and frustration, and is commonly used to evaluate automotive interfaces [4]. Quantitative data from these surveys were analysed using SPSS software packages for the evaluation of variance and statistical significance from the three group conditions.
At the end of the trial, fifteen of the twenty participants (four females) were interviewed using a post-experience, semi-structured questionnaire. The remaining five interviews were not recorded due to technical mishaps. Participants were asked a few open-ended questions about the journeys in the pod and their expectations from the interfaces. Using a post-experience semi-structured interview [16], we asked them to describe their overall experience, comment on devices available to them, evaluate the different interfaces used during the study and describe their level of trust in the pod.
RESULTS
Trust, usability, experience and workload
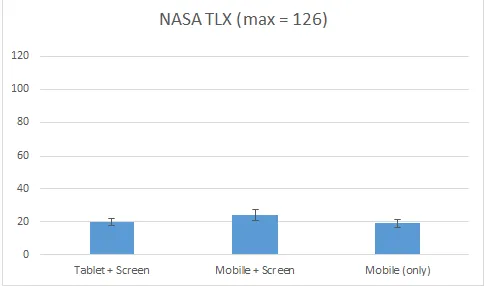
Table 1 presents aggregated results of the quantitative measurements used during this study. When analysing results from the System Trust Scale [25], the results show a rather high level of trust in the vehicle, with rankings from all three conditions above 60 points on a scale from 12 to 84. However, a repeated measures ANOVA determined that the effect of the three device configurations on rating of trust was non-significant (F(2, 38) = 0.396, p = 0.676) (Figure 9). It indicates that the device configuration setups in the study did not affect self-reported trust in the system.
When evaluating data from the System Usability Scale [6], we can see that responses were above 80 out of 100. A SUS score above a 68 would be considered above average, and on the ‘acceptable’ level. However, a repeated measures ANOVA determined that the effect of device configuration on rating of usefulness was also non-significant (F(2, 38) = 1.769, p = 0.184) (Figure 10). Therefore, the different device configuration setups in the study did not affect ratings of system usability.
Participants’ perceptions of usefulness with the different conditions during the study were evaluated via the Advanced Transport Telematics survey [33]. A repeated measures ANOVA determined that the effect of device configuration on rating of usefulness was significant (F(2, 38) = 3.962, p = 0.027). Pairwise comparisons revealed two statistically significant differences. Tablet + screen was rated higher than Mobile + screen (p = 0.03). Mobile (alone) was rated higher than Mobile + screen (p = 0.041) (Figure 11). Therefore, an onboard device for selecting destination combined with a secondary information screen was found to be more useful than a mobile phone for destination selection combined with a secondary information screen. A mobile phone for selecting destination without a secondary information screen was found to be more useful than a mobile phone for destination selection combined with a secondary information screen.
The scale proposed by Van Der Laan et al. [33] also evaluates the perceptions of satisfaction with the different conditions during the study. A repeated measures ANOVA determined that the effect of device configuration on rating of satisfaction was significant (F(2, 38) = 4.271, p = 0.021) (Figure 12). Pairwise comparisons revealed one statistically significant difference. Tablet + screen was rated higher than Mobile + screen (p = 0.019). An onboard device for selecting destination combined with a secondary information screen was found to be more satisfying than a mobile phone for destination selection combined with a secondary information screen.
The subjective workload reported by participants via the NASA-TLX [20] attempted to indicate if whether there were differences in task load between the different configurations of screens used during this study. A repeated measures ANOVA determined that the effect of device configuration
on rating of workload was not significant (F(2, 38) = 3.013,
p = 0.061) (Figure 13). This result shows that the device configuration setups available for the users did not affect workload.
Tablet + Screen
Mobile + Screen
Mobile (only)
Trust
Mean 7.7 7.55 7.6
SD 1.42 1.32 1.47
Usability
Mean 84.63 80.88 84
SD 8.9 11.65 11.04
Usefulness
Mean 1.08 0.64 0.93
SD 0.69 0.75 0.77
Satisfaction
Mean 1.29 0.85 1.1
SD 0.5 0.85 0.64
Workload
Mean 19.7 24.05 19.1
[image:6.612.318.558.130.364.2]SD 9.64 14.62 10.8
[image:6.612.316.557.364.507.2]Table 1 - Quantitative measurements
Figure 9 – Trust in the pod, per condition
[image:6.612.317.558.544.687.2]Figure 11 – Usefulness of the different conditions (* significantly different from Mobile + Screen, p < 0.05)
Figure 12 – Satisfaction with the different conditions
(* significantly different from Mobile + Screen, p < 0.05)
Figure 13 – Subjective workload per different conditions
Qualitative data analysis
From the thematic analysis of the interviews, we organised the information themes, which were listed as possible recommendations for improvement as extracted from the interviews. The main ideas mentioned by our participants are shown in Table 2. We suggest a few recommendations that could improve trust, usability, usefulness, satisfaction, and workload with fully AVs.
Interfaces
Twelve participants appreciated having detailed information about the ride on the tablet and/or the overhead letterbox display inbuilt in the vehicle. When compared to a handheld
mobile device, the embedded screens were usually preferred. Explanations provided by five participants included that they would not want to keep their phones in their hands all the time in order to monitor the journey, as participant 07 (P07) illustrates: “So I liked the iPad at the end. Because before that you kind of, do you hold your phone, do you put it down, where did it go”. P14 also describes that the inbuilt display
could improve the experience: “having the tablet in there I felt I sat there and enjoyed the ride rather than sitting looking on my phone, I actually looked around more”. Another
benefit of the inbuilt displays is that they release the personal phone to be used for other activities. P06 illustrated the need to keep the phone free: “because of the fact that you may be going to do something else on your phone, having that display across the top is really useful… I'd be quite reluctant to go and do something else on my phone because I wanted, I want to see that map”. P07 added that the journey seemed
safer having the additional display: “I felt the screen added a layer of security, it's that kind of second source of information that says where I'm going”. Participants also
mentioned that the tablet is larger, easier to see and interact with, and can convey more information on the screen than a personal phone.
One advantage of using a device fitted in the vehicle was that it reduced the concern related to the remaining battery life on a personal device, as reported by three participants. P03 described that “when having the phone, you may get a bit of battery anxiety, in case, you know, it's getting to the end of the night using the pod, I’ve got 3% left and it may be difficult”.
Given that the proposed pod can accommodate four passengers, inbuilt displays visible by all occupants provide some advantages over relying on personal devices. “The overhead display is extremely easy, if you're there with a bunch of friends, then you don't have to be the master of all knowledge, you've got it above your head, it's easy” (P03).
P08 complements: “I think if you were travelling in a group it makes it more obvious, whereas if there's four of you and only one has got the app on the phone, people would be asking how long it's going to be, where are we”.
Two participants mentioned concerns of data protection in a shared vehicle and its interfaces, since the system and potentially other passengers would know their origin, destination, and additional information such as username. “I prefer the phone. It's more personal to use that, I assume it's going to be like, multi shared, with four seats,I'm with the impression that you may not be the only person that is going on that only journey, so I’d prefer to have my data personal to myself” (P02).
The information displayed on the interfaces was evaluated positively by participants: “it just gives you a bit more confidence, I think, having the information around you”
[image:7.612.54.297.232.377.2] [image:7.612.53.298.410.553.2]on the right direction, it's going to where you said” (P01).
Users also suggested more content for the screens, such as speed, points of interest, and a way to identify possible hazards such as obstacles and pedestrians. Five participants added suggestions to the ergonomics of the interfaces, such as a way to zoom in and out maps, and scale the screens so they are more adequate for small devices. One participant mentioned concerns around data privacy: if you are using the embedded screen to control the vehicle, the device will record your personal data, origin and destination.
Four participants mentioned concerns about connectivity between a mobile device and the pod, which would not be the case with an inbuilt interface. P04 describes their opinions about the tablet fixed in the vehicle:
“I know the device is linked, it's connected, I know it would receive the signal from the device, I'd be worried if I was using my mobile phone, that it hasn't received an update when I wanted to stop it or change to where it's going”.
Familiarity
Eight participants mentioned that their experience in the pod had been similar to a bus, taxi, fairground ride or airport rail shuttle. Not only due to the ride itself, but also because some of the technology on board seemed familiar. Participants said that the screens resembled those found on London buses, since “that head-up display that's got the final stats of where you're going, you know, like on a bus that tells you where you're going, is also, I quite like that” (P06). P08 describes
their perceptions of being driven by the pod: “I guess, similar to sitting in the back of a cab, you just kind of get on with our own thing, really, and are not really watching the road or what's going on”.
The increased familiarity with the pod through the three runs made participants more at ease with time, and even helped increasing trust in the vehicle. P09 exemplifies saying that “the more you use the more confident you are going to be with its ability. (…) I suppose as you use it more you just become blasé, you know”. P02 also commented on their
initial impressions of the experience in the pod and demonstrated that it evolved:
“You think it's going to hit the corner, you know, it gets really close, and then when it heads towards that corner it seems to take longer than normal, you go like 'oh', but by the end of it I was not concerned at all. (…) I think, by the third one, I stopped worrying about and wondering, you know, you get used to it”.
DISCUSSION
The three configurations of displays provided to participants did not differ in terms of trust in the vehicle. However, our participants mentioned that they still want to know details about the ride including a map of the route and related information. Even if they are not controlling the vehicle, they seemed to want to monitor its state via interfaces fitted inside
Aspects Recommendations
Interfaces Provide an inbuilt device and an overhead display
Allow passenger to monitor the state of vehicle
Show vehicle’s next actions
Improve design and ergonomics
Guarantee data protection
Familiarity Provide exposition to AVs
[image:8.612.317.552.53.238.2]Make it similar to other familiar transport modes
Table 2 – Summary of qualitative themes as recommendations for improvements
the vehicle. This finding resonates with previous literature, which indicates that information about behaviours and intentions of robotic agents can improve trust [8]. This finding is particularly important given the reduced level of trust in fully AVs in comparison to traditional human-driven cars [55].
The different device configuration setups presented in this study did not affect ratings of system usability. They all seemed relatively easy to use, but participants mentioned they had preferences regarding usefulness and satisfaction. A tablet mounted in the vehicle combined with an overhead display was considered more useful and provided a better experience than a phone with the overhead display. When asked their reasons behind these preferences, participants mentioned they would not want to be holding their phones throughout the duration of the journey to keep track of the journey or to perform the required tasks such as changing the destination. Participants also mentioned that they wanted to have their phones free for other activities. This finding is in accordance with previous literature, which describes that personal devices are regularly used to pass the time when using public transport [38] and smartphone applications are capable of making waiting times seem shorter [50]. One interesting result was that the mobile phone without a secondary information screen was found to be more useful than with a secondary information screen. It may be explained by the fact that the overhead display contained convenient information, but without one, participants felt the mobile phone was useful, since it was the only means of monitoring the journey.
The differences in workload required by the tasks proposed during this study were not significant. Previous studies with automotive interfaces have not always indicated significant differences in the TLX index between conditions [2,4].
occupants would benefit shared rides. Participants also referred to the mobile phone battery anxiety, which may occur if they have to rely solely on personal phones to interact with the vehicle. Having a fitted device would allow users to depend on the vehicle’s battery, although our participants failed to consider the vehicle’s battery life, which is a frequent concern [9,48] in other studies.
The technology applied to AVs may allow the acquisition of knowledge about the environment and map possible hazards before humans can see them, especially with the potential to share data between vehicles and road infrastructure [30,54]. There may be the opportunity to include anthropomorphism [8,63] not only on the way the vehicle looks, but also trying to readjust the pod’s driving behaviour so it seems more human. It is also possible to improve the information provided to occupants to assure them that the vehicle is aware of any upcoming hazards [59].
With the implementation of vehicle automation, the occupants of future cars are becoming less involved with the driving tasks. It is anticipated that fewer interfaces will be required and less information will be given to occupants [22]. However, most participants appreciated having a tablet and an overhead display in the pod to monitor the journey. Usually, a larger screen is better [14], but there are still some questions about where should they be placed, and what information should it display.
Data privacy was seldom mentioned by our participants, but it still poses a risk since every activity in connected and AVs can potentially be recorded and consequently seen by other parties. When prompted, people can discuss about a number of issues such as hacking of AVs [61]. The design and manufacture of the car of the future should take in consideration concerns related to privacy and security, which seems to be largely neglected by the Automotive UI community [31].
Limitations and future work
We understand that this research presents some limitations. The location chosen for the tests is a confined environment, which may give a false sense of safety to participants and therefore skew the results. The demographics of participants may not represent the target population for these vehicles, since we had mainly male able-bodied participants working for a car manufacturer. The general population could be invited to participate in future studies, with a more balanced gender and controlled age ratio, to evaluate the vehicles and their interfaces. Measurements of attitudes towards autonomous vehicles [32,52] could also be used before and after the interactions.
The screens used during the current study presented only basic information such as map, destination, time and weather. Future study designs could include tests of more informative interfaces to indicate system transparency, hazard perceptions and future actions so users can forecast the vehicle behaviour [28]. Users may demonstrate different preferences when more content is displayed on the available
interfaces. With complex interfaces and more information, it will be interesting to measure task load impact [20] before and after the trips and consequently understand how the levels of stress change due to the interactions.
More research is needed on the design of interfaces to understand adequate ways of providing information and giving basic levels of control for aspects such as the destination of the AVs. The ergonomics of the interaction is especially important considering that the current trend is for elderly and disabled people to be the major users of fully AVs [19]. The market uptake will be determined by the extent to which these systems perform safely, and to how much people perceive them to be trustworthy. It will be necessary to provide safe AVs in order to overcome hesitations [18] and improve the adoption of fully AV technologies [1]. Future research could evaluate how the interaction evolves over time, after repeated exposure to AVs and increased familiarity. With a longitudinal study design, participants may show changes in their patterns of interactions with the vehicle, as happens with other technologies [26].
Future research could perform trials in more complex environments, with vehicles negotiating traffic, pedestrians, bicycles and street furniture. It could also involve abrupt events requiring emergency braking or roadworks and subsequent diversions. Other recommendations for future studies include video recording inside the vehicle and eye tracking to measure the level of engagement with the screens. It is also possible to simulate the ride share experiences to evaluate comfort and to test if passengers would prefer to use their personal phones rather than a shared tablet.
CONCLUSIONS
This study demonstrated that, in order to control the destination and interact with a low speed AV, participants preferred the inbuilt tablet combined with an overhead display. The devices fitted in the vehicle were more useful and more satisfying than a mobile phone combined with the overhead display. In addition, using a phone without the additional display in the vehicle was found to be more useful than a phone combined with the display. From the surveys and interviews conducted during this study, we propose a few recommendations to improve usability, user experience and trust in AVs. These vehicles should provide means for controlling the journey through built-in interfaces and not rely only on users’ smartphones. Displays could also give feedback about how the systems are performing and explicit the vehicle’s next actions. Attention should be directed to the usability and ergonomics of the interfaces, and data protection should be guaranteed. Finally, we indicate that more exposure to AV could reduce resistance and increase the chances of acceptance.
diverse types of devices, displaying varied information, and having different connection styles. The design of these interactions face many open questions and more studies are needed to make sure the technology requirements are fulfilled, and more importantly, that user needs are met. There is the opportunity to explore these areas further with more research and ultimately improve the design of AVs and their information and communication systems. More studies are needed to make sure that vehicles of the future are easy to use, useful, provide a good user experience and are trustworthy.
ACKNOWLEDGEMENTS
This study was part of the UK Autodrive, a flagship, multi-partner project, focusing on the development of the Human Machine Interface (HMI) strategies and performing real-world trials of these technologies in low-speed AVs (http://www.ukautodrive.com). This project is funded by Innovate UK – an agency to find and drive science and technology innovations. The authors would like to thank the reviewers for their valuable comments, which helped improving the quality of this paper.
REFERENCES
1. Prateek Bansal and Kara M. Kockelman. 2017. Forecasting Americans’ long-term adoption of connected and autonomous vehicle technologies.
Transportation Research Part A: Policy and Practice
95: 49–63. https://doi.org/10.1016/j.tra.2016.10.013
2. Stewart A. Birrell, Mark S. Young, and Alex M. Weldon. 2013. Vibrotactile pedals: Provision of haptic feedback to support economical driving. Ergonomics
56, 2: 282–292.
https://doi.org/10.1080/00140139.2012.760750
3. Susanne Boll, Andrew L. Kun, Peter Fröhlich, and James Foley. 2013. Automotive user interface research moves into fast lane. CHI ’13 Extended Abstracts on
Human Factors in Computing Systems on - CHI EA ’13: 2525. https://doi.org/10.1145/2468356.2468821
4. Adam Bolton, Gary Burnett, and David R Large. 2015. An investigation of augmented reality presentations of landmark-based navigation using a head-up display.
Proceedings of the 7th International Conference on Automotive User Interfaces and Interactive Vehicular
Applications - AutomotiveUI ’15: 56–63.
https://doi.org/10.1145/2799250.2799253
5. Virginia Braun and Victoria Clarke. 2006. Using thematic analysis in psychology. Qualitative Research
in Psychology 3, 2: 77–101.
https://doi.org/10.1191/1478088706qp063oa
6. John Brooke. 1996. SUS-A quick and dirty usability scale. In Usability evaluation in industry, Patrick W Jordan, B Thomas, Ian Lyall McClelland and Bernard Weerdmeester (eds.). Taylor & Francis, London, UK, 189–194.
7. John Brooke. 2013. SUS: a retrospective. Journal of
Usability Studies 8, 2: 29–40. Retrieved from
http://dl.acm.org/citation.cfm?id=2817912.2817913
8. Elizabeth Cha, Yunkyung Kim, Terrence Fong, and Maja J Mataric. 2018. A Survey of Nonverbal Signaling Methods for Non-Humanoid Robots.
Foundations and Trends in Robotics 6, 4: 211–323. https://doi.org/10.1561/2300000057
9. T. Donna Chen, Kara M. Kockelman, and Josiah P. Hanna. 2016. Operations of a shared, autonomous, electric vehicle fleet: Implications of vehicle & charging infrastructure decisions. Transportation Research Part A: Policy and Practice 94: 243–254. https://doi.org/10.1016/j.tra.2016.08.020
10. Jong Kyu Choi and Yong Gu Ji. 2015. Investigating the Importance of Trust on Adopting an Autonomous Vehicle. International Journal of Human-Computer
Interaction 31, 10: 692–702.
https://doi.org/10.1080/10447318.2015.1070549
11. Z. J. Chong, B. Qin, T. Bandyopadhyay, T. Wongpiromsarn, B. Rebsamen, P. Dai, E. S. Rankin, and M. H. Ang. 2013. Autonomy for Mobility on Demand. In Advances in Intelligent Systems and
Computing. 671–682.
https://doi.org/10.1007/978-3-642-33926-4_64
12. Daniel J Fagnant and Kara Kockelman. 2015. Preparing a nation for autonomous vehicles: opportunities, barriers and policy recommendations. Transportation Research Part A: Policy and Practice 77: 167–181. https://doi.org/10.1016/j.tra.2015.04.003
13. Lex Fridman, Bruce Mehler, Lei Xia, Yangyang Yang, Laura Yvonne Facusse, and Bryan Reimer. 2017. To Walk or Not to Walk: Crowdsourced Assessment of External Vehicle-to-Pedestrian Displays. CoRR -
Computer Research Repository 1707, 2698: 7.
Retrieved from http://arxiv.org/abs/1707.02698
14. Peter Fröhlich, Matthias Baldauf, Stefan Suette, Dietmar Schabus, and Matthias Fuchs. 2012. Investigating in-car safety services on the motorway. In
Proceedings of the 2012 ACM annual conference extended abstracts on Human Factors in Computing Systems Extended Abstracts - CHI EA ’12, 1787. https://doi.org/10.1145/2212776.2223710
15. Xiangjun Fu, Michael Vernier, Arda Kurt, Keith Redmill, and Umit Ozguner. 2017. Smooth: Improved Short-distance Mobility for a Smarter City.
Proceedings of the 2nd International Workshop on Science of Smart City Operations and Platforms
Engineering - SCOPE ’17: 46–51.
https://doi.org/10.1145/3063386.3063760
16. Elizabeth Goodman, Mike Kuniavsky, and Andrea Moed. 2012. Observing the User Experience: A
Kaufmann.
17. A. Habibovic, J. Andersson, M. Nilsson, V. Malmsten Lundgren, and J. Nilsson. 2016. Evaluating interactions with non-existing automated vehicles: Three Wizard of Oz approaches. IEEE Intelligent Vehicles Symposium,
Proceedings 2016–Augus, Iv: 32–37.
https://doi.org/10.1109/IVS.2016.7535360
18. Chana J. Haboucha, Robert Ishaq, and Yoram Shiftan. 2017. User preferences regarding autonomous vehicles.
Transportation Research Part C: Emerging
Technologies 78: 37–49.
https://doi.org/10.1016/j.trc.2017.01.010
19. Corey D. Harper, Chris T. Hendrickson, Sonia Mangones, and Constantine Samaras. 2016. Estimating potential increases in travel with autonomous vehicles for the non-driving, elderly and people with travel-restrictive medical conditions. Transportation Research Part C: Emerging Technologies 72: 1–9. https://doi.org/10.1016/j.trc.2016.09.003
20. Sandra G. Hart and Lowell E. Staveland. 1988. Development of NASA-TLX (Task Load Index): Results of Empirical and Theoretical Research.
Advances in Psychology 52: 139–183.
https://doi.org/10.1016/S0166-4115(08)62386-9
21. Renate Häuslschmid, Max von Bülow, Bastian Pfleging, and Andreas Butz. 2017. SupportingTrust in Autonomous Driving. Proceedings of the 22nd International Conference on Intelligent User Interfaces
- IUI ’17: 319–329.
https://doi.org/10.1145/3025171.3025198
22. Renate Häuslschmid, Yixin Shou, John O’Donovan, Gary Burnett, and Andreas Butz. 2016. First Steps towards a View Management Concept for Large-sized Head-up Displays with Continuous Depth. In
Proceedings of the 8th International Conference on Automotive User Interfaces and Interactive Vehicular
Applications - Automotive’UI 16, 1–8.
https://doi.org/10.1145/3003715.3005418
23. HHTSA. 2018. Automated Vehicles for Safety.
National Highway Traffic Safety Administration.
Retrieved April 13, 2018 from
https://www.nhtsa.gov/technology-innovation/automated-vehicles-safety
24. Hanneke Hooft van Huysduynen, Jacques Terken, Alexander Meschtscherjakov, Berry Eggen, and Manfred Tscheligi. 2017. Ambient Light and its Influence on Driving Experience. Proceedings of the 9th International Conference on Automotive User Interfaces and Interactive Vehicular Applications -
AutomotiveUI ’17: 293–301.
https://doi.org/10.1145/3122986.3122992
25. Jiun-Yin Jian, Ann M Bisantz, and Colin G Drury. 2000. Foundations for an Empirically Determined
Scale of Trust in Automated Systems. International
Journal of Cognitive Ergonomics 4, 1: 53–71.
https://doi.org/10.1207/S15327566IJCE0401_04
26. Evangelos Karapanos, John Zimmerman, Jodi Forlizzi, and Jean Bernard Martens. 2010. Measuring the dynamics of remembered experience over time.
Interacting with Computers 22, 5: 328–335.
https://doi.org/10.1016/j.intcom.2010.04.003
27. Siddartha Khastgir, Stewart Birrell, Gunwant Dhadyalla, and Paul Jennings. 2017. Calibrating Trust to Increase the Use of Automated Systems in a Vehicle. In Advances in Human Aspects of Transportation, Neville A. Stanton, Steven Landry, Giuseppe Di Bucchianico and Andrea Vallicelli (eds.). Springer International Publishing, Cham, 535–546. https://doi.org/10.1007/978-3-319-41682-3_45
28. Jeamin Koo, Jungsuk Kwac, Wendy Ju, Martin Steinert, Larry Leifer, and Clifford Nass. 2015. Why did my car just do that? Explaining semi-autonomous driving actions to improve driver understanding, trust, and performance. International Journal on Interactive
Design and Manufacturing 9, 4: 269–275.
https://doi.org/10.1007/s12008-014-0227-2
29. Rico Krueger, Taha H. Rashidi, and John M. Rose. 2016. Preferences for shared autonomous vehicles.
Transportation Research Part C: Emerging
Technologies 69: 343–355.
https://doi.org/10.1016/j.trc.2016.06.015
30. Swarun Kumar, Lixin Shi, Nabeel Ahmed, Stephanie Gil, Dina Katabi, and Daniela Rus. 2012. CarSpeak: a content-centric network for autonomous driving. In
Proceedings of the ACM SIGCOMM 2012 conference on Applications, technologies, architectures, and protocols for computer communication - SIGCOMM ’12, 259. https://doi.org/10.1145/2342356.2342403
31. Andrew L. Kun, Susanne Boll, and Albrecht Schmidt. 2016. Shifting Gears: User Interfaces in the Age of Autonomous Driving. IEEE Pervasive Computing 15, 1: 32–38. https://doi.org/10.1109/MPRV.2016.14
32. M. Kyriakidis, R. Happee, and J. C.F. De Winter. 2015. Public opinion on automated driving: Results of an international questionnaire among 5000 respondents.
Transportation Research Part F: Traffic Psychology
and Behaviour 32: 127–140.
https://doi.org/10.1016/j.trf.2015.04.014
33. Jinke D. Van Der Laan, Adriaan Heino, and Dick De Waard. 1997. A simple procedure for the assessment of acceptance of advanced transport telematics.
Transportation Research Part C: Emerging
Technologies 5, 1: 1–10.
https://doi.org/10.1016/S0968-090X(96)00025-3
Longitudinal Simulator Study to Explore Drivers’ Behaviour During Highly-Automated Driving. In
Advances in Human Aspects of Transportation. 583– 594. https://doi.org/10.1007/978-3-319-60441-1_57
35. Kornélia Lazányi. 2017. Do you trust your car? CINTI 2016 - 17th IEEE International Symposium on
Computational Intelligence and Informatics:
Proceedings: 309–314.
https://doi.org/10.1109/CINTI.2016.7846424
36. Jiin Lee, Naeun Kim, Chaerin Imm, Beomjun Kim, Kyongsu Yi, and Jinwoo Kim. 2016. A Question of Trust: An Ethnographic Study of Automated Cars on Real Roads. Proceedings of the 8th International Conference on Automotive User Interfaces and Interactive Vehicular Applications - Automotive’UI 16: 201–208. https://doi.org/10.1145/3003715.3005405
37. Andreas Löcken, Wilko Heuten, and Susanne Boll. 2016. AutoAmbiCarr: Using Ambient Light to Inform Drivers About Intentions of Their Automated Cars. In
Proceedings of the 8th International Conference on Automotive User Interfaces and Interactive Vehicular Applications Adjunct - Automotive’UI 16, 57–62. https://doi.org/10.1145/3004323.3004329
38. Glenn Lyons, Juliet Jain, and Iain Weir. 2016. Changing times – A decade of empirical insight into the experience of rail passengers in Great Britain. Journal
of Transport Geography 57: 94–104.
https://doi.org/10.1016/j.jtrangeo.2016.10.003
39. Neda Masoud and R. Jayakrishnan. 2017. Autonomous or driver-less vehicles: Implementation strategies and operational concerns. Transportation Research Part E:
Logistics and Transportation Review 108, November:
179–194. https://doi.org/10.1016/j.tre.2017.10.011
40. Keenan R. May, B.E. Noah, and B.N. Walker. 2017. Driving acceptance: Applying structural equation modeling to in-vehicle automation acceptance.
AutomotiveUI 2017 - 9th International ACM Conference on Automotive User Interfaces and
Interactive Vehicular Applications, Adjunct
Proceedings.
https://doi.org/10.1145/3131726.3131755
41. Natasha Merat, Tyron Louw, Ruth Madigan, Marc Wilbrink, and Anna Schieben. 2018. What externally presented information do VRUs require when interacting with fully Automated Road Transport Systems in shared space? Accident Analysis and
Prevention, October 2016: 0–1.
https://doi.org/10.1016/j.aap.2018.03.018
42. Alexander Meschtscherjakov, Manfred Tscheligi, Peter Fröhlich, Rod McCall, Andreas Riener, and Philippe Palanque. 2017. Mobile interaction with and in autonomous vehicles. Proceedings of the 19th
International Conference on Human-Computer
Interaction with Mobile Devices and Services -
MobileHCI ’17: 1–6.
https://doi.org/10.1145/3098279.3119837
43. Jonas Meyer, Henrik Becker, Patrick M. Bösch, and Kay W. Axhausen. 2017. Autonomous vehicles: The next jump in accessibilities? Research in
Transportation Economics 62: 80–91.
https://doi.org/10.1016/j.retrec.2017.03.005
44. Ja Michon. 1985. Human Behavior and Traffic Safety. Springer US, Boston, MA. https://doi.org/10.1007/978-1-4613-2173-6
45. Alexander G Mirnig, Philipp Wintersberger, Christine Sutter, and Jürgen Ziegler. 2016. A Framework for Analyzing and Calibrating Trust in Automated Vehicles. Proceedings of the 8th International Conference on Automotive User Interfaces and
Interactive Vehicular Applications Adjunct -
Automotive’UI 16: 33–38.
https://doi.org/10.1145/3004323.3004326
46. Alexander Mirnig, Alexander Meschtscherjakov, and Magdalena Gärtner. 2017. Autonomous Driving: A Dream on Rails? Mensch und Computer
2017-Workshopband, C.
https://doi.org/10.18420/muc2017-ws09-0309
47. Aditi Moorthy, Robert De Kleine, Gregory Keoleian, Jeremy Good, and Geoff Lewis. 2017. Shared Autonomous Vehicles as a Sustainable Solution to the Last Mile Problem: A Case Study of Ann Arbor-Detroit Area. SAE International Journal of Passenger Cars - Electronic and Electrical Systems 10, 2: 2017-01– 1276. https://doi.org/10.4271/2017-01-1276
48. Jeremy Neubauer and Eric Wood. 2014. The impact of range anxiety and home, workplace, and public charging infrastructure on simulated battery electric vehicle lifetime utility. Journal of Power Sources 257: 12–20. https://doi.org/10.1016/j.jpowsour.2014.01.075
49. Brittany E. Noah and Bruce N. Walker. 2017. Trust Calibration through Reliability Displays in Automated Vehicles. Proceedings of the Companion of the 2017 ACM/IEEE International Conference on Human-Robot
Interaction - HRI ’17: 361–362.
https://doi.org/10.1145/3029798.3034802
50. Luis Oliveira, Val Mitchell, and Andrew May. 2016. Reducing temporal tensions as a strategy to promote sustainable behaviours. Computers in Human Behavior
62: 303–315.
https://doi.org/10.1016/j.chb.2016.04.004
51. Raja Parasuraman and Christopher a. Miller. 2004. Trust and etiquette in high-criticality automated systems. Communications of the ACM 47, 4: 51. https://doi.org/10.1145/975817.975844
2014. Intention to use a fully automated car: Attitudes and a priori acceptability. Transportation Research Part F: Traffic Psychology and Behaviour 27, PB: 252– 263. https://doi.org/10.1016/j.trf.2014.04.009
53. Scott Pendleton, Tawit Uthaicharoenpong, Zhuang Jie Chong, Guo Ming James Fu, Baoxing Qin, Wei Liu, Xiaotong Shen, Zhiyong Weng, Cody Kamin, Mark Adam Ang, Lucas Tetsuya Kuwae, Katarzyna Anna Marczuk, Hans Andersen, Mengdan Feng, Gregory Butron, Zhuang Zhi Chong, Marcelo H. Ang, Emilio Frazzoli, and Daniela Rus. 2015. Autonomous golf cars for public trial of mobility-on-demand service. IEEE International Conference on Intelligent Robots and
Systems 2015–Decem: 1164–1171.
https://doi.org/10.1109/IROS.2015.7353517
54. Hang Qiu, Fawad Ahmad, Ramesh Govindan, Marco Gruteser, Fan Bai, and Gorkem Kar. 2017. Augmented Vehicular Reality: Enabling Extended Vision for Future Vehicles. Proceedings of the 18th International Workshop on Mobile Computing Systems and
Applications - HotMobile ’17: 67–72.
https://doi.org/10.1145/3032970.3032976
55. Christina Rödel, Susanne Stadler, Alexander Meschtscherjakov, and Manfred Tscheligi. 2014. Towards Autonomous Cars: The Effect of Autonomy Levels on Acceptance and User Experience.
Proceedings of the 6th International Conference on Automotive User Interfaces and Interactive Vehicular
Applications: 1–8.
https://doi.org/10.1145/2667317.2667330
56. SAE. 2014. J3016: Taxonomy and Definitions for Terms Related to On-Road Motor Vehicle Automated Driving Systems. SAE International. Retrieved April
13, 2018 from
https://www.sae.org/standards/content/j3016_201609/
57. Gerald J Schmidt and Lena Rittger. 2017. Guiding Driver Visual Attention with LEDs. In Proceedings of the 9th International Conference on Automotive User Interfaces and Interactive Vehicular Applications -
AutomotiveUI ’17, 279–286.
https://doi.org/10.1145/3122986.3122994
58. Randall D Spain, Ernesto A Bustamante, and James P Bliss. 2008. Towards an Empirically Developed Scale for System Trust: Take Two. Proceedings of the Human Factors and Ergonomics Society Annual
Meeting 52, 19: 1335–1339.
https://doi.org/10.1177/154193120805201907
59. Patrick Stahl, Birsen Donmez, and Greg A Jamieson. 2016. Supporting anticipation in driving through attentional and interpretational in-vehicle displays.
Accident Analysis and Prevention 91: 103–113.
https://doi.org/10.1016/j.aap.2016.02.030
60. A Steinfeld, O C Jenkins, and B Scassellati. 2009. The Oz of Wizard: Simulating the human for interaction research. Proc. of ACM/IEEE Int’l. Conf. on
Human-Robot Interaction: 101–108.
61. Arun Ulahannan, Rebecca Cain, Gunwant Dhadyalla, Paul Jennings, Stewart Birrell, Mike Waters, and Alex Mouzakitis. 2019. Using the Ideas Café to Explore Trust in Autonomous Vehicles. In Amic G. Ho (ed.). Springer International Publishing, Cham, 3–14. https://doi.org/10.1007/978-3-319-93888-2_1
62. Tom van Veen, Juffrizal Karjanto, and Jacques Terken. 2017. Situation Awareness in Automated Vehicles through Proximal Peripheral Light Signals.
Proceedings of the 9th International Conference on Automotive User Interfaces and Interactive Vehicular
Applications - AutomotiveUI ’17: 287–292.
https://doi.org/10.1145/3122986.3122993
63. Frank M F Verberne, Jaap Ham, and Cees J H Midden. 2015. Trusting a Virtual Driver That Looks, Acts, and Thinks Like You. Human Factors: The Journal of the Human Factors and Ergonomics Society 57, 5: 895– 909. https://doi.org/10.1177/0018720815580749
64. Zia Wadud, Don MacKenzie, and Paul Leiby. 2016. Help or hindrance? The travel, energy and carbon impacts of highly automated vehicles. Transportation Research Part A: Policy and Practice 86: 1–18. https://doi.org/10.1016/j.tra.2015.12.001