© 2019, IRJET | Impact Factor value: 7.211 | ISO 9001:2008 Certified Journal
| Page 4448
COMPARATIVE STUDY ON SCC WITH PARTICLE PACKING DENSITY AND
EFNARC DESIGN
Santhosh K
1, Surendra P
2, Kotreppa Koppa
3, Ravikumar Patil
4, Sharanakumara
5, Shubham
Pundlik Mane
61,2
Assistant Professor, Department of Civil Engineering, AIET, Moodbidri, India.
3,4,5,6
Under graduate student Department of Civil Engineering, AIET, Moodbidri, India.
---***---
Abstract:-
Self-compacting concrete (SCC) is an innovative concrete that does not require vibration for placing and compaction. The hardened concrete is dense, homogeneous and has the same engineering properties and durability as traditional vibrated concrete. The self-compacting concrete flows easily at suitable speed into formwork without blocking through the reinforcement without being heavily vibrated. This project deals with the self- compacting concrete where the cement is partially replaced with fly-ash Here Ordinary Portland Cement is replaced with 20% of fly-ash. The mix design particle packing density is used to determine the proportion of concrete ingredient and comparing with the EFNARC 2005 guideline. This work summarizes the experiments for evaluating the performance of self-compacting concrete including V-funnel, L-box, J-ring and slump flow tests as well as the recent achievements of the fresh and hardened properties of self-compacting concrete such as slump flow, segregation resistance is studied for the different water cement ratio and compressive strength and tensile strength for corresponding mix determined.Keywords: Self Compacting Concrete, flow ability, passing ability, resistance to segregation, fly ash, Super plasticizer.
1.I
NTRODUCTIONSelf-compacting concrete (SCC) is an innovative concrete that does not require vibration for placing and compaction.The hardened concrete is dense, homogeneous and has the same engineering properties and durability as traditional vibrated concrete.
Self-compacting concrete (SCC) was first developed in Japan in the late 1980‘s as a concrete that can flow through congested reinforcing bars with elimination of compaction, and without undergoing any significant segregation and bleeding. In recent times, this concrete has gained wide use in many countries for different applications and structural configurations. Adoption of SCC offers substantial benefits in enhancing construction productivity, reducing overall cost, and improving work environment. Therefore, the first point to be considered when designing SCC is to restrict the volume of the coarse aggregate. This reduction necessitates the use of higher volume of cement which increases the cost, besides resulting in undesirable temperature rise. So, cement should be replaced by other mineral admixtures like Blast Furnace Slag, Fly Ash, Silica Fumes, etc. The usage of mineral admixtures in the production of SCC not only provides economic benefits but also reduces heat of hydration. A very limited work is reported from India, non-mechanization of the construction industry, abundant
availability of construction materials available at very low cost. There for it can be said that SCC is still quite unknown to many researchers, builders, ready mix concrete production, academia etc. There are non-coda references for the mix design of high-grade Concrete. Mix designs for high grade concrete can be done by particle packing density Method. This is a new concept of mix design.
The packing density is the ratio of volume of solids to the total bulk volume. The Particle Packing gives indirect measurement of geometry of the concrete mix and also gives the cement paste to be required to fill the Void content in the concrete. To achieve the optimized particle packing density, particle is selected in such a way that small size particles fill up the Voids between the larger particles and so on. The Voids between the aggregate particles are filled by the cement paste and the excess of the paste will be a solid coating around each aggregate present in the mix. For the optimized packing density of aggregate small amount of paste content is required to fill the Voids.
2.
MATERIALS
USED
2.1 Cement
© 2019, IRJET | Impact Factor value: 7.211 | ISO 9001:2008 Certified Journal
| Page 4449
2.2 Coarse Aggregate
Coarse aggregate crushed granite of size 10 mm used as coarse aggregate. The sieve analysis of coarse aggregates confirms to the specifications of IS 383:1970 for graded aggregate and specific gravity 2.72, Water Absorption 1.70%, and Impact value 12.67%.
2.3 Fine Aggregate
M-sand is used as a fine aggregate conforming to the requirements of IS: 383 – 1970. The M-Sand is artificially manufactured sand, consisting of particles of different sizes proportioned to suite the requirement of Fine Aggregates to be used in structural concrete. The M - Sand used in the mix has a specific gravity of 2.37, Water absorption of 8.5%, Loose Bulk Density of 1580kg/m3 and Roded Bulk Density of 1860kg/m3.
2.4 Water
The potable water available in the laboratory, satisfying the requirement of IS 456-2000 is used for mixing the HPC and also curing all the concrete specimens, PH of water used is almost neutral (7).
2.5 Mineral Admixture
Fly Ash Fly ash is a fine inorganic material with pozzolanic properties, which can be added to SCC to improve its properties.
2.6Chemical Admixture
Master Glenium Sky 8233 is an admixture of a new generation based on modified polycarboxylic ether. The product has been primarily developed for applications in high performance concrete where the highest durability and performance is required. It is used to increase the workability and reduce water content in the concrete.
Physical and chemical properties of Master GleniumSky 8233
Table 2.1 Physical and chemical properties
Form Liquid
Colour Brown
Odour characteristics Boiling point >100oc
pH 6-9
3. MIX DESIGN PROCEDURES
3.1 EFNARC Mix design
EFNARC The mix sequence is determined as:
1. Designation of desired air content (mostly 2 %) 2. Determination of coarse aggregate volume 3. Determination of sand content
4. Design of paste composition
5. Determination of optimum water: powder ratio and super plasticizer dosage in mortar
6. Finally, the concrete properties are assessed by standard tests.
3.2 Particle Packing Density Mix Design
The mix design is carried Out Using Particle packing density approach method. The loose and roded bulk density of M - Sand and Coarse aggregates are evaluated separately. The following steps are adopted to calculate the design mix for further Work to Curry out.
1. Determination of packing density.
2. Estimation of voids Content and voids ratio. 3. Calculation of packing factor.
4. Evaluate the mass of the fine aggregate and coarse aggregate.
5. Determining the mass of total aggregates.
6. Finding out the required cement paste and by selected the W / C.
7. Estimation of cement content and also quantity of water required.
4.
RESULTS
AND
DISCUSSION
4.1 Slump Flow Test
The slump assessment carried out by varying the dosage of admixture is noted for each trial. The trial is stopped when the wet mix exhibits the required workability in term of slump flow.
Table 4.1 Slump Flow Test Result as per EFNARC and PPD
design W/C
ratio
Admixture dosage in
(%)
EFNARC Slump Spread Horizontal
in (mm)
PPD Slump Spread Horizontal
in (mm)
© 2019, IRJET | Impact Factor value: 7.211 | ISO 9001:2008 Certified Journal
| Page 4450
0.33 1.8 630 650
0.35 1.6 600 620
Value 600-800
Fig 1 Typical variation graph for Slump flow variation
Admixture Dosage
4.2 Funnel Test
[image:3.612.81.552.39.769.2]Conformation results of V funnel test for both mixes is tabulated below
Table 4.2 Result of V Funnel Test as per EFNARC design
W/C ratio
Admixture dosage in
(%)
V Funnel Tr flow
(sec)
Flow at T5(sec)
0.30 2 12 15
0.33 1.8 11 14
0.35 1.6 9 12
Value ≤ Tr+3
Table 4.3 Result of V Funnel Test as per PPD design
W/C ratio
Admixture dosage in
(%)
V Funnel Tr flow
(sec)
Flow at T5(sec)
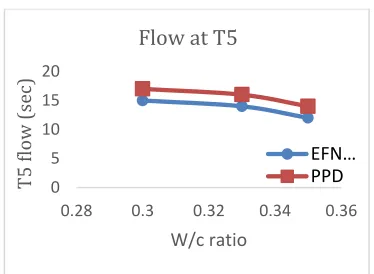
0.30 2 14 17
0.33 1.8 13 16
0.35 1.6 11 14
Value ≤ Tr+3
Fig 2 Typical variation graph for V Funnel flow Tr with
water cement ratio
Fig 3 Typical variation graph for V Funnel flow T5 with
water cement ratio
4.3 L Box Test
Conformation results of L box for the both mix is tabulated below
Table4.4 Result of L Box Test as per EFNARC and Particle
Packing Density design
W/C ratio
Admixture dosage in
(%)
EFNARC Blocking ratio
(H2/H1)
PPD Blocking
ratio (H2/H1)
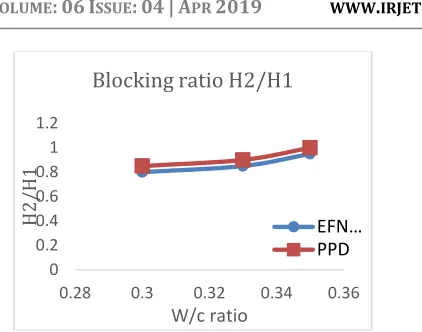
0.30 2 0.8 0.85
0.33 1.8 0.85 0.9
0.35 1.6 0.95 1
Value 0.80-1.0
560 580 600 620 640 660 680 700
1.6 1.8 2
Slu
m
p
f
lo
w
in
m
m
Adimixture Dosage
WORKABILITY COMPARISSION
EFNARC PPD
0 5 10 15
0.28 0.3 0.32 0.34 0.36
Tr
F
low
(
se
c)
W/c ratio
Tr
EFN… PPD
0 5 10 15 20
0.28 0.3 0.32 0.34 0.36
T5
flow
(
se
c)
W/c ratio
Flow at T5
[image:3.612.46.290.73.328.2] [image:3.612.354.541.265.402.2]© 2019, IRJET | Impact Factor value: 7.211 | ISO 9001:2008 Certified Journal
| Page 4451
Fig 4 Typical graph for L Box Blocking ratio at different
water cement ratio
4.5 J Ring Test
Conformation results of J ring test for both the mixes tabulated below
Table4.5 Result of J Ring Test as per PPD design
W/C ratio
Admixtur e dosage
in (%)
EFNARC Difference in
height (h1-h2) in mm
PPD Difference in
height (h1-h2) in mm
0.30 2 8 8
0.33 1.8 6 7
0.35 1.6 4 5
Value 0-10
Fig 5 Typical graph for J ring difference in height water
cement ratio.
4.6 Compressive strength
A compressive strength of these both concrete mix cubes are evaluated and strength is assessed after 7 days and 28 days of curing. The size of the test specimen is 150x150x 150mm cubes results are tabulated below.
[image:4.612.68.279.65.231.2]A. Compressive strength as per EFNARC design
Table 4.6 Compressive Strength of SSC
SL No No of days Testing
Compressive strength in
N/mm2
Average compressive
strength, N/mm2 01
07
30.66
31.19
02 31.82
03 31.11
01
28
41.77
42.41
02 42.88
03 42.75
[image:4.612.339.557.447.631.2]B. Compressive strength as per Particle Packing Density design
Table 4.7 Compressive Strength of SSC
SL No No of days Testing
Compressive strength in
N/mm2
Average compressive
strength, N/mm2 01
07
39.37
39.11
02 38.84
03 39.11
01
28
49.80
49.80
02 49.20
03 50.20
0
0.2 0.4 0.6 0.8 1 1.2
0.28 0.3 0.32 0.34 0.36
H2
/H1
W/c ratio
Blocking ratio H2/H1
EFN… PPD
0 2 4 6 8 10
0.28 0.3 0.32 0.34 0.36
Diff
er
en
vc
e
in
he
ight
(mm)
W/c ratio
Difference in height
© 2019, IRJET | Impact Factor value: 7.211 | ISO 9001:2008 Certified Journal
| Page 4452
Fig 6 Graph of Compressive Strength Comparison
4.7 Split tensile strength
A split tensile strength of these both concrete mix beams is evaluated and strength is assessed after 7 day and 28 days of curing. The size of the test specimen is 150mm diameter and 300mm height.
[image:5.612.307.580.74.283.2]A. Split tensile strength as per EFNARC design
Table 4.8 Tensile Strength of SSC
SL No No of days Testing
Tensile strength in
N/mm2
Average Tensile strength,
N/mm2 01
07
2.532
2.677
02 2.716
03 2.773
01
28
3.11
3.30
02 3.46
03 3.24
B. Split tensile strength ae per particle packing density design
Table 4.9 Tensile Strength of SSC
SL No No of days Testing
Tensile strength in N/mm2
Average Tensile strength, N/mm2 01
07
2.80
2.95
02 2.97
03 3.08
01
28
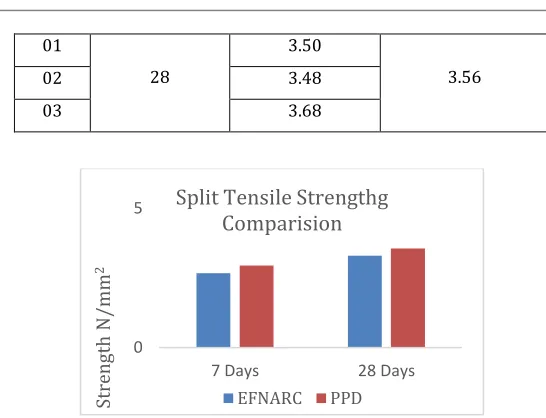
3.50
3.56
02 3.48
03 3.68
Fig 7 Graph of Split Tensile Strength Comparison
CONCLUSIONS
Compressive Strength: It has been observed that the compressive strength of SCC as per the EFNARC design and particle packing density at the end of 28 days is 42.41 N/mm2 and 49.80 N/mm2 respectively. Comparing the both mix design the higher strength is achieved by particle packing density method.
Split Tensile Strength: It has been observed that the split tensile strength of SCC as per the EFNARC design and particle packing density at the end of 28 days is 3.30 N/mm2 and 3.56 N/mm2 respectively. Comparing the both mix design the higher strength is achieved by particle packing density method.
From the investigation on rheology of SCC mixes, it may be concluded that the admixture dosage at which the flow properties could be achieved in general is nearly 1.6% to 2%, If the W/C ratio decreases the high dosage admixture is required to achieve workability. the result of particle packing density mix design is compared with the EFNARC 2005 specification guideline.
REFERENCES
[1] Heba A Mohammad, “Effect of fly ash and silica fume on compressive strength of Self compacting concrete under different curing conditions”, In Shams Engineering Journal, Vol. 2, pp 79-86, 2011.
[2] Neelam Pathak, Rafat Siddique “Properties of self-compacting concrete containing fly ash subjected to
0 5
7 Days 28 Days
Str
en
gth
N
/mm
2
Split Tensile Strengthg
Comparision
EFNARC PPD
0 50 100
7 Days 28 Days
Str
en
gth
N
/mm
2
Compressive strength
comparesion
[image:5.612.64.281.93.229.2]© 2019, IRJET | Impact Factor value: 7.211 | ISO 9001:2008 Certified Journal
| Page 4453
elevated temperature”, Construction and Building Materials,Vol.30pp 274-280,2012.
[3] Krishna Murthy N., Narsimha Rao A. V., Ramana Reddy I. V. and Vijay Sekhar Reddy M., “Mix Design procedure for self-compacting concrete”, IOSR Journal of Engineering, Vol.2 (9) pp 33-41, 2012.
[4] Dhiyaneshwaran.S, Ramanathan. P, Baskar. I and Venkata Subramani.” Study on durability characteristics of self compacting concrete containing fly-ash”. Journal of civil Engineering2013, Vol. 7, Issue 3, pp 342-353.
[5] Raharjo D., Subakti A. and Tavio. “Mixed concrete optimization using fly ash, silica fume and iron slag on the SCC’s compressive strength”, Procedia Engineering, Vol.54 pp 827-839, 2013.
[6] Krishna Murthy.N, Narasimha Rao A.V, Mix Design Procedure for Self Compacting Concrete, e-ISSN: 2250-3021, p-ISSN: 2278-8719, www.iosrjen.org Volume 2, Issue 9 (September 2012), PP 33-41.
[7] Dr. Hemant Sood, Dr.R.K.Khitoliya and S. S. Pathak, Incorporating European Standards for Testing Self Compacting Concrete in Indian Conditions, International Journal of Recent Trends in Engineering, Vol. 1, No. 6, May 2009.
[8] N R Gaywala D B Raijiwala,Self Compacting Concrete: A Concrete Of Next Decade, JERS/Vol. II/ Issue IV/October-December, 2011/213-218.
[9] Grdić, Zoran; Despotović, Iva and TopličićĆurčić, Gordana (2008). Properties of self- compacting concrete with different types of additives. Architecture and Civil Engineering. Volume 6, No. 2: 173-174.
[10] Yuan-Yuan Chen, Bui Le Anh Tuan and chao LungHwang., “Effect of paste amount on the properties of self-consolidating concrete containing flu ash and slag”, Construction and Building Materials, Vol. 47 pp 340-346, 2013.
[11] Ahmed Ibrahim, Enad Mahmud and Tarig Ali., “Investigation of relationships between high strength self-consolidating concrete compressive strength and macroscopic internal structure.” Construction and Building Materials, Vol.38 pp 1161-1169, 2013.
[12] A. Dinesh, S. Harini, J. P. Jasmine, J. Shagufta, “Experimental study on self compacting concrete”, International Journal of Engineering Sciences & Research Technology, vol. 6, 2017, pp. 42-50.