Original citation:
Krishna , M., Wallis , L. P. J., Wills, R.G.A., Hall , D. and Shah, A. A.. (2017) Measurement of key electrolyte properties for improved performance of the soluble lead flow battery. International Journal of Hydrogen Energy, 42 (29). pp. 18491-18498.
Permanent WRAP URL:
http://wrap.warwick.ac.uk/92607 Copyright and reuse:
The Warwick Research Archive Portal (WRAP) makes this work by researchers of the University of Warwick available open access under the following conditions. Copyright © and all moral rights to the version of the paper presented here belong to the individual author(s) and/or other copyright owners. To the extent reasonable and practicable the material made available in WRAP has been checked for eligibility before being made available.
Copies of full items can be used for personal research or study, educational, or not-for-profit purposes without prior permission or charge. Provided that the authors, title and full bibliographic details are credited, a hyperlink and/or URL is given for the original metadata page and the content is not changed in any way.
Publisher’s statement:
© 2017, Elsevier. Licensed under the Creative Commons Attribution-NonCommercial-NoDerivatives 4.0 International http://creativecommons.org/licenses/by-nc-nd/4.0/
A note on versions:
The version presented here may differ from the published version or, version of record, if you wish to cite this item you are advised to consult the publisher’s version. Please see the ‘permanent WRAP URL’ above for details on accessing the published version and note that access may require a subscription.
Measurement of Key Electrolyte Properties for Improved
Performance of the Soluble Lead Flow Battery
M. Krishna1, L.P.J. Wallis1, R.G.A. Wills1*, D. Hall2 and A.A. Shah3
1. Energy Technology Research Group, Faculty of Engineering and the Environment, University of Southampton, SO17 1BJ, UK
2. C-‐Tech Innovation Ltd., Capenhurst Technology Park, Chester, CH1 6EH, UK 3. University of Warwick, School of Engineering, Coventry, CV4 7AL, UK
Abstract:
The soluble lead flow battery utilises the Pb/Pb2+ and Pb2+/Pb4+ redox couples. The electrolyte is methanesulfonic acid, in which Pb2+ species are soluble, up to 2.6 mol
dm-‐3. Previous publications have presented data demonstrating differing
performances for the electrode and cell reactions. In this paper, electrolyte properties including density, viscosity, ionic conductivity and species concentration are systematically investigated to identify their impact on the efficiency and cycle life of a soluble lead cell under static conditions. The relationship between ionic conductivity and species concentration (Pb2+ and methanesulfonic acid) in the starting electrolyte is shown to be key to cell performance. An electrolyte initially containing 0.7 mol dm-‐3 Pb(CH
3SO3)2 & 1.0 mol dm-‐3 CH3SO3H is shown to provide
optimal electrochemical performance for the soluble lead cell, achieving charge and voltage efficiencies of greater than 80% and 70% respectively along with Pb2+
utilisation of over 80%.
Key words: Soluble lead, Methanesulfonic acid, Flow battery
Corresponding Author:
Dr Richard Wills (rgaw@soton.ac.uk)
University of Southampton, Faculty of Engineering and the Environment, Highfield, Southampton, SO17 1BJ, UK
1. Introduction
Flow batteries are a form of electrochemical device that store energy via redox changes in the electrolyte. Flow cells are stacked together to create a battery, where the power is a function of the electrode dimensions and the number of cells present, and the energy capacity is a function of the overall electrolyte volume and concentration of the active species. These systems are therefore easily scaled, from kWs & kWhs to MWs & MWhs and have shown long operational life and high efficiency for a multitude of applications such as renewables capacity firming and grid-‐scale load-‐levelling, making them a popular area for research. Many types and chemistries exist, from hydrogen-‐based systems at an early stage of development [1, 2] , to more advanced systems such as the all-‐vanadium redox flow battery (VRFB), which have previously been reviewed [3].
The soluble lead flow battery (SLFB) is a hybrid flow battery that utilises Pb2+ ions
solvated as the Pb(CH3SO3)2 complex in an aqeuous methanesulfonic acid, CH3SO3H,
(MSA) electrolyte. The industrial scale of reprocessing/recycling conventional lead acid batteries provides the SLFB with an established, low-‐cost material supply chain compared to other flow battery chemistries where the electrolyte synthesis can be more complex, such as in the VRFB [4]. On charge, lead is deposited onto the negative electrode and lead dioxide is deposited onto the positive electrode. This process is reversed on discharge, with the deposits electrochemically dissolving back into the solution. MSA is a stable acid that has a relatively low toxicity and is regarded as biodegradable by the OECD. It also offers a high solubility of Pb2+ compared to other contemporary acids whilst also providing a high conductivity [5]. The cell equations are as follows, where the forward reaction represents charge charging, while the reverse reaction represents discharging:
1) 𝑃𝑏!!+2𝑒! ⇌ 𝑃𝑏 −𝑣𝑒 𝑒𝑙𝑒𝑐𝑡𝑟𝑜𝑑𝑒 2) 𝑃𝑏!!+2𝐻
!𝑂 ⇌ 𝑃𝑏𝑂!+4𝐻! + 2𝑒! +𝑣𝑒 𝑒𝑙𝑒𝑐𝑡𝑟𝑜𝑑𝑒
3) 2𝑃𝑏!!+2𝐻
!𝑂 ⇌ 𝑃𝑏+𝑃𝑏𝑂!+4𝐻! 𝑂𝑣𝑒𝑟𝑎𝑙𝑙
Studies of the system have previously been reported detailing the effect of operating conditions such as current density, state of charge, electrolyte flow rate and temperature on cell performance [6-‐8]. Currently, the main operational challenge to further development of the SLFB is the improper dissolution of both the electrode deposits on discharge. The slow accumulation of deposits at the electrodes depletes the solution of Pb2+, leading to mass transport limited phenomena on charge and ultimately to electrical shorting between the electrodes. Lead dendrites, accumulation of active material and lead dioxide creep across non-‐conducting internal flow manifolds are the common failure mechanisms [9]. Important parameters affecting cell performance are the initial Pb2+ and MSA concentrations,
followed by the current density, temperature and additive concentration. Typically in industry, a lead plating bath uses 200 g dm-‐3 (0.97 mol dm-‐3) of lead and 100 g dm-‐3
(1.0 mol dm-‐3) of MSA, and deposition occurs at 30-‐60 mA cm-‐2 between 293-‐303 K
with the use of organic additives whereas lead dioxide coatings are produced from nitrate solutions [10] rather than MSA.
Electrolytes containing 0.1–1.5 mol dm-‐3 Pb(CH
3SO3)2 and 0–2.4 mol dm-‐3 MSA have
been studied, along with current densities of up to 100 mA cm-‐2 and temperatures between 283–333 K. The effect of these conditions on the deposit morphology has been analysed using SEM and XRD studies. 0.3–0.5 mol dm-‐3 Pb(CH
3SO3)2 & low MSA
concentrations, and low current densities produced the smoothest, most compact lead deposits [11, 12]. Higher concentrations of Pb(CH3SO3)2 and lower
concentrations of MSA were required for good PbO2 deposits, with the current
density not having as much of an effect [13-‐15]. Furthermore, the hexadecyltrimethylammonium (HDTMA) cation surfactant was found to greatly improve the lead deposit at higher concentrations of Pb(CH3SO3)2, which a realistic
SLFB electrolyte is likely to contain, as 0.3–0.5 mol dm-‐3 does not offer a feasible energy storage capacity.
affecting the cell performance [16]. Using a novel cell design, Oury et al. achieved 100 cycles at 95% charge and 75% voltage efficiencies, using a 1.0 mol dm-‐3 Pb(CH3SO3)2 & 0.25 mol dm-‐3 MSA initial electrolyte, which also contained 5 mmol
dm-‐3 HDTMA and 60 mmol dm-‐3 NaF [17]. The fluoride additive was inspired from the
lead dioxide coatings industry in order to improve the adhesion of PbO2 to the
substrate [18].
A proof-‐of-‐concept study was conducted by Verde et al. and achieved 2000 cycles at 95% charge and 79% voltage efficiencies using a 0.7 mol dm-‐3 Pb(CH
3SO3)2 and 1.0
mol dm-‐3 MSA initial electrolyte, albeit on a small scale that is unrepresentative of
flow cell conditions [19]. The largest study, in which a cell with 100 cm2 electrodes was used, was conducted by Wills et al. and achieved >100 cycles at <90% charge and <80% voltage efficiencies using a 1.5 mol dm-‐3 Pb(CH
3SO3)2 and 1.0 mol dm-‐3
MSA initial electrolyte, with 1 g dm-‐3 of lignosulfonic acid [9].
The literature contains much work on the effect of operating conditions, electrolyte compositions and additives on cell performance, along with further long-‐term battery cycling studies [20, 21]. The research has indicated that the SLFB is capable of continuous, long-‐term operation at high efficiency, making it suitable for scale-‐up. However, the literature is lacking when it comes to the physical properties of the electrolyte. As one mole of Pb2+ is deposited, two moles of H+ are released into the solution, which can be seen in Equation 3. This implies that during operation, the electrolyte density, viscosity and conductivity are constantly changing. This will greatly influence the overall cell performance and the pressure drop through the flow circuit, affecting the pump work required to maintain a stable flow rate. It is clear that these changing conditions must be understood in order to apply techniques to maximise energy efficiency and cell longevity. The data presented in this paper includes fundamental studies showing the relationship between electrolyte composition, density, viscosity along with conductivity and the electrochemical performance of the soluble lead cell.
2. Experimental section
All solutions were prepared using lead(II) methanesulfonate solution, 50% wt. in water (Sigma Aldrich, #462667), methanesulfonic acid (MSA) >99.5% wt. in water (Sigma Aldrich, #471356), and deionised water from a Purite Ondeo 15 purifier. The chemicals were used as received from the manufacturer. Following formation, each batch of electrolyte was allowed to equilibrate to room temperature (296 K) for a minimum of 12 hours.
The density of an electrolyte sample was calculated by measuring 100 cm3 of the
sample in a volumetric flask and then measuring its mass on a digital balance. An Ostwald viscometer, calibrated to a constant value of 0.009236 (mm2 s-‐1)s-‐1, was used to measure the kinematic viscosity, ν, of the electrolytes at room temperature, 296 K. Each sample was tested twice and the average recorded. The absolute viscosity of the electrolyte sample was then calculated by multiplying the kinematic viscosity with the density.
The electrolyte conductivity was measured using an Analytical Technology ATI Orion 162 (Pt electrode) conductivity meter. This device was calibrated using a high purity 1.0 mol dm-‐3 KCl solution (Fisher Scientific, #10417460) prepared in the lab to give a
reading of 108.6 mS cm-‐1 at 298 K and 137.8 mS cm-‐1 at 313 K [22]. Temperatures
were maintained using a Grant LTD6G water bath.
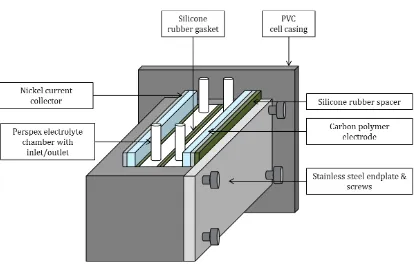
A parallel plate, soluble lead static-‐electrolyte cell with an active electrode area of 9 cm2 (4.5 cm length x 2 cm height) was used for galvanostatic cycling. The main frame was made from PVC and two 7 cm x 7 cm x 0.2 cm carbon polyvinyl-‐ester electrodes (BMC 18649, Entegris GmBH) were employed, separated by silicone rubber gaskets and two Perspex electrolyte chambers. A steel endplate and silicone rubber spacers provided the necessary compression to prevent leaks. Under full compression, the inter-‐electrode gap equalled 2 cm and the overall internal volume was 18 cm3. The cell schematic is shown in Figure 1.
Figure 1: Design of the soluble lead static-‐electrolyte cell with an active electrode area of 9 cm2.
[image:7.595.91.505.296.561.2]
acetone. The cell was dismantled, cleaned and rinsed in deionised water before being dried and reassembled for the next experiment. All cycling experiments took place at room temperature, 296 K.
3. Results and Discussion
3.1 Electrolyte density and viscosity: The density of the electrolyte as a function of MSA and Pb2+ concentration was determined. It should be noted that Pb2+ was present as the methanesulfonate complex, Pb(CH3SO3)2, with concentrations
calculated assuming no free acid contribution from the Sigma Aldrich Pb(CH3SO3)2
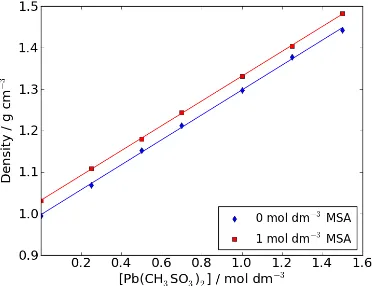
feedstock. Figure 2 presents a plot of density against [Pb(CH3SO3)2] for zero and 1.0
mol dm-‐3 MSA containing aqueous solutions. The density difference between the
two MSA concentrations is relatively small (circa 0.03 g cm-‐3) and constant as a
function of Pb(CH3SO3)2 concentration. With increasing Pb(CH3SO3)2 concentration,
density increases linearly. Without free acid in the solution, the density increases from 1.0 g cm-‐3 at zero Pb(CH
3SO3)2 concentration (pure water) to 1.44 g cm-‐3 at 1.5
mol dm-‐3 Pb(CH
3SO3)2. With 1.0 mol dm-‐3 MSA, the density increases from 1.03 g cm-‐ 3 to 1.48 g cm-‐3 across the same Pb(CH
3SO3)2 concentration range.
Figure 2: Electrolyte density as a function of Pb(CH3SO3)2 concentration at zero and 1.0 mol dm-‐3 CH3SO3H (296 K).
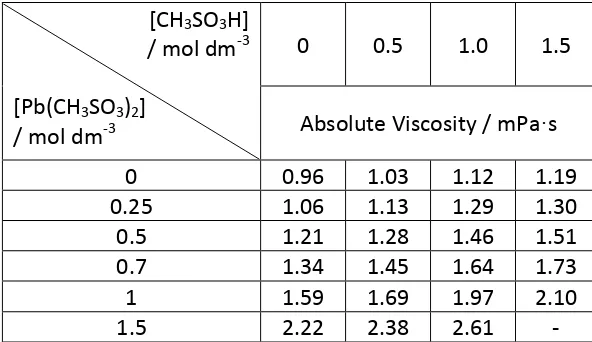
Viscosity was determined using an Ostwald viscometer for electrolyte solutions as a function of [Pb(CH3SO3)2] and [MSA]. Table 1 reports the viscosities for solutions
ranging in species concentration from zero to 1.5 mol dm-‐3. As with density, Pb2+
concentration has the dominant effect on viscosity, with values increasing by 130% as the Pb(CH3SO3)2 concentration is increased from zero to 1.5 mol dm-‐3 whilst the
MSA concentration is kept constant. In contrast, the viscosity increases by between 0.2 mPa·s ([Pb(CH3SO3)2] = zero) and 0.5 mPa·s ([Pb(CH3SO3)2] = 1.0 mol dm-‐3) as the
MSA concentration is varied from zero to 1.5 mol dm-‐3, an increase of just 25% and
32% respectively. During discharge of the soluble lead cell, the MSA concentration
decreases at twice the rate of the increase in Pb(CH3SO3)2 concentration. Despite
[image:9.595.101.473.97.383.2]1.5 mol dm-‐3 Pb(CH3SO3)2 and 1.5 mol dm-‐3 MSA as the solubility limit of Pb(CH3SO3)2
is exceeded.
Table 1: Electrolyte absolute viscosity as a function of Pb(CH3SO3)2 and MSA concentration, measured using an Ostwald viscometer (296 K).
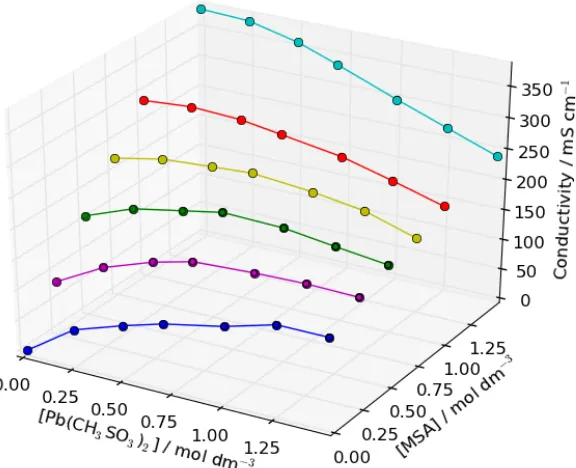
3.2 Electrolyte conductivity: A matrix of electrolyte solutions were prepared, varying the Pb(CH3SO3)2 and MSA concentrations between zero and 1.5 mol dm-‐3. The ionic
conductivity of these solutions is plotted in Figure 3. Unlike the density and viscosity measurements, there is a non-‐trivial component to the relationship between electrolyte composition and ionic conductivity. The conductivity increases with increasing MSA concentration at each specific Pb(CH3SO3)2 concentration; however,
as a function of [Pb(CH3SO3)2] the conductivity follows a different relationship. At
MSA concentrations ≤0.25 mol dm-‐3, the conductivity increases with Pb(CH3SO3)2
concentration. At MSA concentrations ≥1.0 mol dm-‐3 the conductivity decreases with
increasing Pb(CH3SO3)2 concentration. Between MSA concentrations of 0.25 and 1.0
mol dm-‐3, the electrolyte conductivity peaks at approximately 0.75 mol dm-‐3 Pb(CH3SO3)2. This behaviour is likely due to the complexing behaviour of the
methanesulfonate anion to the Pb2+ cation and changes in the overall solution viscosity.
[CH3SO3H]
/ mol dm-‐3
[Pb(CH3SO3)2]
/ mol dm-‐3
0 0.5 1.0 1.5
Absolute Viscosity / mPa·s
[image:10.595.162.458.130.301.2]
Figure 3: Electrolyte conductivity as a function of Pb(CH3SO3)2 & CH3SO3H concentrations (298 K). Measured using an Analytical Technology ATI Orion 162 (Pt
electrode) conductivity meter.
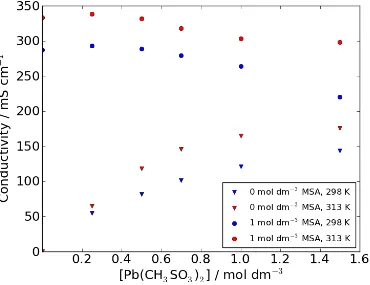
Figure 4 illustrates the influence of temperature on the electrolyte conductivity. The plot shows conductivity vs. Pb(CH3SO3)2 concentration for zero and 1.0 mol dm-‐3
MSA at 298 and 313 K. With both free acid concentrations, increasing the temperature increases the conductivity of the solution as expected. The plot further highlights that with an initial MSA concentration of 1.0 mol dm-‐3 in the electrolyte,
the conductivity decreases with increasing Pb(CH3SO3)2 concentration, whereas with
zero MSA in the electrolyte the conductivity increases with increasing Pb(CH3SO3)2
[image:11.595.176.464.119.353.2]
Figure 4: Electrolyte conductivity as a function Pb(CH3SO3)2 & CH3SO3H concentration and temperature. Measured using an Analytical Technology ATI
Orion 162 (Pt electrode) conductivity meter.
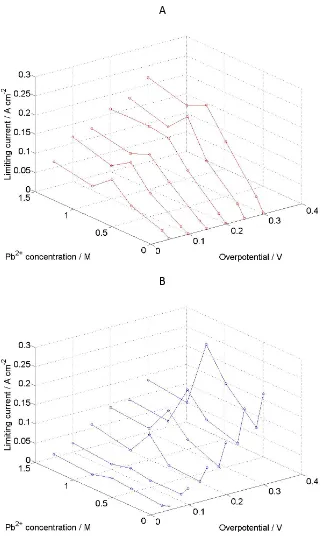
3.3 Limiting Current: Potentiostatic controlled deposition and stripping of lead and lead dioxide was carried out in a half-‐cell. Each experiment consisted of applying a deposition potential allowing the current response to stabilise to a limiting current before a stripping potential was applied and the resulting limiting current measured. The electrolyte was unstirred. Figure 5 presents a plot of the limiting currents obtained for a series of Pb(CH3SO3)2 concentrations and applied overpotentials,
where (A) corresponds to Pb deposition and (B) corresponds to Pb dissolution. With increasing overpotential the current associated with Pb deposition generally increases, although, with very low Pb(CH3SO3)2 concentrations the current increase
is small or negligible, indicating that the reaction is likely to be mass transport limited. The current increase as a function of increasing Pb(CH3SO3)2 concentration,
however, follows a non-‐trivial relationship. There is a general increase in current with increasing Pb(CH3SO3)2 concentration, however, there is a peak between 0.5
and 1.0 mol dm-‐3 Pb(CH
[image:12.595.99.469.97.382.2]overpotentials and correlates with the peak conductivity at 0.75 mol dm-‐3 Pb(CH3SO3)2 that was observed with free MSA concentrations between 0.5 and 1.0
mol dm-‐3 (Figure 3).
A
B
Figure 5: Limiting currents as a function of applied overpotential and electrolyte composition. Potentials range from -‐0.78 to -‐0.18 V vs. SCE. [Pb(CH3SO3)2] ranges
[image:13.595.135.456.150.693.2]During Pb dissolution (Figure 5B), a similar result is observed, with the peak in current at 0.75 mol dm-‐3 Pb(CH3SO3)2 being even more prominent. There is also an
increase in current at very low Pb concentrations, which could indicate that there is some degree of chemical dissolution (self-‐discharge).
A
B
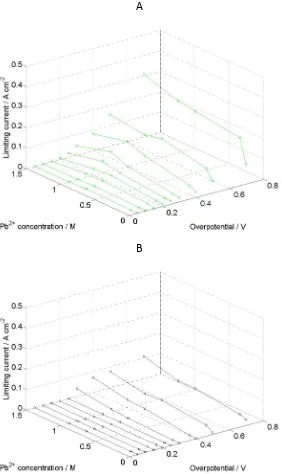
Figure 6: Limiting currents as a function of applied overpotential and electrolyte composition. Potentials range from 0.80 to 2.20 V vs. SCE. [Pb(CH3SO3)2] ranges from 0.01 mol dm-‐3 to 1.5 mol dm-‐3 in aqueous MSA (1.0 mol dm-‐3) with 10 mmol dm-‐3 Bi3+. (296 K). (A) corresponds to lead dioxide deposition and (B) corresponds
to lead dioxide dissolution
[image:14.595.158.440.161.635.2]Figure 6 presents similar data for the PbO2 deposition and dissolution reactions.
While the currents are considerably lower than for Pb deposition and dissolution, due to the high overpotentials associated with the Pb2+/Pb4+ couple, a similar peak at circa 0.75 mol dm-‐3 Pb(CH3SO3)2 can still be observed.
3.4 Cell Efficiency: A static electrolyte, parallel plate cell was used to assess the electrochemical efficiency of the soluble lead system. The static cells were filled with 18 cm3 of electrolyte for galvanostatic charge/discharge cycling. Each cycle comprised a charge period of fifteen minutes at 15 mA cm-‐2 followed by an open
circuit rest period of three minutes. Discharge then took place at 15 mA cm-‐2 for a
maximum of 15 minutes or until the cell voltage dropped below 0.3 V. A further three-‐minute open circuit rest period followed before commencing the subsequent cycle. A full cycle (i.e. 100% charge efficiency) could last for a maximum of 36 minutes. Each cell was cycled until failure, which was the cycle at which the charge efficiency dropped below 70%. The cycles achieved are a function of charge efficiency and initial [Pb(CH3SO3)2]. High charge efficiency implies a low rate of
depletion of Pb2+ from the solution, and depletion is delayed if there are greater Pb2+
ions initially.
The static system utilises a much-‐reduced volume of electrolyte compared to flowing electrolyte systems. This exaggerates the failure mechanisms associated with Pb2+ depletion from the electrolyte (sludging and incomplete dissolution of electrode deposits) and mass transport effects (dendrite growth). As a result, static-‐electrolyte cells have a shorter cycle life compared to flowing electrolyte systems with comparable electrode area and initial electrolyte composition [23]. This allows rapid screening of different electrolyte compositions, whilst providing an indication of how the system would perform using a flowing electrolyte as improved Pb2+ utilisation, increased reaction efficiency and more compact deposits are beneficial in both static and flowing electrolytes. Sixteen tests were carried out overall, with MSA concentrations ranging from 0.25 to 1.0 mol dm-‐3 and Pb(CH3SO3)2 concentrations
be impractical for cell operation. No additives were used in these tests. The number of cycles achieved before failure of each test is displayed in Figure 7.
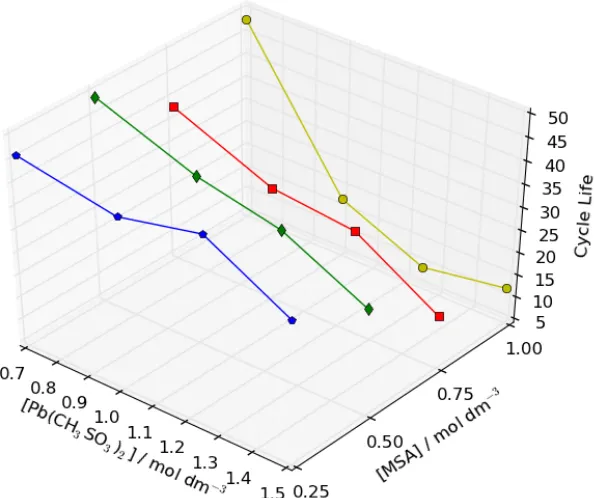
Figure 7: Cell cycle life as a function of Pb(CH3SO3)2 & MSA concentration within a soluble lead static-‐electrolyte cell with an active electrode area of 9 cm2 under galvanostatic charge/discharge conditions. In each cycle the cell was charged for 15
mins at 15 mA cm-‐2 before discharge at the same current density. A 3 minute rest phase in between the charge/discharge and discharge/charge phases (296 K).
The cycle life generally degrades when increasing [Pb(CH3SO3)2] and decreases at a
far greater rate when increasing [MSA]. E.g. 46 and 36 cycles are achieved at 0.7 and 1.5 mol dm-‐3 Pb(CH
3SO3)2 respectively when using 0.25 mol dm-‐3 MSA. However, 48
and only 12 cycles are achieved at 0.7 and 1.5 mol dm-‐3 Pb(CH3SO3)2 respectively
when using 1.0 mol dm-‐3 MSA. At low [Pb(CH
3SO3)2] (i.e. 0.7 mol dm-‐3), the cycle life
[image:16.595.173.470.153.402.2]
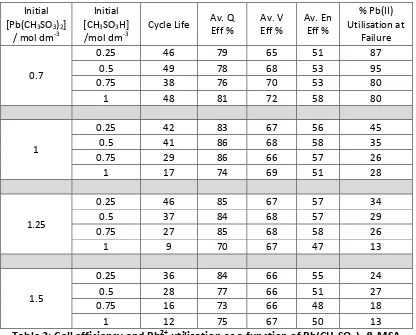
Table 2 presents further performance metrics, i.e. charge, voltage and energy efficiencies averaged across the number of cycles before failure, and the percentage of Pb2+ utilisation (% removed from the electrolyte and deposited at the electrodes) at the failure point. The latter was calculated using Faraday’s Laws, assuming that no parasitic reactions, such as O2 or H2 evolution, occurred and that any imbalance
between charge and discharge resulted in the build-‐up of deposits at both electrodes [1, 3]. This measure provides an indication of the depth of discharge that the initial electrolyte composition can achieve before failure modes, such as Pb dendrite formation, PbO2 sludging or PbO2 creep prevent cell cycling [5]. A high percentage
utilisation is beneficial as it indicates that the battery is able to operate effectively at low Pb2+ concentrations, in other words maximising the use of Pb2+ initially
contained in the electrolyte.
Initial [Pb(CH3SO3)2]
/ mol dm-‐3
Initial [CH3SO3H]
/mol dm-‐3 Cycle Life
Av. Q
Eff % Av. V Eff % Av. En Eff %
% Pb(II) Utilisation at
Failure
0.7
0.25 46 79 65 51 87 0.5 49 78 68 53 95 0.75 38 76 70 53 80
1 48 81 72 58 80
1
0.25 42 83 67 56 45 0.5 41 86 68 58 35 0.75 29 86 66 57 26
1 17 74 69 51 28
1.25
0.25 46 85 67 57 34 0.5 37 84 68 57 29 0.75 27 85 68 58 26
1 9 70 67 47 13
1.5
0.25 36 84 66 55 24 0.5 28 77 66 51 27 0.75 16 73 66 48 18
1 12 75 67 50 13
[image:17.595.91.507.370.705.2]discharge at the same current density. A 3 minute rest phase was applied in between the charge/discharge and discharge/charge phases (296 K).
The average charge efficiency remained high throughout each test, peaking at 86% in the 1.0 mol dm-‐3 Pb(CH3SO3)2 & 0.5–0.75 mol dm-‐3 MSA tests. Despite the
expected high ionic loss across the wide inter-‐electrode gap, the average voltage efficiency throughout each test was reasonably high, peaking at 72% in the 0.7 mol dm-‐3 Pb(CH3SO3)2 & 1.0 mol dm-‐3 MSA test. At ≤1.0 mol dm-‐3 Pb(CH3SO3)2, the voltage
efficiency slightly improved with increasing [MSA]. At higher [Pb(CH3SO3)2], the
voltage efficiency was approximately consistent (66–68%), irrespective of [MSA]. This is likely an effect of the electrolyte conductivity. As discussed earlier, at lower [Pb(CH3SO3)2], conductivity increases at a greater rate when increasing [MSA] than at
higher [Pb(CH3SO3)2]. The average energy efficiency increases from 51% to 58%
between 0.25 to 1.0 mol dm-‐3 MSA at 0.7 mol dm-‐3 Pb(CH
3SO3)2. At ≥1.0 mol dm-‐3
Pb(CH3SO3)2, there is a decline in energy efficiency with increasing [MSA]. The
voltage, charge and energy efficiency along with cycle life of cells utilising an electrolyte initially containing 1.5 mol dm-‐3 Pb2+ in aqueous MSA (1.0 mol dm-‐3) are
comparable with previously reported static-‐electrolyte cells using this electrolyte composition [19].
Furthermore, a greater amount of Pb2+ is utilised before failure at lower [Pb(CH3SO3)2] and [MSA]. 95% of Pb2+ in the electrolyte was deposited before failure
in the 0.7 mol dm-‐3 Pb(CH3SO3)2 & 0.5 mol dm-‐3 MSA test, whereas just 13% of the
solvated Pb2+ was deposited in the 1.25–1.5 mol dm-‐3 Pb(CH3SO3)2 & 1.0 mol dm-‐3
MSA tests.
The deposition/dissolution limiting current densities and cell galvanostatic cycling data indicate that an initial electrolyte composition of 0.7 mol dm-‐3 Pb(CH3SO3)2 &
1.0 mol dm-‐3 MSA would provide optimal electrochemical performance for the
soluble lead cell. It is also likely that this composition provides a good compromise between solution conductivity and viscosity.
4. Conclusion
The properties of density, viscosity and conductivity have been investigated as a function of [MSA] and [Pb(CH3SO3)2] over an electrolyte concentration range
designed for the soluble lead flow cell. The density follows a linear relationship, increasing between zero and 1.5 mol dm-‐3 Pb(CH
3SO3)2. Viscosity also follows a
simple relationship, increasing with both free MSA and Pb(CH3SO3)2 concentrations.
Conductivity however was found to follow a non-‐trivial relationship: at [MSA] ≥1.0 mol dm-‐3, the conductivity decreases with [Pb(CH
3SO3)2] while at [MSA] ≤0.25 mol
dm-‐3 the conductivity increases with increasing [Pb(CH3SO3)2]. Between 0.25 and 1.0
mol dm-‐3 MSA, the conductivity peaks at 0.75 mol dm-‐3 Pb(CH
3SO3)2.
In half-‐cell experiments, the current density associated with the deposition and dissolution of Pb and PbO2 was also found to go through a peak between 0.7 and 0.8
mol dm-‐3 Pb(CH
3SO3)2. Static electrolyte cell measurements confirmed that an initial
electrolyte composition of 0.7 mol dm-‐3 Pb(CH
3SO3)2 & 1.0 mol dm-‐3 MSA would
provide optimal electrochemical performance for the soluble lead cell in terms of cycle life, energy efficiency and Pb2+ utilisation. Similar efficiencies and cycle lives
were also measured when using 1.0–1.25 mol dm-‐3 [Pb(CH
3SO3)2] & 0.25–0.5 mol
dm-‐3 MSA but the Pb2+ utilisation was considerably lower, i.e. just 34% in the 1.25 mol dm-‐3 Pb(CH
3SO3)2 and 0.25 mol dm-‐3 MSA test. If more of the remaining 66% of
Pb2+ could be utilised whilst maintaining the charge efficiency above 70%, then the
cycle life will be increased and a higher energy storage capacity will become available. This could be attained by the use of a flowing electrolyte or various additives.
5. Acknowledgements
6. References
[1] Oh K, Weber AZ, Ju H. Study of bromine species crossover in H2/Br2 redox flow batteries. International Journal of Hydrogen Energy. 2017;42:3753-‐66. [2] Sáez A, Montiel V, Aldaz A. An Acid-‐Base Electrochemical Flow Battery as energy storage system. International Journal of Hydrogen Energy. 2016;41:17801-‐6.
[3] Ponce de León C, Frías-‐Ferrer A, González-‐García J, Szánto DA, Walsh FC. Redox flow cells for energy conversion. Journal of Power Sources. 2006;160:716-‐ 32.
[4] Dassisti M, Cozzolino G, Chimienti M, Rizzuti A, Mastrorilli P, L'Abbate P. Sustainability of vanadium redox-‐flow batteries: Benchmarking electrolyte synthesis procedures. International Journal of Hydrogen Energy. 2016;41:16477-‐88.
[5] D. Gernon M, Wu M, Buszta T, Janney P. Environmental benefits of methanesulfonic acid . Comparative properties and advantages. Green Chemistry. 1999;1:127-‐40.
[6] Pletcher D, Wills R. A novel flow battery: A lead acid battery based on an electrolyte with soluble lead(II) Part III. The influence of conditions on battery performance. Journal of Power Sources. 2005;149:96-‐102.
[7] Pletcher D, Wills R. A novel flow battery: A lead acid battery based on an electrolyte with soluble lead(ii) Part II. Flow cell studies. Physical Chemistry Chemical Physics. 2004;6:1779-‐85.
[8] Hazza A, Pletcher D, Wills R. A novel flow battery: A lead acid battery based on an electrolyte with soluble lead(ii) Part I. Preliminary studies. Physical Chemistry Chemical Physics. 2004;6:1773-‐8.
[9] Wills RGA, Collins J, Stratton-‐Campbell D, Low CTJ, Pletcher D, Walsh F. Developments in the soluble lead-‐acid flow battery. J Appl Electrochem. 2010;40:955-‐65.
[10] Schlesinger M, Paunovic M. Modern electroplating: John Wiley & Sons; 2011. [11] Hazza A, Pletcher D, Wills R. A novel flow battery: A lead acid battery based on an electrolyte with soluble lead(II) Part IV. The influence of additives. Journal of Power Sources. 2005;149:103-‐11.
[12] Pletcher D, Zhou H, Kear G, Low CTJ, Walsh FC, Wills RGA. A novel flow battery: A lead-‐acid battery based on an electrolyte with soluble lead(II) Part V. Studies of the lead negative electrode. Journal of Power Sources. 2008;180:621-‐ 9.
[13] Sirés I, Low C, Ponce-‐de-‐León C, Walsh F. The characterisation of PbO 2-‐ coated electrodes prepared from aqueous methanesulfonic acid under controlled deposition conditions. Electrochimica Acta. 2010;55:2163-‐72.
[14] Li X, Pletcher D, Walsh FC. A novel flow battery: A lead acid battery based on an electrolyte with soluble lead(II) Part VII. Further studies of the lead dioxide positive electrode. Electrochimica Acta. 2009;54:4688-‐95.
[16] Oury A, Kirchev A, Bultel Y, Chainet E. PbO2/Pb2+ cycling in methanesulfonic acid and mechanisms associated for soluble lead-‐acid flow battery applications. Electrochimica Acta. 2012;71:140-‐9.
[17] Oury A, Kirchev A, Bultel Y. Cycling of soluble lead flow cells comprising a honeycomb-‐shaped positive electrode. Journal of Power Sources. 2014;264:22-‐9. [18] Li X, Pletcher D, Walsh FC. Electrodeposited lead dioxide coatings. Chemical Society Reviews. 2011;40:3879-‐94.
[19] Verde MG, Carroll KJ, Wang Z, Sathrum A, Meng YS. Achieving high efficiency and cyclability in inexpensive soluble lead flow batteries. Energy & Environmental Science. 2013;6:1573-‐81.
[20] Collins J, Kear G, Li X, Low CTJ, Pletcher D, Tangirala R, et al. A novel flow battery: A lead acid battery based on an electrolyte with soluble lead(II) Part VIII. The cycling of a 10 cm×10cm flow cell. Journal of Power Sources. 2010;195:1731-‐8.
[21] Collins J, Li X, Pletcher D, Tangirala R, Stratton-‐Campbell D, Walsh FC, et al. A novel flow battery: A lead acid battery based on an electrolyte with soluble lead(II) Part IX: Electrode and electrolyte conditioning with hydrogen peroxide. Journal of Power Sources. 2010;195:2975-‐8.
[22] Feng D, Holland L. A dc Method for the Absolute Determination of Conductivities of the Primary Standard KCl Solutions from 0^ C to 50" C. Journal of Research of the National Institute of Standards and Technology. 1994;99. [23] Wallis LPJ, Wills RGA. Membrane divided soluble lead battery utilising a bismuth electrolyte additive. Journal of Power Sources. 2014;247:799-‐806.