ISSN Online: 2165-3860 ISSN Print: 2165-3852
DOI: 10.4236/ojfd.2018.82013 Jun. 29, 2018 181 Open Journal of Fluid Dynamics
Performance and Internal Flow of
Contra-Rotating Small-Sized Cooling Fan
Toru Shigemitsu
1, Keisuke Miyazaki
2, Katsuhiko Hirosawa
2, Hiroaki Fukuda
21Institute of Science and Technology, Tokushima University, Tokushima, Japan
2Graduate School of Advanced Technology and Science, Tokushima University, Tokushima, Japan
Abstract
High pressure and large flow rate small-sized cooling fans are used for servers in data centers and there is a strong demand to increase its performance be-cause of increase of quantity of heat from servers. Contra-rotating rotors have been adopted for some of high pressure and large flow rate cooling fans to meet the demand. The performance curve of the contra-rotating small-sized cooling fan with 40 mm square casing was investigated by an experimental apparatus and its internal flow condition was clarified by the numerical analy-sis. The fan static pressure of the front rotor was extremely low and it in-creased significantly at the rear rotor. The uniform flow was achieved at the inlet of the rear rotor because of the special shape of the casing between the front and rear rotors. On the other hand, the tip leakage flow was large enough to influence on the main flow of the test cooling fan by the design specification of high pressure with compact rotor diameter.
Keywords
Cooling Fan, Small-Sized Axial Fan, Contra-Rotating Rotors, Performance, Internal Flow
1. Introduction
Data center has been built because of spread of cloud computing, establishment of ubiquitous networking society and increase of electric parts in machines. Then, power consumption in data centers, IT devices and machines has been in-creasing significantly [1]. Electrical power used for cooling of IT devices for data centers is as huge as that used for IT devices itself in data centers and the electric power consumption of it is growing rapidly. In the point of view of global warming and energy savings, there is a strong demand for reduction of power How to cite this paper: Shigemitsu, T.,
Miyazaki, K., Hirosawa, K. and Fukuda, H. (2018) Performance and Internal Flow of Contra-Rotating Small-Sized Cooling Fan. Open Journal of Fluid Dynamics, 8, 181-194.
https://doi.org/10.4236/ojfd.2018.82013
Received: May 2, 2018 Accepted: June 26, 2018 Published: June 29, 2018
Copyright © 2018 by authors and Scientific Research Publishing Inc. This work is licensed under the Creative Commons Attribution International License (CC BY 4.0).
DOI: 10.4236/ojfd.2018.82013 182 Open Journal of Fluid Dynamics consumption in above facilities and equipments [2]. Axial fans are used as cool-ing fans of servers and desk top computers. Then, researches of axial fans on fan noise and effect of inlet geometry were conducted [3] [4]. High pressure and large flow rate small-sized cooling fans are used for servers in data centers and there is a strong demand to increase its pressure and flow rate because of in-crease of quantity of heat from servers. The inin-crease of the pressure and flow rate by increase of a fan diameter is restricted because of limitation of space. Therefore, high rotational speed design is conducted, and rotational speed over 10,000 min−1 is employed for cooling fans of servers. Contra-rotating rotors have
been adopted for some of high pressure and large flow rate cooling fans to meet its demand. On the other hand, low rotational speed design [5] and advantages on the performance of contra-rotating fans and pumps were verified by experi-mental results [6] [7] [8].
The company’s research and development period for the contra-rotating small-sized cooling fan is short and its internal flow condition is not clarified well. Therefore, the performance of each front and rear rotor and internal flow condition were investigated by the numerical analysis with the simple numerical model without the spokes [9] [10]. In the case of the contra-rotating rotors, it is necessary to design the rear rotor considering the unsteady circumferential ve-locity distributions at the outlet of the front rotor [11]. Ravelet et al. investigated the effect of the blade loading of counter rotating axial fan on the performance and clarified the different circumferential velocity distributions at off design flow rate for each different blade loading types [12]. Further the fan noise becomes larger than the conventional rotor stator type fan because of the interaction be-tween the front and rear rotors. Then, the passive noise reductions with the per-forated blade were proposed for the contra-rotating fan [13]. It is important to clarify the influence of the wake from the front rotor to the rear rotor and the potential interaction between the front and rear rotors to increase the perfor-mance and to reduce the fan noise [14]. The blade row distance between front and rear rotors is a key parameter to consider the wake and potential interaction for the contra-rotating fan. The influence of the blade row distance between the front and rear rotors and pressure fluctuation on the casing wall were investi-gated for the counter rotating fan with fan diameter D = 375 mm [8][15]. On the other hand, the conventional design method and the theory for the turbo machinery should be modified for small-sized axial fans because small-sized axi-al fans applied to electricaxi-al devices belong to extremely smaxi-all size field in the turbo machinery [16]. Therefore, there is the strong demand to establish the de-sign method for small-sized axial fans based on the internal flow between the front and rear rotors. Furthermore, the performance characteristics of each front and rear rotor and internal flow condition of the contra-rotating small-sized cooling fan having the spokes are not clarified well. Therefore, a design method of the contra-rotating small-sized cooling fan is not established.
DOI: 10.4236/ojfd.2018.82013 183 Open Journal of Fluid Dynamics shown by the experimental and numerical results. Then, the internal flow condi-tions of the contra-rotating small-sized cooling fan having spokes are discussed based on the numerical analysis results.
2. Experimental Apparatus and Method
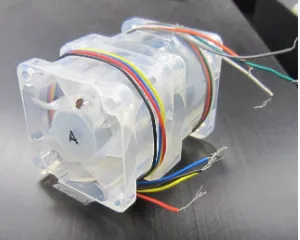
A picture of the exterior and primary dimensions of the high pressure and large flow rate contra-rotating small-sized cooling fan (R40W-A) are shown in Figure 1 and Table 1 respectively. The rotors of R40W-A are set in a 40 mm square casing, and the hub tip ratio of the front and rear rotors are Dhf/Dtf = 25
mm/37.2 mm = 0.67 and Dhr/Dtr = 26 mm/37.2 mm = 0.70 respectively.
Operat-ing flow rate is Qo = 0.55 m3/min and a tip clearance is c = 0.6 mm. Each
rota-tional speed of the front and rear rotors of R40W-A is extremely high as Nf =
15,000 min−1 and N
[image:3.595.299.449.282.402.2]r = 14,000 min−1. Figure 2 shows a schematic diagram of an
[image:3.595.266.486.438.535.2]Figure 1. Picture of exterior for R40W-A.
Figure 2. Schematic diagram of experimental apparatus.
Table 1. Primary dimensions of rotors.
Diameter [mm] Hub Mid Tip 25 31.1 37.2
Front rotor
Blade number 7
Solidity 1.61 1.4 1.22 Stagger angle 18.2˚ 31.2˚ 36˚ Diameter[mm] 26 31.1 37.2
Rear rotor
Blade number 5
Solidity 1.03 1.17 1.1 Stagger angle 40.6˚ 40˚ 45.5˚
Fan motor
Booster fan
Orifice flowmeter
Chamber
[image:3.595.210.538.586.736.2]DOI: 10.4236/ojfd.2018.82013 184 Open Journal of Fluid Dynamics experimental apparatus and a picture of the experimental apparatus is shown in
Figure 3. The experimental apparatus was designed based on the Japanese In-dustrial Standard and air blown in a test section passes the rotors, a chamber, a measurement duct and a booster fan and blow out in the ambient atmosphere. Each rotor is driven by a brushless motor set inside of the hub and the motor is supported by spokes connected to the casing. There are three spokes down-stream of the front and the rear rotors to support the motors and the casing has curved corners at the inlet and outlet of it and circular diffuser and nozzle be-tween the front and rear rotor as can be confirmed by a sectional view of R40W-A in Figure 4. Therefore, there are some geometrical restrictions for the high pressure and large flow rate small-sized cooling fan. In the performance test, the rotational speed of each rotor was kept constant (Nf = 15,000 min−1, Nr
= 14,000 min−1) by PWM control using a function generator and the flow rate
[image:4.595.288.459.560.703.2]controlled by the booster fan and exit valve. The fan static pressure (ΔP) is measured by a pressure difference between static holes downstream of the rotor installed at the chamber and ambient air. Further, the rotational speed was eva-luated using a pulse of the motor measured by an oscilloscope. Flow rates were measured by an orifice meter set at the measurement duct and the pressure curve from a cutoff flow rate to a large flow rate was investigated in the experi-ment.
Figure 3. Picture of experimental apparatus.
Figure 4. Sectional view of casing for R40W-A.
Fan motor
Chamber
Front
DOI: 10.4236/ojfd.2018.82013 185 Open Journal of Fluid Dynamics
3. Numerical Analysis Conditions
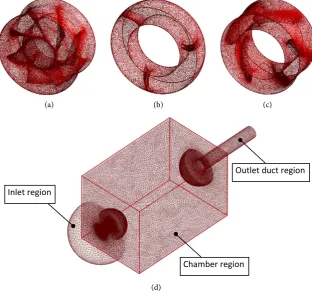
[image:5.595.292.455.242.363.2]Commercial software ANSYS-CFX16.2 was used to investigate the flow condi-tion which couldn’t be measured by the experiment. Unsteady numerical analy-sis was conducted using the three dimensional model because the complicated structure existed in this cooling fan. Figure 5 shows the numerical model. In the numerical model, a simplification of the geometry was conducted by extension of the length of the front rotor hub to the rear rotor inlet as shown in Figure 5 in order to reduce the computational cost. Numerical grids used for the numerical analysis are shown in Figure 6. The numerical domains comprise inlet, front rotor, spoke, rear rotor, chamber and outlet duct regions. The numerical grid
Figure 5. Sectional view of numerical model.
(a) (b) (c)
(d)
Figure 6. Numerical analysis grids. (a) Front rotor; (b) Spoke region; (c) Rear rotor; (d) Whole domains.
Inlet region
Chamber region
[image:5.595.216.529.403.694.2]DOI: 10.4236/ojfd.2018.82013 186 Open Journal of Fluid Dynamics points are 617,090 for the inlet region, 1,479,336 for the chamber region and 237,628 for the outlet duct region respectively. The numerical grid points are 3,924,468, 362,848 and 3,107,155 for the front rotor, spoke and rear rotor re-gions respectively. The tip clearance was kept 0.6 mm the same as the experi-mental apparatus in the numerical analysis. At an inlet boundary, constant flow rate was given and constant pressure for an outlet boundary condition. Because the gage pressure 0 Pa was given at the outlet of the numerical domain (outlet duct region), static pressure and total pressure inside the rotors becomes minus. The coupling between the front and rear rotors was accomplished by the tran-sient rotor stator. The scalable wall function was used as a near wall treatment and the LRR Reynolds Stress model, which provides high accuracy for some complex flows, was used as a turbulence model. The unsteady numerical flow analysis was conducted at the operating flow rate Qo = 0.55 m3/min and 4 other
flow rate points 0.4Qo, 0.7Qo, 1.3Qo and 1.6Qo. A time step number per one rotor
rotation was 140 and the time step was t = 2.857 × 10⁻⁵ s. The data of one rotor
rotation were obtained after 10 rotor rotations in the unsteady numerical analy-sis and the computational time for 10 rotor rotations at each flow rate was about 1 week. The fan static pressure for the numerical analysis was calculated by the static pressure difference between the static pressure hole positions installed at the chamber and the inlet boundary of the numerical domain, which was almost the same with the experiment. The air was assumed incompressive fluid, so the density of the air was constant in this research. The static pressure efficiency was evaluated by a ratio of a multiplication of the static pressure and the flow rate to the shaft power obtained by the numerical analysis.
4. Experimental and Numerical Analysis Results
4.1. Performance Curve of R40W-A
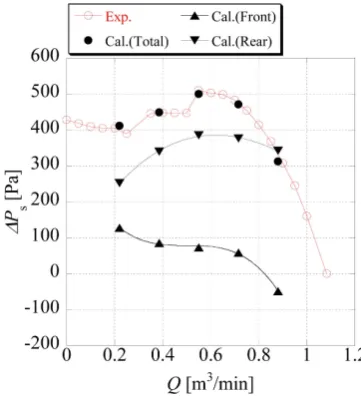
Figure 7 shows the fan static pressure curves of the test fan at the design rota-tional speed Nf/Nr = 15,000 min−1/14,000 min−1 obtained by the experiment.
Numerical analysis results are also shown in Figure 7. A horizontal axis is the flow rate Q and a vertical axis is the fan static pressure ΔPs. The fan static
pres-sure of each front and rear rotor obtained by the numerical analysis, in which the static pressure difference in the spoke region is excluded, is also shown in
Figure 7. The test fan showed the negative slope of the pressure curve from the operating flow rate Qo = 0.55 m3/min to the maximum flow rate Q = 1.08
m3/min and the maximum fan static pressure ΔP
s = 510 Pa was obtained at the
operating flow rate Qo = 0.55 m3/min in the experiment. The maximum fan
stat-ic pressure of the numerstat-ical analysis was also obtained at the operating flow rate Qo = 0.55 m3/min and its value was ΔPs = 500 Pa, which was within the 2%
ac-curacy of the experiment. A positive slope of the pressure curve appeared from the partial flow rate Q = 0.50 m3/min to the operating flow rate Q
o = 0.55 m3/min.
DOI: 10.4236/ojfd.2018.82013 187 Open Journal of Fluid Dynamics Figure 7. Fan static pressure curves.
partial flow rates region Q = 0.25 - 0.35 m3/min. It was confirmed that the
oper-ating condition of the test fan was in severe condition as the fan static pressure was set extremely high and the operating flow rate existed near the flow rate range with the positive slope of the fan static pressure curve. The whole of the numerical data accorded with the experimental data and the trend of the fan static pressure curve of the experiment could be captured well by the numerical analysis quantitatively. Then, the performance of each front and rear rotor, which could not be obtained by the experimental method, was investigated by the numerical analysis.
The fan static pressure of the front rotor was extremely lower than that of the rear rotor and the fan static pressure decreased according to the increase of the flow rate. On the other hand, the fan static pressure of the rear rotor was high and about 77% of the total fan static pressure was obtained by the rear rotor at the operating flow rate Qo = 0.55 m3/min. The fan static pressure of the rear
ro-tor showed the maximum value at Qo = 0.55 m3/min, where the maximum total
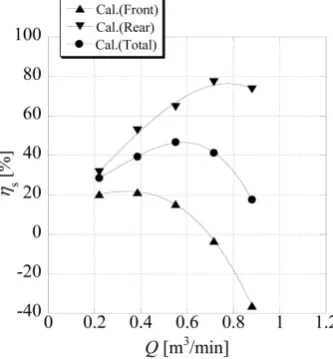
fan static pressure obtained. The static pressure efficiency of each front rotor, rear rotor and its total including static pressure difference in spoke region are shown in Figure 8. The static pressure efficiency was obtained by the unsteady numerical analysis. A horizontal axis is the flow rate Q and a vertical axis is the static pressure efficiency ηs. The maximum total fan static pressure efficiency
obtained at the operating flow rate Qo = 0.55 m3/min−1 was low as ηs = 46.7%
DOI: 10.4236/ojfd.2018.82013 188 Open Journal of Fluid Dynamics Figure 8. Static pressure efficiency.
flow rate. Therefore, the internal flow condition of each front and rear rotor was investigated using the numerical analysis results to clarify the difference of each front and rear rotor performance.
4.2. Internal Flow Condition of R40W-A at Operating Flow Rate
Q
oThe internal flow conditions at the operating flow rate Qo = 0.55 m3/min were
investigated by the numerical analysis results. Blade-to-blade relative velocity vectors and static pressure distribution at each radial positions r/rc = 0.74, r/rc =
0.85 and r/rc = 0.96 are shown in Figure 9 and Figure 10. The flow rate is the
operating flow rate Qo. r and rc means radius, where the data obtained, and inner
radius of the casing. It was observed from the internal flow near the hub in Fig-ure 9(a) and Figure 10(a) that the stagnation point at the leading edge of the front and rear rotors existed near the pressure surface of the blade at the operat-ing flow rate Qo = 0.55 m3/min and the small separation occurred on the suction
surface of the rear rotor. On the other hand, the relative velocity of the suction surface of the rear rotor was high because of the circumferential velocity at the outlet of the front rotor and decreased suddenly at the outlet of the rear rotor. Therefore, the static pressure increased significantly in the rear rotor, although the static pressure increase of the front rotor was small. This flow condition was similar to those at other radial positions in Figure 9(b) and Figure 9(c) and
Figure 10(b) and Figure 10(c) and corresponded to the result that the fan static pressure of the rear rotor was large compared to the front rotor in Figure 7. The leakage flow from the pressure surface to the suction surface near the mid of the blade chord were confirmed for both front and rear rotors at shroud region in
Figure 9(c). Total pressure distribution at each radial position is shown in Fig-ure 11. The flow rate is the operating flow rate Qo. The total pressure decreased
downstream of the trailing edge of the front rotor and spoke at r/rc = 0.74 and
DOI: 10.4236/ojfd.2018.82013 189 Open Journal of Fluid Dynamics Figure 9. Velocity vectors at Qo. (a) r/rc = 0.74; (b) r/rc = 0.85; (c) r/rc = 0.96.
Figure 10. Static pressure distribution at Qo. (a) r/rc = 0.74; (b) r/rc = 0.85; (c) r/rc = 0.96.
40
10 [m/s]
(a)
(b)
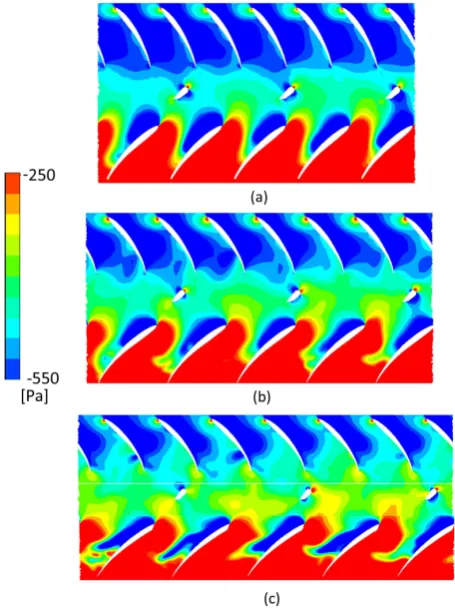
[image:9.595.258.486.402.708.2]DOI: 10.4236/ojfd.2018.82013 190 Open Journal of Fluid Dynamics Figure 11. Total pressure distribution at Qo. (a) r/rc = 0.74; (b) r/rc = 0.85; (c) r/rc = 0.96.
which can be confirmed in Figure 9(a). On the other hand, this separation re-gion on the suction surface becomes small and low total pressure rere-gion reduces at radial mid position r/rc = 0.85. The influence of the tip leakage flow is strong
for both front and rear rotors near the tip region at r/rc = 0.96. The low total
pressure region associated to the tip leakage flow spreads blade-to-blade region widely for both rotors and the total pressure loss is considered to be large.
The meridional velocity vectors and static pressure on the vertical plane at the operating flow rate Qo = 0.55 m3/min are shown in Figure 12 and Figure 13.
DOI: 10.4236/ojfd.2018.82013 191 Open Journal of Fluid Dynamics Figure 12. Meridional velocity vectors at Qo.
Figure 13. Static pressure distribution at Qo.
region. Then, the main flow inclined to radial mid and hub region between the front and rear rotors. The back flow region disappeared in the circular nozzle region with the increase of the velocity and uniform flow was achieved at the in-let of the rear rotor. The static pressure increased significantly in the rear rotor and its distribution was uniform in radial direction as could be seen in Figure 13. Total pressure distribution on the vertical plane at the operating flow rate Qo
= 0.55 m3/min is shown in Figure 14. The low total pressure region caused by
the tip leakage flow is clearly observed near the tip region for both front and rear rotor on the meridional plane and its area is large enough to influence on the main flow of the test cooling fan.
5. Concluding Remarks
The performance characteristics of the high pressure and large flow rate small-sized contra-rotating axial flow fan were investigated by the experiment and the numerical analysis. Then, the internal flow conditions at the operating flow rate were clarified by the numerical analysis results. The fan static pressure of the front rotor was extremely lower than that of the rear rotor and the fan static pressure of the front rotor decreased according to the increase of the flow rate. On the other hand, the fan static pressure of the rear rotor was high and about 77% of the total fan static pressure was obtained by the rear rotor at the operating flow rate Qo = 0.55 m3/min. The maximum total fan static pressure
ef-ficiency obtained at the operating flow rate Qo = 0.55 m3/min was low as ηs =
46.7% because of the design specification of high pressure and large flow rate cooling fan with the 40 mm square casing. The fan static pressure of the rear rotor
[m/s] 30
0
[image:11.595.263.487.217.330.2]DOI: 10.4236/ojfd.2018.82013 192 Open Journal of Fluid Dynamics Figure 14. Total pressure distribution at Qo.
was higher than that of the front rotor in all flow rates. The stagnation point at the leading edge of the front and rear rotors existed near the pressure surface of the blade at the operating flow rate Qo = 0.55 m3/min. On the other hand, the
relative velocity of the suction surface of the rear rotor was high because of the circumferential velocity at the outlet of the front rotor and decreased suddenly at the outlet of the rear rotor. Therefore, the static pressure increased significantly in the rear rotor, although the static pressure increase of the front rotor was small. In general, the corner separation occurred at the inlet of the casing and this separation vortex influenced on the inlet flow condition. In this test fan, this vortex was basically got stuck in the inlet corner, so the flow condition near the inlet shroud wasn’t influenced by this vortex. There is the circular diffuser and nozzle region on the shroud between the front and rear rotors. The back flow occurred in the diffuser region and the static pressure was high in this region. The low velocity region spread radially inner section between the front and rear rotors by the influence of the back flow region. Then, the main flow inclined to radial mid and hub region between the front and rear rotors. The back flow re-gion disappeared in the circular nozzle rere-gion with the increase of the velocity and uniform flow was achieved at the inlet of the rear rotor. The static pressure increased significantly in the rear rotor and its distribution was uniform in radial direction. The low total pressure region caused by the tip leakage flow was clear-ly observed near the tip region for both front and rear rotor on the meridional plane and its area was large enough to influence on the main flow of the test cooling fan.
Acknowledgements
The authors wish to show our special thanks to the supports by Nidec Corpora-tion, the project research aid from Tokushima University, Japan Science and Technology Agency and Komiya research aid.
References
[1] Hata, T. and Nakamoto, S. (2010) Energy Saving Service for Data Centers. Journal the Japan Society for Precision Engineering, 76, 272-275.
https://doi.org/10.2493/jjspe.76.272
DOI: 10.4236/ojfd.2018.82013 193 Open Journal of Fluid Dynamics
Device. Turbomachinery (in Japanese), 34, 129-134.
[3] Ito, T., Minorikawa, G. and Fan, Q. (2009) Experimental Research for Performance and Noise of Small Axial Fan. International Journal of Fluid Machinery and Sys-tems, 2, 136-146. https://doi.org/10.5293/IJFMS.2009.2.2.136
[4] Liu, P., Shiomi, N., Kinoue, Y., Setoguchi, T and Jin, Y. (2014) Effect of Inlet Geo-metry on Fan Performance and Inlet Flow Fields in a Semi-Opened Axial Fan. In-ternational Journal of Fluid Machinery and Systems, 7, 60-67.
https://doi.org/10.5293/IJFMS.2014.7.2.060
[5] Furukawa, A., Shigemitsu, T. and Watanabe, S. (2007) Performance Test and Flow Measurement of Contra-Rotating Axial Flow Pump. Journal of Thermal Science, 16, 7-13. https://doi.org/10.1007/s11630-007-0007-4
[6] Furukawa, A., Cao, Y., Okuma, K. and Watanabe, S. (2000) Experimental Study of Pump Characteristics of Contra-Rotating Axial Flow Pump. Proceeding 2nd Inter-national Symposium on Fluid Machinery and Fluid Engineering, 67, 245-252. [7] Kodama, Y., Hayashi, H., Fukano, T and Tanaka, K. (1994) Experimental Study on
the Characteristics of Fluid Dynamics and noise of a Counter-Rotating Fan (1st Report, Effects of the Supporter Shape of the Electric Motor and the Distance be-tween Two Rotors on the Characteristics. Transactions of the JSME (in Japanese), 60, 2764-2771.
[8] Nouri, H., Ravelet, F., Bakir, F., Sarraf, C. and Rey, R. (2012) Design and Experi-mental Validation of a Ducted Counter-Rotating Axial-Flow Fans System. Journal of Fluids Engineering, 134, 104504. https://doi.org/10.1115/1.4007591
[9] Shigemitsu, T., Fukutomi, J. and Agawa, T. (2013) Performance Characteristics and Flow Conditions of High Pressure and Large Flow Rate Cooling Fan. Proceedings of the ASME Fluids Engineering Division Summer Meeting, Lake Tahoe, 7-11 July 2013, FEDSM2013-16273. https://doi.org/10.1115/FEDSM2013-16273
[10] Shigemitsu, T., Fukutomi, J. and Agawa, T. (2013) Internal Flow Condition of High Power Contra-Rotating Small-Sized Axial Fan. International Journal of Fluid Ma-chinery and Systems, 6, 25-32. https://doi.org/10.5293/IJFMS.2013.6.1.025
[11] Shigemitsu, T., Furukawa, A., Okuma, K. and Watanabe, S. (2002) Experimental Study on Rear Rotor Design in Contra-Rotating Axial Flow Pump. Proceedings of 5th JSME/ KSME Fluids Engineering Conference, Nagoya, 17-21 November 2002, 1453-1548.
[12] Ravelet, F., Bakir, F., Sarraf, C. and Wang, J. (2018) Experimental Investigation on the Effect of Load Distribution on the Performances of a Counter-Rotating Axi-al-Flow Fan. Experimental Thermal and Fluid Science, 96, 101-110.
https://doi.org/10.1016/j.expthermflusci.2018.03.004
[13] Wang, C. and Huang, L. (2014) Passive Noise Reduction for a Contrarotating Fan.
Journal of Turbomachinery, 137, 031007. https://doi.org/10.1115/1.4028357
[14] Sanders, A.J., Papalia, J. and Fleeter, S. (2002) Multi-Blade Row Interactions in a Transonic Axial Compressor: Part I - Stator Particle Image Velocimetry (PIV) In-vestigation. Journal of Turbomachinery, 124, 10-18.
https://doi.org/10.1115/1.1411973
[15] Nouri, H., Danlos, A., Ravelet, F., Bakir, F. and Sarraf, C. (2013) Experimental Study of the Instationary Flow between Two Ducted Counter-Rotating Rotors.
Journal of Engineering for Gas Turbines and Power, 135, 022601.
https://doi.org/10.1115/1.4007756
DOI: 10.4236/ojfd.2018.82013 194 Open Journal of Fluid Dynamics