Sample preference for colorectal cancer screening
tests: Blood or stool?
Joanne M. Osborne1,2*, Carlene Wilson1, Vivienne Moore3, Tess Gregory1, Ingrid Flight4, Graeme P. Young1
1Flinders Centre for Cancer Prevention and Control, Flinders University of South Australia, Adelaide, Australia; *Corresponding Author: jo.osborne@health.sa.gov.au
2Bowel Health Service, Repatriation General Hospital, Adelaide, Australia 3Discipline of Public Health, University of Adelaide, Adelaide, Australia 4CSIRO Preventative Research Flagship, Adelaide, Australia
Received 17 April 2012; revised 20 May 2012; accepted 12 June 2012
ABSTRACT
Objective: Despite the high prevalence of CRC and the proven benefits of faecal sampling tests, participation rates in CRC screening are subop- timal. Literature has identified a number of bar- riers to participation, including faecal aversion. Emerging test technologies suggest blood-based molecular markers might provide an alternative, more acceptable option, for CRC screening tests. We aim to determine preference for blood com- pared to faeces as the sample for the screening test. Methods: A survey was mailed to 956 South Australians aged 50 to 74 years. Data were col- lected on sample preference, demographic vari- ables, and ratings of screening test convenience and comfort. Results: The survey yielded a 43% response rate. The majority of participants pre- ferred to provide a blood sample (78% vs 22%, p < 0.001). Women were more likely to prefer blood than men (82% vs 74%, p = 0.05). Sample ex- perience influenced preferences, with a signifi- cantly higher preference for faeces among par- ticipants with experience in faecal sampling (27% vs 17% with no experience, p < 0.05). Par- ticipants who preferred to provide a faecal sam- ple rated it significantly more convenient (p < 0.001), more comfortable (p < 0.001), and more acceptable (p < 0.001) than those who preferred blood sampling. Conclusions: Survey partici- pants overwhelmingly indicate a preference for the idea of a blood sample over a faecal sample for CRC screening. Preference was influenced by gender, experience with sampling method and the individual’s perception of sampling convenience, sampling comfort and sample ac- ceptability. Our results suggest population par- ticipation rates are likely to improve with blood-
based screening tests.
Keywords:Colon Cancer Screening; Faecal Occult Blood Test; Sample Preference; Stool Sampling; Blood Sampling; Participation
1. INTRODUCTION
Colorectal cancer (CRC) is the second most prevalent cancer in Australia [1], similar to the situation in many other developed countries. Despite the high prevalence of CRC in Australia, and proven benefits of screening using Faecal Occult Blood Tests (FOBT) [2-5], partici- pation rates in faecal-based CRC screening are subopti- mal (40.1%) [6].
Achieving a high participation rate is crucial as early (curable) lesions will only be detected in individuals who participate in screening [7]. Therefore, the target popula- tion must find the screening test acceptable and be will- ing to undertake the offered test. Research examining attitudes toward FOBT has identified a number of par- ticipation barriers, including faecal aversion [8].
There is limited evidence available on patient prefer- ence for sample provision [9,10], and it is consequently difficult to judge how blood sampling would be viewed even though there is a general perception that it would be preferred to an FOBT. Although a large percentage of the population believe that blood sampling is a good source of information relevant to diagnosis and decision-making about health [11], a recent study suggests the existence of significant levels of “blood-injury-injection” phobia among both healthy (19.5%) and patient (30.1%) par- ticipants [12].
any preference varies according to demographic vari- ables and past sampling experience. The aims of our study were to: 1) Determine whether people prefer to provide a blood sample or a faecal sample for a CRC screening test; and 2) Investigate whether age, gender, residential location, marital status, employment status, education and familiarity with sampling, influence sam- ple preference for a CRC screening test.
2. METHODS
2.1. Study Population
The Australian Electoral Commission provided a ran- dom selection of names and addresses of males or fe- males, aged 50 to 74 years residing in the South Austra- lian metropolitan electorates of Adelaide, Port Adelaide and Sturt and the South Australian rural electorate of Barker. This range of urban and rural areas of varying socio-economic distributions was targeted to investigate whether these factors influenced sample preference.
2.2. Survey Administration
Survey questions were devised to capture information on the extent to which preference for sampling technolo-
gies varied according to demographic variables; and to measure participant familiarity with blood and faecal testing. Participants’ perceptions of both sampling pro- cedures in terms of comfort, convenience and overall perceived acceptability was rated using a 7-point Likert scale ranging from 1 = Highly Inconvenient/Uncom- fortable/Unacceptable, to 7 = Highly Convenient/Com- fortable/Acceptable respectively. All participants were asked to nominate either blood or stool (faeces) sampling as their preferred CRC screening approach.
2.3. Survey Distribution
Data were collected via a mail-distributed paper sur- vey. An advance notification letter was sent two weeks pre-survey distribution. The survey was posted with an invitation letter, complaints procedure form, and a reply- paid envelope. Three weeks post-survey distribution, a reminder package was posted containing a reminder let- ter, replacement survey and a reply-paid envelope. Con- sent to participate was implied by return of a completed survey (see Figure 1).
2.4. Statistical Analyses
[image:2.595.152.441.407.718.2]We identified factors associated with preference using
Chi-squared analyses, non-parametric tests (e.g. Mann Whitney U Test) and independent samples t-tests ac- cording to the nature of the data. Where tests yielded results with the same levels of significance, Independent samples t-test data is shown. All data analyses were un- dertaken using Statistical Package for the Social Sciences (SPSS) Version 18 or an online statistical calculator [13]. Participants who completed <80% of survey questions were excluded from all analyses. Participants who missed individual questions were excluded case-wise from spe- cific analyses.
2.5. Ethical Approval
Ethics approval was obtained from the Flinders Clini- cal Research Ethics Committee, Flinders Medical Centre and The University of Adelaide Human Research Ethics Committee. Invitees were assigned a unique study iden- tification number. Survey responses were only identified by this number.
3. RESULTS
3.1. Response Rate and Participant Demographics
The survey yielded a 43.4% (415/956) response rate (see Figure 1). Twenty two participants were excluded
from analysis due to insufficient responses. Demographic groups were well represented with participation evenly distributed across invited groups. There were no signifi- cant differences in age, gender, residential location or Socio-Economic Indexes for Areas (SEIFA) between responders and non-responders, data not shown.
3.2. Sample Preference According to Demographic Characteristics
The majority of participants preferred to provide a blood sample (78% vs 22%, χ2(1) = 123.3, p < 0.001). Preference for a blood sample over a faecal sample was consistent across all demographic groups, however, within subgroups, differences in sample preference were observed (see Table 1). A higher proportion of females
preferred to provide a blood sample compared to males (82% vs 74%, χ2(1) = 3.69, p = 0.05). Sample preference did not differ significantly between residential locations (χ2(1) = 0.13, p > 0.05), however, a significantly higher proportion of metropolitan males preferred faecal sam- pling compared to metropolitan females, (27% vs 16%, χ2(1) = 5.68, p < 0.05).
[image:3.595.309.536.104.646.2]Marital Status and Education level significantly influ- enced preference with married/defacto people signifi- cantly more likely to prefer a faecal sample compared to widowed, single or divorced people (24% vs 11%, χ2(1) = 6.27, p < 0.05); and people who had at least completed
Table 1. Preference according to demographic characteristics.
Demographic Characteristics n =
Blood Preference Group
Faeces Preference
Group
Pearson (χ2) (p value)
Gender
Male 193 143 50
Female 196 161 35
p = 0.05
Residential Location
Metropolitan 285 224 61
Rural 104 80 24
p > 0.05
Age (years)
50 - 54 68 54 14
55 - 59 88 70 18
60 - 64 79 57 22
65 - 69 82 66 16
70 - 74 72 57 15
p > 0.05
Marital Status
Married/Defacto 302 229 73
Widowed/Single/
Divorced 80 71 9
p < 0.05
Employment Status
Employed Full Time
or Part Time 181 139 42
Unemployed, Retired,
Home Duties 201 183 40
p > 0.05
Education Level
Did Not Complete
Yr 12 131 111 20
Completed Yr 12/Completed Tertiary
Education
244 183 61
p < 0.05
SEIFAa
1st Quartile 84 70 14
2nd Quartile 92 71 21
3rd Quartile 103 82 21
4th Quartile 110 81 29
p > 0.05
aSEIFA = Socio-Economic Indexes for Areas.
Year 12, were significantly more likely to prefer a faecal sample, than those who did not complete Year 12 (25% vs 15.3%, χ2(1) = 4.52, p < 0.05).
quartiles (χ2(3) = 2.81, p > 0.05), with all of these sub- groups having a higher preference for a blood sample.
3.3. Sample Preference According to Familiarity with Sampling Procedures
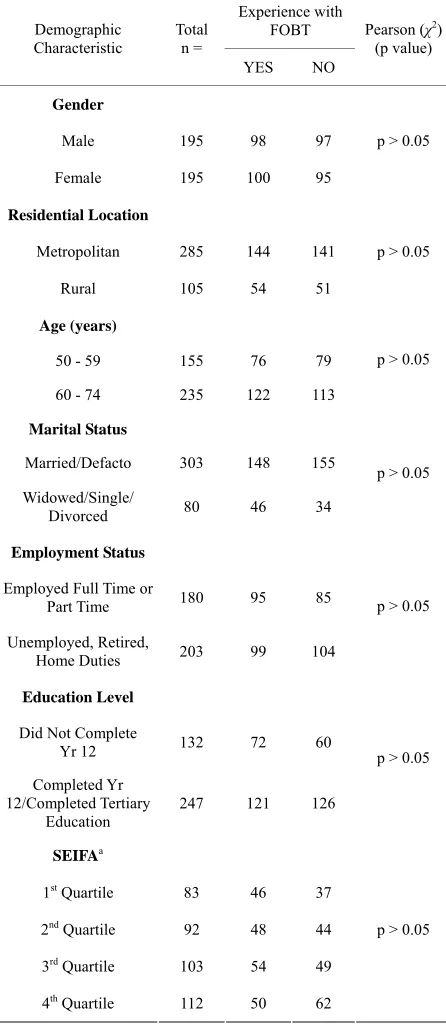
Participants were more likely to have had experience providing a blood sample (97.4%) than a faecal sample (48%). There were no significant differences in faecal sample experience across any of the demographic groups (see Table 2).
[image:4.595.311.534.116.630.2]As virtually everyone had experienced blood sampling, subsequent analyses explored sampling preference among participants based on their experience (yes or no) of fae- cal sampling. Sample experience influenced preferences, with a significantly higher preference for faeces among participants with faecal sampling experience (26% vs 18%, χ2(1) = 4.0199, p < 0.05) (see
Table 3).
3.4. Sample Preference According to Convenience, Comfort and Overall Acceptability of Samples
The Faeces Preference Group (FPG) rated the con- venience, comfortable and overall acceptability of faecal sampling significantly higher than the Blood Preference Group (BPG) (see Table 4).
The convenience of blood sampling was rated signifi- cantly lower by the FPG compared to the BPG. The mean rating score for the comfort and overall acceptabil- ity of a blood sample did not differ significantly between preference groups (see Table 4).
4. DISCUSSION
Our results showed that people overwhelmingly pre- ferred to provide a blood sample over a faecal sample for a CRC screening test.
Metropolitan males, married/defacto people, those who completed at least a Year 12 education and those with FOBT experience were the subgroups most likely to prefer a faecal sample, but overall, even these subgroups, still preferred the idea of a blood sample. Our results found other demographic variables (i.e. age, SEIFA and employment status) had no influence on sample prefer- ence.
Our findings show that the proportion of men who prefer faecal sampling is higher than the proportion of females, which seems at odds with the observations that women are more willing to participate in FOBT-based screening [14]. Our results indicate that moving to a blood sample may not necessarily improve participation rates across both genders to the same degree.
Social support, which has been shown to increase par- ticipation in FOBT screening [8], may explain why those
Table 2. Familiarity with FOBT according to demographic
characteristics.
Experience with FOBT Demographic
Characteristic
Total n =
YES NO
Pearson (χ2) (p value)
Gender
Male 195 98 97
Female 195 100 95
p > 0.05
Residential Location
Metropolitan 285 144 141
Rural 105 54 51
p > 0.05
Age (years)
50 - 59 155 76 79
60 - 74 235 122 113
p > 0.05
Marital Status
Married/Defacto 303 148 155
Widowed/Single/
Divorced 80 46 34
p > 0.05
Employment Status
Employed Full Time or
Part Time 180 95 85
Unemployed, Retired,
Home Duties 203 99 104
p > 0.05
Education Level
Did Not Complete
Yr 12 132 72 60
Completed Yr 12/Completed Tertiary
Education 247 121 126
p > 0.05
SEIFAa
1st Quartile 83 46 37
2nd Quartile 92 48 44
3rd Quartile 103 54 49
4th Quartile 112 50 62
p > 0.05
[image:4.595.309.537.670.735.2]aSEIFA = Socio-Economic Indexes for Areas.
Table 3. Preference according to experience with FOBT.
Experience with
FOBT n =
Blood Preference Group
Faeces Preference Group
YES 190 140 (74%) 50 (26%)
NO 196 161 (82%) 35 (18%)
Table 4. Preference according to perception of sample acceptability.
Acceptability Rating Blood Preference Group(Mean ± SD) Faeces Preference Group(Mean ± SD) t p value
Faeces Convenience 4.61 ± 1.87 6.45 ± 1.05 11.62 0.00
Blood Convenience 6.32 ± 1.15 5.88 ± 1.58 −2.38 0.00
Faeces Collection Comfort 5.10 ± 1.89 6.72 ± 0.65 12.54 0.00
Blood Collection Comfort 6.59 ± 0.93 6.36 ± 1.17 −1.61 0.11
Overall Acceptability of Faeces 5.23 ± 1.80 6.70 ± 0.66 11.72 0.00
Overall Acceptability of Blood 6.55 ± 0.98 6.42 ± 1.10 −1.08 0.28
who were married or in defacto relationships were more amenable to a faecal sample, but as we observed no dif- ferences in FOBT experience within the marital status variable, the higher preference for a faecal sample in this group is unexpected.
Education, which has been associated with increased awareness of FOBT screening [8], may account for our observation that those with a higher education were more amenable to a faecal sample as this type of sample is known to be the current screening test. Qualitative re- search unpublished by the authors, observed that people with a preference for a faecal sample chose this sample because it was derived from the intestine and therefore was thought to have higher efficacy than a blood sample.
These interesting findings highlight the importance of exploring the link between acceptability of samples and participation in screening. Once accurate blood-based tests are identified, randomised-controlled trials using participation rates as the outcome are needed to under- stand actual behaviour relative to intention.
Experience was evenly distributed amongst the sub- groups with almost everyone in the subgroups having experience providing a blood sample, compared to about half having FOBT experience. Despite the strong pref- erence for a blood sample overall, familiarity clearly influenced sample preference. Participants with faecal sampling experience were more amenable to a faecal sample than participants with no faecal sampling experi- ence. This finding fits in with experience in many arenas which shows that familiarity can overcome perceived barriers. As people become more familiar with faecal- based screening, the observed difference in preference might not be as apparent.
Participant’s perceptions of sampling convenience, comfort and acceptability influenced sample preference. The extent to which specific sampling attributes im- pacted on preference is difficult to assess accurately from the rating scale measures used; future research should address the relative importance of attributes using tech- niques such as conjoint analysis [15]. In this study, those who preferred a blood sample rated blood considerably
more acceptable than a faecal sample, whereas those who preferred faecal sampling, and rated faeces as more ac- ceptable than blood, also rated blood as a highly accept- able sample. This finding suggests that even those par- ticipants, who chose faeces as their preferred sample, would still find a blood sample highly acceptable for a CRC screening test.
Among those who preferred a faecal sample, faeces was rated as being more convenient than a blood sample. This finding implies that faecal sampling, which is usu- ally performed at home and distributed through the postal system, may be considered more convenient than attending a clinic or doctor’s appointment to provide a blood sample. Further evaluation of the perceived con- venience of different aspects of the sampling procedures, and their importance to the decision-making process, would be required before this assumption can be con- firmed.
Less than half of invitees responded, and caution is needed in generalising these findings, however, it is a strength of the study that the views of respondents across genders, metropolitan and rural areas as well as SEIFA were well represented, with proportional participation rates across groups, therefore the sample was representa- tive of the population of Australia. However, the ages of those who participated in the survey differ significantly from the Australian population, with people aged over 60 more likely to participate than people aged under 60, indicating caution when generalising these findings to the general population.
to affect uptake, over and above sample type, include perceived test efficacy, cost and testing frequency and future research should examine these. If a blood-based test is implemented in practice, consideration of how different subgroups view a faecal or blood sample needs deliberation. For maximum participation in CRC screen- ing, perhaps both a blood and a faecal test should be of- fered to target preference differences between subgroups.
REFERENCES
[1] Australian Institute of Health and Welfare (2008) Austra- lia’s health 2008. AIHW, Canberra.
[2] Mandel, J.S., Bond, J.H., Church, T.R., et al. (1993) Re- ducing mortality from colorectal cancer by screening for fecal occult blood. New England Journal of Medicine,
328, 1365-1371. doi:10.1056/NEJM199305133281901
[3] Hardcastle, J.D., Chamberlain, J.O., Robinson, M.H., et al. (1996) Randomised controlled trial of faecal-occult- blood screening for colorectal cancer. Lancet, 348, 1472-
1477. doi:10.1016/S0140-6736(96)03386-7
[4] Kronborg, O., Fenger, C., Olsen, J., et al. (1996) Ran- domised study of screening for colorectal cancer with faecal-occult-blood test. Lancet, 348, 1467-1471.
doi:10.1016/S0140-6736(96)03430-7
[5] Lindholm, E., Brevinge, H. and Haglind, E. (2008) Sur- vival benefit in a randomized clinical trial of faecal occult blood screening for colorectal cancer. British Journal of Surgery, 95, 1029-1036. doi:10.1002/bjs.6136
[6] Australian Institute of Health and Welfare (2010) Na- tional bowel cancer screening program: Annual monitor- ing report 2009 data supplement 2010. Cancer series no 57 cat no CAN53. AIHW, Canberra.
[7] Australian Cancer Network Cancer Guidelines Revision Committee (2005) Guidelines for the prevention, early detection and management of colorectal cancer. The
Cancer Council Australia and Australian Cancer Network, Sydney.
[8] Weitzman, E.R., Zapka, J., Estabrook, B. and Goins, K.V. (2001) Risk and reluctance: Understanding impediments to colorectal cancer screening. Preventive Medicine, 32,
502-513. doi:10.1006/pmed.2001.0838
[9] Koka, S., Beebe, T.J., Merry, S.P., et al. (2008) The pref- erences of adult outpatients in medical or dental care set- tings for giving saliva, urine or blood for clinical testing.
Journal of the American Dental Association, 139, 735- 740.
[10] Nayaradou, M., Berchi, C., Dejardin, O. and Launoy, G. (2010) Eliciting population preferences for mass colorec- tal cancer screening organization. Medical Decision Mak- ing, 30, 224-233. doi:10.1177/0272989X09342747
[11] Pfeffer, N. and Laws, S. (2006) “It’s only a blood test”: What people know and think about venepuncture and blood. Social Science & Medicine, 62, 3011-3023.
doi:10.1016/j.socscimed.2005.11.050
[12] Kose, S. and Mandiracioglu, A. (2007) Fear of blood/in- jection in healthy and unhealthy adults admitted to a teaching hospital. International Journal of Clinical Prac- tice, 61, 453- 457. doi:10.1111/j.1742-1241.2006.01150.x
[13] Chinese University of Hong Kong, Dept OBG (2010). http://department.obg.cuhk.edu.hk/researchsupport/RxC_ contingency_table.ASP,2010
[14] Javanparast, S., Ward, P. and Cole, S. (2010) A cross- sectional analysis of participation in National Bowel Cancer Screening program in Adelaide by age, gender and geographical location of residence. Australasian Medical Journal, 1, 141-146.
doi:10.4066/AMJ.2010.198
[15] Phillips, K., Johnson, F. and Maddala, T. (2002) Measur- ing what people value: A comparison of “attitude” and “preference” surveys. Health Services Research, 37, 1659-


![Bis{2 [(5 hydroxypentyl)iminomethyl]phenolato κ2N,O1}copper(II)](data:image/gif;base64,R0lGODlhAQABAIAAAP///wAAACH5BAEAAAAALAAAAAABAAEAAAICRAEAOw==)