Development and Application of Gas Turbine
Performance Analysis Software: Part I- Ideal Cycles and
Real Cycles
E. G. Saturday
Dept. of Mechanical Engineering, University of Port Harcourt
J. C. Ofodu
Dept. of Mechanical Engineering, University of Port Harcourt
ABSTRACT
This work centers on the development, validation and application of a gas turbine performance analysis software. Design point performance analysis can be carried out and the target engine is the simple cycle engine with one compressor and one turbine which is suitable for power applications. The software is developed based on the ideal Brayton cycle and the real cycle. The latter incorporates isentropic efficiencies of the compressor and the turbine, combustion efficiency, combustor pressure loss and exhaust pressure loss. The software is tested for accuracy using both engine operation field data and engine design data from MS5001PA gas turbine engine. By using well defined engine operation data and choosing a set of percentage losses and efficiencies characterizing the real engine cycle, the results from the developed software closely approximate those of the field data as well as the engine design data. Ideal cycle simulation results of the variations of different parameters with pressure ratio (PR) for fixed value of turbine entry temperature were obtained; while thermal efficiency increases continuously with PR and heat input decreases continuously with PR, net work output on the other hand increases to a maximum at an optimum PR and decreases with further increase in PR. Both the optimal PR and the maximum net work output increases with the turbine entry temperature for fixed value of fuel flow rate. Although, the simulation results are obtained from the ideal Brayton cycle, they do serve as preliminary design results for detailed engine design.
Keywords
Design point, Validation, Isentropic efficiencies, Combustion efficiency, Simulation
1.
INTRODUCTION
The gas turbine is an internal combustion engine theoretically operating on the ideal Brayton cycle. The real cycle engine operates on the Joule cycle [1]. The simple gas turbine engine cycle consists of three major components- the compressor, the combustor (combustion chamber), and the turbine. There is an intake section and an exhaust section after the turbine or a nozzle depending on the application. The simple three-major components arrangement has been greatly modified. The modified cycles include Brayton cycle with regeneration cycle, intercooling, reheat and any combination of the above three modifications [1], [2].
Gas turbine performance calculations can be design point and off-design performance calculations [3]–[6] In practice, the gas turbine engine operates in several off-design conditions within a short while. This work centers on developing a computer program that can carry out performance design point calculations which can be used as a study tool for
beginners in the study of this prime mover. There are several softwares on gas turbine performance analysis. Some are commercial [7], some in-house [8] and others developed by individuals [9]. Most of these gas turbine performance analysis softwares can carry out both design point and off-design performance analysis, but some of them are very complex to use; beginners will not find them appealing hence this work. The present work focusses on ideal and real gas turbine cycles simulations. Performance simulations of modified cycles is the subject of a second paper.
The developed software was tested for accuracy using data from real engine operation. The output from the software (compressure exit temperature and pressure, net power output, exhaust gas temperature and thermal efficiency) for the ideal cycle plant as may be expected do not match the field data closely. But using the real cycle by exploiying appropriate compressor and turbine isentropic efficiencies, combustor pressure loss, exhaust pressure loss and combustion efficiency, the output from the software closely matched the field data. Every gas turbine engine is basically defined by the PR. To create an engine model that can mimic a real engine, adaptation techniques are used [10], [11], but that is not within the scope of this work.
2.
PERFORMANCE ANALYSIS
The performance analysis of the gas turbine engine involves carrying out energy balance in each of the major components. This is done for both the ideal simple cycle and the real cycle engines respectively in this work.
2.1
Ideal Cycle Performance Analysis
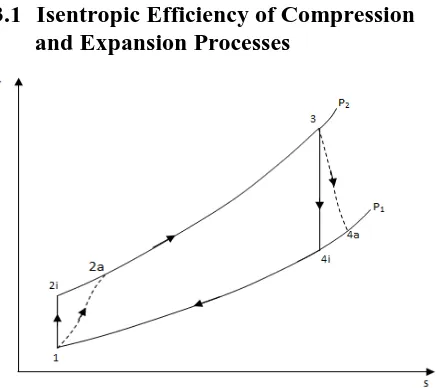
Figure 1 shows a an ideal simple cycle gas turbine engine. The ideal Brayton cycle engine could be modelled by replacing the combustion and the exhaust processes with heat exchangers. In this work, the open cycle plant is employed with no losses. To carry out the performance calculations of this plant, the temperature-entropy (T-s) diagram of the engine is employed and this is shown in Fig 2. Air-standard assumptions [12]–[14]are applied in analyzing the plant with the compression and expansion processes assumed to be isentropic. The exhaust process is represented as process 4-1 in the T-s diagram. The analysis of the plant here involves
Fig 1: Simple cycle gas turbine engine
Fig 2: T-s Diagram of an ideal gas turbine plant
The steady flow energy equation [15] could be applied to each of the components in the cycle, where the kinetic and potential energy terms are neglected.. The mass flow rate through the various components in the cycle is assumed to be the same.
2.1.1
Thermal Efficiency of the Plant
The thermal efficiency of the Brayton cycle gas turbine
engine, (designated as
th,i since it is an ideal plant) is given by Equation (1),in i C i T i th
q
w
w
, ,,
(1)The specific power absorbed by the compressor is given by Equation (2) (exploiting the steady flow energy equation),
1 2
,
h
h
w
ci
(2)where
h
1 andh
2are the static enthalpies at the end states of the compression process. Since the working fluid is assumedto be ideal,
h
c
pT
. Thus Equation (2) could be put in the form,
2 1 2 1 2 ,1
T
T
T
c
T
T
c
w
ci p p (3)In the compression process, with
r
pas the PR,
1 1 2 1 2 1 pr
p
p
T
T
Therefore,
1 2,i p
1
pc
c
T
r
w
(4)The specific power output of the turbine is given by Equation (5)
1 3 3 4 3 4 3,i p p
1
p1
pT
c
T
r
T
T
T
c
T
T
c
w
(5)The specific net work output of the plant is given by,
3 2
1
,
,
w
c
1
r
T
T
w
w
NET Ti Ci p p
(6)The quantity of heat added to the working fluid per mass flow rate of the working fluid is,
T
3T
2
c
q
in
p
(7)The heat input into the cycle
Q
in comes from the combustion of fuel, natural gas in most cases. This can be expressed as,f f in
m
H
Q
(8)where
m
f is the mass flow rate of the fuel andH
f is the lower calorific value of the fuel in (J/kg). From Equations (7) and (8), withm
as the flow rate of the air, the fuel flow rate for the ideal cycle is obtained as,
fp
f
m
c
T
T
H
m
3
2/
(9)
The thermal efficiency of the Brayton cycle gas turbine engine is given as,
1 2 3 2 3 1 ,1
1
p p p p in NET i thr
T
T
c
T
T
r
c
q
w
(10)The net work output can also be expressed by Equation (11)
where
T
3/
T
1 is referred to as the temperature ratio of thecycle,
1 1 3 1 1 2 3 11
1
p p p pp NET
r
T
T
r
T
c
T
T
r
c
w
(11)2.1.2
Optimum Pressure Ratio
The optimum PR is the PR at which the specific net work
output
w
NETis maximum. This PR designated here asmax ,W p
r
is obtained by differentiating Equation (11) with respect to the PR and equating to zero. The optimum PRn, thethermal efficiency at optimum PR
th,Wmax , and the net work output at the optimum PRw
NET,Wmaxare given by Equations (12) to (14), 1
2 1 3 max ,
T
T
2 1 1 3 max ,
1
T
T
W th
(13)
1
1
2 1 1 3 1 2 1 1 3 3 max ,T
T
T
T
T
T
c
w
NETW p (14)3.
REAL GAS TURBINE ENGINE
CYCLE ANALYSIS
In the real cycle, the compression and the expansion processes are associated with losses hence are not isentropic In the combustion process, there is pressure loss and this has to be accounted for in the real cycles. The combustion process in the real cycles involves the combustion of fuel. The combustion process also involves combustion efficiency. Each of these is considered here.
[image:3.595.55.277.75.206.2]3.1
Isentropic Efficiency of Compression
and Expansion Processes
Fig 3: Isentropic and actual compression and expansion processes
Figure 3 shows the T-s diagram of the simple cycle plant where the isentropic efficiencies of the compression and expansion processes are included. Process 1-2i is the ideal compression process (isentropic process) and process 1-2a is the actual compression process. The isentropic efficiency of
the compression process
C,i is defined as in Equation (15) wherew
C,a is the actual compression work,1 2 1 2 1 2 1 2 , , ,
T
T
T
T
h
h
h
h
w
w
a i a i a C i C i C
(15)Process 4a is the actual expansion process while process 3-4i is the ideal expansion process. The isentropic efficiency of
the expansion process
Ti is defined as in Eq. (16) wherea T
w
, is the actual turbine work,i a i a i T a T i T
T
T
T
T
h
h
h
h
w
w
4 3 4 3 4 3 4 3 , , ,
(16)3.2
Pressure Losses in Combustion
Chamber and Exhaust Process
In the combustion process, there is some pressure loss hence
3
2
p
p
. There are correlations for pressure loss, but pressure loss is usually expressed as a percentage of the compressor exit pressure. Forx
%
loss in pressure, the pressure at the combustor exit is expressed as,2 3
100
1
x
p
p
(17)There is also pressure loss in the exhaust process, that is
1
4
p
p
. This could be expressed as a percentage of the compressor inlet pressurep
1. If there is a pressure loss of%
x
of compressor inlet pressure in the exhaust system, then,1 4
100
1
x
p
p
(18)3.3
Combustion Process
The combustion process involves the burning of fuel. The quantity of fuel burnt is meant to achieve the required TET (T3). For complete combustion, T3 is obtained. For incomplete
combustion,
T
3' is obtained whereT
3'
T
3. The combustion efficiency
cc is given by Equation (19) in terms of temperatures and by Equation (20) in terms of fuel flow rate;
3 2
2 ' 3
T
T
T
T
cc
(19) f f ccm
m
'
(20)where
m
f'is the fuel flow rate that ought to achieve the required temperature rise. The simulation cases considered later are carried out either at fixed fuel flow rate or fixed value of TET. The fuel flow rate for known TET and the TET for known fuel flow rate incorporating combustion efficiency are given by Equations (21) and (22) respectively;
f cc p fH
T
T
c
m
m
2 3
(21) p cc f fc
m
H
m
T
T
2 3 (22)3.4
Thermal Efficiency of the Real Cycle
Gas Turbine Plant
The thermal efficiency of the real cycle gas turbine plant
is given as,
[image:3.595.58.278.286.480.2](23)
But
and ;
substituting in Eq. (30) and simplifying,
i T i T a
T
w
w
,
,
, andw
C,a
w
C,i/
C,i;substituting in Eq. (30) and simplifying,
in i C
i C i T i T i C a th
q
w
w
,
, , , ,
,
(24)
4.
BASIC FEATURES OF DEVELOPED
SOFTWARE
The developed software is for design point performance analysis. For both the ideal cycle analysis and real cycle analysis, simulations are be carried out at either fixed value of TET or fixed fuel flow rate;
For ideal cycle analysis, for a given fuel flow rate/TET, PR, ambient temperature and air flow rate, other parameters such as compressor exit temperature, exhaust gas temperature, thermal efficiency of the cycle etc. could be estimated. Also, the variations of each of these parameters with PR could be investigated.
It is also feasible to investigate the variations of the optimal PR and the theoretical maximum net work output of the cycle against the TET value.
In the real engine cycle analysis, simulations could be carried out with compressor and turbine isentropic efficiencies only implanted in the engine model. Combustion efficiency as well as pressure losses in both the combustion chamber and the exhaust process could be implanted in the engine model for simulation.
In both the ideal cycle and the real cycle simulation analysis, it is possible to write simulated results to excel spreadsheet for further analysis.
5.
SOFTWARE VALIDATION,
APPLICATION AND RESULTS
The developed software is validated by comparing its output with those of a real field data. The design point parameters of the engine (MS5001PA gas turbine engine) which field data is used for the validation are presented in Table 1.
[image:4.595.52.283.76.246.2]From the engine design data, employing a mechanical efficiency of 97% at the power generation end, the net power output of the plant will be 27.66MW. Also, from the value of the heat rate, the thermal efficiency of the plant is 28.38% while the rate of heat input into the plant is estimated as 97.48MW. Assuming the fuel to be natural gas with lower calorific value of 47.14MJ/kg, the fuel flow rate and the specific fuel consumption are 2.07kg/s and 0.0748kg/(MW-s). The engine design data could also serve as a means for testing the validity of the software developed; hence both data are employed for validating the software.
Table 1: Design Point Parameters of Engine used as Case Study [16]
NO. Parameter Symbol Unit Value
1 Power output
W
MW 26.832 Heat Rate HR kJ/(kW-hr) 12,687
3 PR
p
r
- 10.54 Air flow rate
a
m
kg/s 125.25 Turbine speed
N
rpm 51006 Exhaust
temperature
T
4K 756
5.1
Software Validation
[image:4.595.319.538.97.206.2]The parameters compared are the net power output, the thermal efficiency and the exhaust gas temperature. The field data used for comparison are average values recorded over one year of engine operation. To obtain the simulation results, certain engine operation data and other assumed data will serve as input data in the developed software. The input data used for the simulations for comparison with the field data / for comparison with the engine design data are presented in Table 2, under Value I and Value II respectively. The ambient temperature, ambient pressure, pressure ratio, and the working fluid flow rate define part of the engine operation conditions and are part of the field data. Fuel flow rate is also read, thus the simulations are carried out at fixed fuel flow rate.
Table 2: Input Data for Performance Simulation
NO. Parameter Symbol Unit Value I Value II
1 Ambient temperature T1 K 301 288
2 Ambient pressure P1 bar 1.012 1.0
3 Pressure ratio
p
r
- 10.5 10.54 Air flow rate
a
m
kg/s 98.7 125.25 Fuel flow rate
f
m
kg/s 1.76 2.076 Compressor isentropic
efficiency
C,i% 85 85
7 Turbine isentropic
efficiency
T,i% 90 90
8 Combustion efficiency
cc
% 90 909 Combustion pressure
loss
P
23% 5 5
10 Exhaust pressure loss
41
P
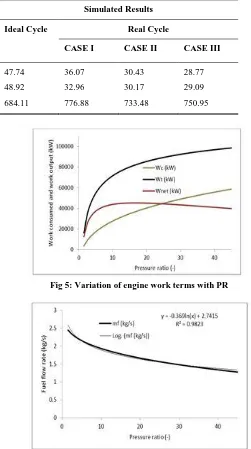
% 5 5Simulation results are obtained using the ideal cycle as well as the real cycle. In the real cycle, three cases are considered. The first case considers only isentropic efficiencies of the compressor and the turbine, the second case included combustion efficiency while the third case also incorporated pressure losses in the combustor and exhaust process. Table 3 shows the field data and the results from the software for comparison while Table 4 shows the engine design data and the results from the software for comparison.
From Table 3, the field data values for the net work output and the thermal efficiency are higher than the simulated values, but the simulated values are closer to the field data in case III where isentropic efficiencies of compressor and turbine, combustion efficiency and pressure losses are incorporated. The simulated exhaust gas temperature is lower than that obtained from the field. The same trend is found in table 4 where simulated data is compared with engine design
in a C a T in
NET a
th
q
w
w
q
w
, ,,
i T i T a
T
w
[image:4.595.301.555.384.567.2]data. The higher field data values means the losses in components implanted is less than the actual losses in these components. The exhaust gas temperatures are lower in case
[image:5.595.58.526.134.243.2]II than in case III of the simulated results because in case III pressure loss in the exhaust process is considered, but this is not considered in case II. Thus, the exhaust gas temperature value of case II is far from field data/engine design data.
Table 3: Field data and simulated data for comparison and software validation
NO. Parameter Unit Field
Data
Simulated Results
Ideal Cycle Real Cycle
CASE I CASE II CASE III
1 Net Power Output MW 21.05 38.89 29.32 23.82 22.02
2 Thermal Efficiency % 25.52 48.92 36.88 30.09 26.57
[image:5.595.55.504.264.762.2]3 Exhaust gas temperature K 783 710.37 806.88 762.02 780.18
Table 4: Engine design data and simulated data for comparison and software validation
NO. Parameter Unit Engine
Design
Data
Simulated Results
Ideal Cycle Real Cycle
CASE I CASE II CASE III
1 Net Power Output MW 27.66 47.74 36.07 30.43 28.77
2 Thermal Efficiency % 28.38 48.92 32.96 30.17 29.09
3 Exhaust gas temperature K 756 684.11 776.88 733.48 750.95
Tuning engine model to predict field data accurately requires adaptation of the engine model which is not considered in this work. But, the closeness of the simulated results and the field/engine design data validates the developed software.
5.2
Simulation Results
Results of the variation of different parameters with PR are presented here. These include the variation of compressor exit temperature, exhaust gas temperature, compressor work, turbine work output, the net work output of the cycle, the heat input, the heat rejected and the thermal efficiency of the cycle with the PR, all on the ideal cycle basis. These simulations are carried out at fixed TET value hence the variation of the fuel flow rate with PR is also obtained. Fixing the fuel flow rate, the variation of TET with PR is obtained. Also investigated here are the effects of TET on the optimal PR and on the maximum net work output respectively. The various results are shown in Figures 4 to 10.
[image:5.595.289.540.275.724.2]Fig 4: Variation of Compressor Exit Temperature and
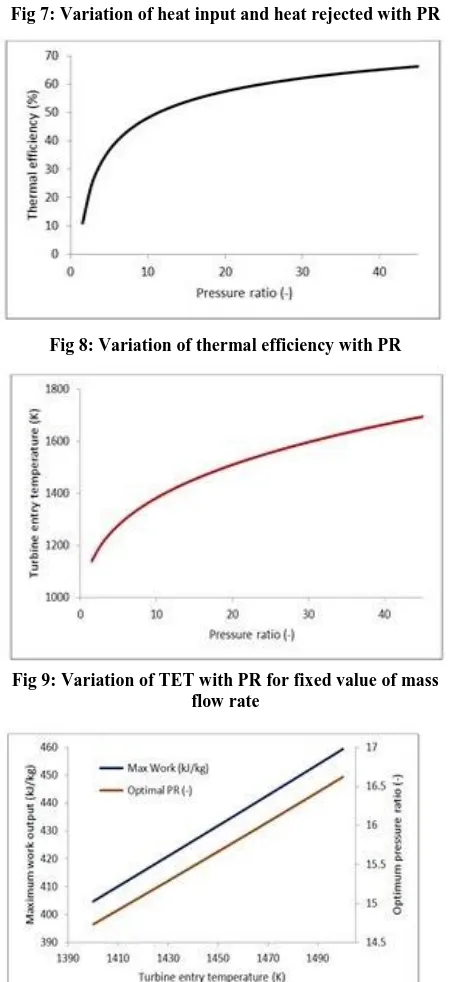
[image:5.595.58.282.596.743.2]Fig 5: Variation of engine work terms with PR
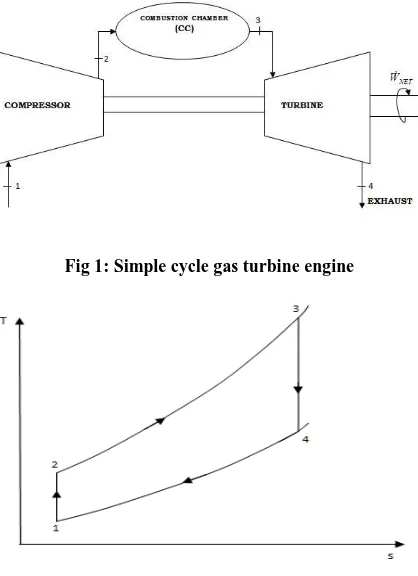
Fig 7: Variation of heat input and heat rejected with PR
Fig 8: Variation of thermal efficiency with PR
Fig 9: Variation of TET with PR for fixed value of mass flow rate
Figure 10: Variation of optimum PR and maximum net work output with TET
The Variation of compressor exit temperature and exhaust gas temperature with PR is shown in Figure 4. The compressor
exit temperature increases continuously with PR because more work is done on the working fluid with increase in PR. The exhaust gas temperature on the other hand decreases with PR for fixed TET value because at higher PR values the TET value is achieved faster.
Figure 5 shows how compressor work absorbed, turbine work output and the net work output of the plant varies with PR. The power absorbed by the compressor increases with the PR. Also, the turbine work output increases with increase in PR. The response of the network output to the PR depends on the rates of increase of the work absorbed by the compressor and the work output of the turbine. The rate of increase in the work absorbed by the compressor is greater than that of the turbine work output. Hence, the net work output increases to a maximum value and drops with further increase in the PR. The maximum net work output occurs when the optimum PR given by Eq. (12) is obtained.
The fuel flow rate drops with increase in PR as shown in Figure 6. This is because the compressor exit temperature increases with PR hence less heat is required to achieve the fixed TET value as PR increases. The variation of fuel flow rate with PR is modeled with a logarithm function (not linear) and regression coefficient of 0.9823 is obtained as in Figure 6. The heat input, like the fuel flow rate decreases with PR in the same manner as the fuel flow rate. The heat rejected also decreases with PR because of lower exhaust gas temperatures obtained at higher PR values as in Figure 7. The thermal efficiency of the plant depends on the PR and the ratio of specific heat capacities only; hence it increases continuously with PR. The thermal efficiency is actually computed as the ratio of the net work output which increases to a maximum value before dropping slowly and the heat input which drops continuously with PR. Thus, the thermal efficiency increases continuously with PR, with the rate of increase higher at lower PR values where net work output is increasing and heat input is decreasing as shown in Figure 8.
The variation of TET with PR for fixed value of mass flow rate is shown in Figure 9. The TET increases with the PR if the fuel flow rate is fixed because the temperature at the compressor exit increases with PR thus burning same fuel at higher PR values leads to higher TET values. When the fuel flow rate is fixed in the developed software, it is possible to investigate the variation of the optimal PR and the maximum net work output with the TET value. Both the optimal PR and the maximum net work output increase with the TET in the same manner as shown in Figure 10. The TET value is limited by the metallurgical considerations of the blade materials. Once the TET value is set, the design PR may be very close to the optimal PR. Although, the simulation results obtained here are applicable to ideal cycle engines, they do serve as guides in the real engine design process and the software developed in this research is a useful tool in obtaining these pre-design results.
6.
CONCLUSIONS
those from the field and engine design point. The results from the software for real cycle calculations closely approximate those from the field and the design data thus validating the software. More accurate results can only be obtained through adaptation.
The developed software was used to produce engine performance results based on ideal cycle operations- showing basically how different parameters vary with the PR for fixed value of TET. While thermal efficiency increases continuously with PR, the net work output increases to a maximum at the optimum PR and decreases with further increase in PR. The design PR for a real engine could be close to the optimum PR obtained but never exceeding it. Another set of important results obtainable from the software are the variations of the optimal PR and the maximum net work output with the TET for fixed mass flow rate. Both of these parameters increase with the TET. The TET is fixed in the design process and limited by the blade materials. But a higher TET value means higher value of maximum net work output. Preliminary results necessary for detailed engine design could be obtained from the developed software.
In this work, gas turbine performance software is developed. The software could carry out ideal gas turbine performance based on the Brayton cycle and real gas turbine operation performance. The latter exploits compressor and turbine isentropic efficiencies, combustion efficiency, combustion pressure loss and exhaust pressure loss which could be implanted in the ideal cycle together or separately. The software is tested using real engine operation data by comparing the power output, the thermal efficiency and the exhaust gas temperature obtained from the software for defined set of engine operation conditions with those from the field. The results from the software for real cycle calculations closely approximate those from the field. More accurate results can only be obtained through adaptation. The variations of various engine operation parameters with PR could be investigated using the developed software. Also, preliminary results necessary for detailed engine design could be obtained from the developed software.
7.
REFERENCES
[1] Y. A. Cengel and M. A. Boles, Thermodynamics: An Engineering Approach, 5th ed. NY: McGraw-Hill, 2009.Ding, W. and Marchionini, G. 1997 A Study on Video Browsing Strategies. Technical Report. University of Maryland at College Park.
[2] Y. A. Cengel and M. A. Boles, Thermodynamics: An Engineering Approach, 5th ed. NY: McGraw-Hill, 2009.Tavel, P. 2007 Modeling and Simulation Design. AK Peters Ltd.
[3] M. P. Boyce, GasTurbine Engineering Handbook, 4th ed. Waltham: Butterworth-Heinemann, 2012.Forman, G.
2003. An extensive empirical study of feature selection metrics for text classification. J. Mach. Learn. Res. 3 (Mar. 2003), 1289-1305.
[4] A. M. Y. Razak, Industrial Gas Turbines: Performance and Operability. Boca Raton, FL: Woodhead Publishing Limited, 2007.
[5] A. M. Y. Razak, Industrial Gas Turbines: Performance and Operability. Boca Raton, FL: Woodhead Publishing Limited, 2007.
[6] T. Korakianitis and K. Svensson, “Off-Design Performance of Various Gas-Turbine Cycle and Shaft Configurations,” J. Eng. Gas Turbine Power, vol. 121, pp. 649–655, 1999.
[7] J. Kurzke, “GasTurb 12 Design and Off-Design Performance of Gas Turbines.” Aachen, Germany, 2012.
[8] Y. G. Li and R. Singh, “An Advanced Gas Turbine Gas Path Diagnostic System-PYTHIA,” in The XVII International Symposium on Air Breathing Engines, Munich, Germany, 2005, pp. 1–12.
[9] J. J. Lee, D. W. Kang, and T. S. Kim, “Development of a gas turbine performance analysis program and its application,” Energy, vol. 36, no. 8, pp. 5274–5285, 2011.
[10]Y. G. Li, L. Marinai, V. Pachidis, E. Lo Gatto, and P. Pilidis, “Multiple-Point Adaptive Performance Simulation Tuned to Aeroengine Test-Bed Data,” J. Propuls. Power, vol. 25, no. 3, pp. 635–641, 2009. [11]A. Stamatis, K. Mathioudakis, and K. D. Papailiou,
“Adaptive Simulation of Gas Turbine Performance,” J. Eng. Gas Turbines Power, vol. 112, no. 2, pp. 168–175, 1990.
[12]V. M. Domkundwar, A Course in Internal Combustion Engines. New Dehli: Gagan Kapur, 2008.
[13]R. K. Rajput, Thermal Engineering, 6th ed. New Delhi: Pack Printers, 2006.
[14]G. F. Rogers and Y. Mayhew, Engineering Thermodynamics, Work and Heat Transfer, 4th ed. NY: Longman, 1992.
[15]D. P. S. Abam, Applied Engineering Thermodynamics. Lagos: University Publications Limited, 1997.Ding, W. and Marchionini, G. 1997.
![Table 1: Design Point Parameters of Engine used as Case Study [16]](https://thumb-us.123doks.com/thumbv2/123dok_us/9297359.427572/4.595.301.555.384.567/table-design-point-parameters-engine-used-case-study.webp)