Application of Information Systems to Decrease Traffic
Construction using CCTV Network Technology
Rachmat Iskandar
Politeknik TEDC
Jl. Politeknik, Jl. Pesantren No.2, Cibabat, Kec. Cimahi Utara, Kota
Cimahi, Jawa Barat 40513
Badie Uddin
Politeknik TEDC
Jl. Politeknik, Jl. Pesantren No.2, Cibabat, Kec. Cimahi Utara, Kota
Cimahi, Jawa Barat 40513
Dahlan
Politeknik TEDC
Jl. Politeknik, Jl. Pesantren No.2, Cibabat, Kec. Cimahi Utara, Kota
Cimahi, Jawa Barat 40513
ABSTRACT
The long-term goal of this research is to create a traffic density monitoring system along the Bandung city roads, using Google Maps API technology. The monitoring system will be designed by displaying location due to traffic situation. This application is intended for traffic officers who can manage traffic remotely in parsing traffic using CCTV technology that uses the Google map API facility.
The specific target to be achieved is to continue or develop the application of the Google Maps API technology by detecting traffic points and intersections in the city of Bandung in the event of an accident and rush hours when traveling to work and returning to work, causing traffic jams.
In this research method of literature study (library research) and field research (field research) approaches to the process of initial diagnosis and planning. For the implementation of system design and design, the architectural design process method approach is used to describe the system, the system environment, and the relationship between the system and its environment. For testing and evaluating the system, several stages of testing are used, namely functional testing of the system using a simulation method by making testing scenarios, and testing the quality of the system including testing of data communication is done testing scenarios. Interface evaluation is carried out approach to the questionnaire method intended to measure whether the system can meet the desires of traffic officers or not. This system works with sensors that detect the queue length of the vehicle. There are three sensors that will detect the queue length of vehicles on each lane. If the vehicle queue reaches the first sensor, the time given on the green light is 5 seconds longer than the normal time on the lane. If the vehicle queue reaches the second sensor then the time given to the green light is 10 seconds longer than normal time and if the vehicle queue has reached the third sensor the system will give a green light time which is 15 seconds longer than normal time. In this adaptive traffic light control system, there are two congestion sensors which are placed in the middle of the four-lane intersection that will turn on all the red lights if something unexpected happens like when an accident occurs in the middle of an intersection. With this adaptive traffic light control system the longest time the vehicle queue is 81 seconds, if all sensors on each line work and the fastest time is 45 seconds, the time when normal. CCTV cameras as a support that can be monitored by officers without having to be in a traffic jam location.
General Terms
Pattern Recognition, Security, Algorithms.
Keywords
Traffic jam, then, Google Maps API.
1.
INTRODUCTION
The increasing number of vehicles makes traffic more congested, especially in big cities. Therefore we need a device that can adjust the duration of the traffic lights automatically based on the amount of vehicle density per lane.
In general, traffic light uses a fixed time system. Vehicle on a the path can run if the allotted time has reached the waiting time limit determined. The system has disadvantages, because of the number of vehicles that pass through a path to an intersection varies with time. So during rush hour vehicles have to wait a long time on one lane, while other lanes do not and even sometimes there are lanes that have no vehicles at all.
Based on data obtained from the Central Statistics Agency (BPS), the current number of vehicles such as sedans or non-public passengers is 117,737 that passes through parallels and public vehicles as many as 2,374 not to mention other types of vehicles, so that congestion often occurs everywhere. Therefore the function of the traffic lights is very important to be regulated or controlled either automatically or manually. To overcome this we need a system that can provide more time on a lane according to the level of vehicle density. Many traffic control systems flexible light that has been designed. One of them is controlling traffic light using Google map API technology. By knowing the number of vehicles in a lane compared to other lanes, the traffic line will change to turn green with the help of CCTV that receives data from the sensor queue and sends it to the traffic light. The communication system created using the Google Map API technology will send data as commands made to the Arduino microcontroller via a smartphone. Data received by the microcontroller is data to set the mode of the traffic light.
In addition, there is a traffic control system that is controlled remotely. This system works using a video camera to monitor the flow of traffic through moving images. The image will be sent by the transmitter in the traffic light to the receiver in the control center via Ultra Hight Frequency (UHF). The operator will change the duration of the lights on the traffic light according to observations made from the video camera. The microcontroller executes the data and sends a confirmation in the form of the same data to the computer.
35 where the red and green lights in each phase have a time
difference. In automatic conditions the system works in 4 conditions, namely: empty conditions, solid conditions, priority conditions, and emergency conditions. Furthermore, the system controls traffic light automatically. Traffic light system This automatic is based on Arduino microcontroller as the main system controller. System This works by using sensors mounted on the side of a crossroads. Sensor This is used to detect the number of vehicles waiting in line at the intersection traffic light. The system is also equipped with sensors that detect a jam due to a buildup of vehicles and accidents.
2.
THEORY BASIS
In Law No. 22 of 2009 traffic is defined as the movement of vehicles and people in the Road Traffic Room, while what is meant by the Road Traffic Space is infrastructure intended for moving vehicles, people and / or goods in the form of Roads and facilities supporters. The government has a goal to realize traffic and road transportation that is safe, safe, fast, smooth, orderly and orderly, convenient and efficient through traffic management and traffic engineering. The procedures for traffic on the road are regulated by laws and regulations concerning the direction of traffic, priority of using the road, traffic lanes, traffic lanes and flow control at the intersection. There are three components of the occurrence of traffic, namely humans as users, vehicles and roads that interact with each other in the movement of vehicles that meet the eligibility requirements of drivers driven by traffic rules set according to applicable regulations.
2.1. Traffic congestion
Traffic congestion is a condition or situation that occurs in one or several traffic segments, where the flow of vehicles moves very slowly and even stops so that it disrupts the activity and movement of road users. The understanding of traffic congestion according to the Big Indonesian Dictionary is the stagnation of the traffic even because of the number of vehicles that have exceeded the capacity of the highway.
Congestion is one of the main problems in the city of Bandung, West Java. The point of the traffic jam spreads in various places. From all existing points, the writer summarizes it into 25 locations. The causes vary, ranging from the presence of street vendors (PKL), public transportation that stops carelessly, illegal parking, congested traffic flow, narrowing of the road or bottle neck, the center of the crowd, to the lack of clarity of the police or Dishub officers against traffic violators.
Traffic jams in various locations are also different. But the majority of traffic jams occur morning and evening which is rush hour. There are severe traffic jams, but some are just choked up. The following points are at the center of traffic jams in Bandung and their causes:
1. Soekarno-Hatta Crossroad - Leuwipanjang Terminal
Cause: The public transportation is careless and small roads.
2. Soekarno-Hatta Crossroad - Leuwipanjang Terminal
Cause: Vehicles turning back in front of the terminal, irregular bus or angkot stops, the number of vehicles passing the road always increases
3. Intersection of Moch. Toha-BKR
Cause: Frequent public transportation and minibuses near
traffic lights, narrowing of the road, as well as the volume of vehicles from Jalan Moch Toha, BKR, and Peta.
4. Karapitan Street (in front of the Langlangbuana Campus)
Cause: The number of vehicles in and out of campus, public transportation to use up half the road, the high volume of vehicles coming from Jalan Moch Ramdan, Gurame, and Pungkur 5. T-junction Setiabudi-Gegerkalong
Cause: Heavy traffic flow from three directions
Congestion can occur when triggered by factors that cause a problem in traffic, including the following:
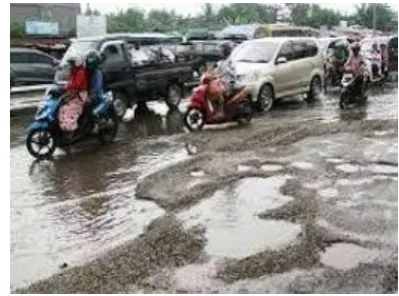
1. Highway Quality
[image:2.595.326.526.299.447.2]The quality of the road is one of the factors that causes congestion such as: damage to the whole or part of the road and the use of the road used is not in accordance with its intended purpose
Figure 2.1. Congestion is caused by road damage. Source: (tribunjabar.com)
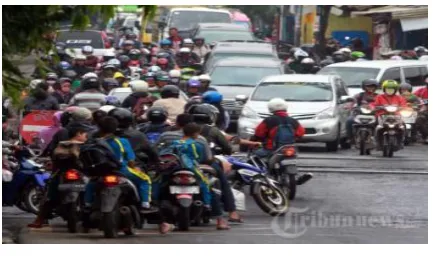
2. Number of vehicles that exceeds the capacity of the road Various things related to the condition of the vehicle can be a cause of congestion namely the type of vehicle, the size of the vehicle, the quality of the passing vehicle and the number of vehicles that have exceeded the capacity of the vehicle that can be accommodated by the highway.
Figure 2.2. Number of vehicles that exceeds the capacity of the road. Source: (tribunjabar.com)
3. Attitudes, Behaviors and Habits of Road Users
[image:2.595.324.536.545.675.2]parts that causes traffic jams and even traffic accidents.
Figure 2.3. Road users customers
Source: (tribunnew.com)
Congestion is a condition where the flow of traffic that passes on the road segment that is reviewed exceeds the capacity of the road plan which results in the free speed of the road segment approaching 0 km / hour or even being 0km / hour resulting in a queue.
2.2. Trafiic Light
Traffic light is a device controlling traffic flow using lights that are installed at a crossroads. The aim is to regulate the flow of traffic at each intersection so that it can run regularly and not collide with each other.
Traffic lights were known for the first time in 1868. The system used gas installed in Westminter England. Then in 1918 in New York, with the red, yellow, green format that was operated manually. In 1926 a semi-automatic lamp operation was conducted in wolverhampton England. Broadly speaking, traffic light is used as a regulator of traffic flow, preventing traffic jams at intersections, providing opportunities for other vehicles / pedestrians and minimizing vehicle conflicts.
Currently the traffic light settings that are used still use a standalone system. Where the length of time the green and red lights are set constantly or a fixed time. So this system is not in accordance with the conditions that occur in traffic the vehicle volume varies each time. This traffic light system is not non-conforming to traffic conditions. Adjusting traffic light is the length of time a vehicle waits can change according to the density level in each lane.
2.3. Google Map API
Google Maps API (Application Programming Interface) is an API provided by Google to use Google maps (Google Map) in applications that the authors build. The Google Maps API allows authors to modify the map and the information it contains.
Google Maps is Google's free service that is quite popular. Authors can add Google Maps features in the author's own web with the Google Maps API. Google Maps API is a JavaScript library. Using / programming the Google Maps API is very easy. What is needed is knowledge of HTML and JavaScript, and an Internet connection. By using the Google Maps API the writer can save time and money to build a reliable digital map application, so that the writer can focus only on data. Interaction with Google Maps API maps can be done in several ways, including with methods such as: setCenter (), panTo () and zoomIn (). Besides methods, the Google Maps API also supports event listeners.
2.4. CCTV
A video camera that sends a signal to a certain place on a device such as a monitor. Unlike television broadcasts, on CCTV the signal is not done openly though it can be possible with point to point (P2P), point to multipoint, or wireless mesh links. CCTV is often used for surveillance in areas that may need monitoring such as surveillance in areas that may need monitoring such as banks, casinos, airports, military installations and shops, and can even be an important tool in distance education.
2.5. WLAN Network
Wireless Local Area Network (WLAN) is a computer network that uses radio waves as a data transmission medium. Information (data) is transferred from one computer to another without using a cable as an intermediary media. WLAN is often referred to as a wireless network or wireless network (Budisetyo. 2010).
2.6. Arduino
Arduino is an open-source single-board micro controller, derived from the Wiring platform, designed to facilitate the use of electronics in various fields. The hardware has the Atmel AVR processor and the software has its own programming language. The language used in Arduino is not a relatively difficult assembler, but C language is simplified with the help of Arduino libraries. This tool can be used to realize electronic circuits from simple to complex.
2.7. Infrared Sensor
Infrared sensor is an electronic instrument used to detect certain characteristics that are around it by emitting and / or detecting infrared radiation. Infrared sensors are also able to measure the heat emitted by objects and the detection of object motion.
2.8. Smartphones
According to Desmira et al in (Mayasari (2016: 7), Application Software on smart cellphones was developed by the operator of the device itself or a third party participating in developing for commercial purposes. "Smartphone is a device that allows communication
3.
SYSTEM DESIGN
[image:3.595.317.542.584.705.2]Figure 3.1 is a block diagram of the system running. The infrared sensor will detect the vehicle in each lane. The output from the sensor will then be sent to the PLC and to process the data which is then forwarded to each path and set the LED to be lit as the last light
Figure 3.1. block diagram design system
3.1
System planning
37 detect the level of traffic jams from each path. The system is
[image:4.595.69.265.107.270.2]also equipped with sensors in the middle of the junction to detect total traffic jams at the junction.
Figure 3.2 Sketch of traffic light sensor placement planning
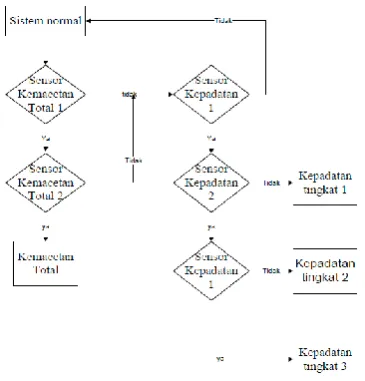
Description of traffic light settings can be seen in the diagram Figure 3 Traffic light settings are divided into three levels, namely normal systems, sensor systems (density systems) on the path and total congestion. If the system operates under normal conditions, then there is no priority over certain pathways. When the system operates in total jam mode, all lines are closed. This means that all vehicles are not allowed to cross the intersection.
[image:4.595.330.526.157.285.2]The density system (sensor system) is divided into three sub-systems, namely density level 1, density level 2 and density level 3. Three sensors installed in each lane are used to determine the density level of vehicles waiting in line
Figure 3.3. flow diagram of the traffic light settings
3.2
Hardware Design
In this system, Arduino is used as the main device for controlling traffic lights. This system has 14 traffic density control sensors, 12 sensors on the four lanes and 2 at the mid-traffic light and 12 mid-traffic light lights. Figure 3.4 shows a series of connection sensors, LED lights with Arduino. The voltage source comes from the Arduino power supply. The system works when the infrared and photodioda are blocked by the vehicle. C9013 functions as a switch, if the infrared circuit works C9013 will send a signal to Arduino. If there is no signal from the infrared circuit, then Arduino will run the
nomal system, if Arduino receives a signal from infrared, Arduino will run the total density or traffic jam system. LED functions as an indicator of Traffic Light. DI (digital input) and DO (digital output) are used as a link between hardware and software /
programs
. Meanwhile, CCTV monitors traffic density so that officers can control Light traffic manually.Figure 3.4. flow diagram of the traffic light settings
3.3
Software Design
[image:4.595.75.258.418.609.2]The design of a normal system traffic light setting program starts with red lights
flashing
on all lanes for a few seconds. Then, the green light flashes (the red light on the lane goes out) on one of the lanes. After the green light turns off, the yellow light will turn on. Finally the red light will come back to life, after the yellow light goes out. Then the system will repeat on the next path. In a density system, the green light on thelines
whose vehicle queue reaches the sensor will live longer according to the number of active sensors. Whereas the total traffic jam system will turn on all the red lights on all lanes. Table 1 shows the time programmed for each system.Table 1 design time setting for traffic light
Lamp
Time allocated
Normal Density System
Total Traffic
Sens or 1
Sensor 2
Sensor 3
Congestion Sensor
Red
7 Sec - - -
Unlimited
Yellow
1 Sec - - - -
Green
7 Sec 12
Sec 17 Sec 22 Sec
-
[image:4.595.309.550.460.626.2]1. Sensor 1 will be activated if the vehicle is continuously blocking for 5 seconds or more.
2. Sensor 2 will be activated if the vehicle has been blocking the sensor for 5 seconds continuously and sensor 1 is still active.
3. Sensor 3 will be active if the vehicle has been blocking the sensor for 5 seconds continuously and sensor 1 and sensor 2 are still active. If the total crash sensor is active, it will turn on all red lights. These sensors will work when the vehicle stops mid-junction, preventing both sensors being installed at mid-junction for 1 minute continuously. The sensor will be deactivated if it is not stopped continuously for 30 seconds.
4.
RESULTS AND DISCUSSION
1. Calculation of Normal System Waiting Time If the system is operating normally, then the waiting time of a vehicle waiting in line is as follows:
3 x Green Time + 3 x Yellow Time + 4 x Red Time together
3 x 7 seconds + 3 x 1 second + 4 x 7 seconds = 45 seconds
From the above calculations it can be seen the length of time the vehicle waits for the turn of the green light is for 45 seconds when the normal system is working
Estimated Waiting Time for Density System In density mode, when a sensor is on a lane or more active, the vehicle's waiting time will increase. Additional time is given if only an active sensor is 5 seconds. If only a sensor is active (in this case sensor 1 on any path), the waiting time will increase by five seconds to 50 seconds. The longest waiting time is reached when the condition of all sensors in the path other than the queue is active. This will give
additional
time for 3 x 12 seconds = 36 seconds, or the total waiting time is 45 seconds + 36 seconds = 81 seconds.The waiting time of a vehicle will differ depending on the queue line and the number of active sensors on the lane other than the queue line. Here is an example of estimating the calculation of the waiting time.
Line condition 1, sensor 1 active
Line condition 2, sensor 1 and sensor 2 are active Line condition 3, no active sensors
Line condition 4, sensor 1, sensor 2 and sensor 3 are active Vehicle waiting time:
On line 1 = 45 seconds + 5 x 5 seconds = 70 seconds On line 2 = 45 seconds + 4 x 5 seconds = 65 seconds
On line 3 = 45 seconds + 6 x 5 seconds = 75 seconds
On line 4 = 45 seconds + 3 x 5 seconds = 60 seconds 2. Waiting Time for Total Congestion System When this system works, all red lights will turn on. This means that all vehicles waiting in line are not allowed to pass through the intersection. New vehicles may cross the intersection when the system is inactive (returning to the normal system or the density system). The length of time the vehicle waits when the total jam system is active is not determined. It depends on the traffic jam condition at the intersection. If by some reason (for example a vehicle crash) congestion can be resolved after an hour, so long as the vehicle has to wait. In this design do not use the types of lights that are actually used in the traffic light that has been used. The lamp used is LED, this is to facilitate hardware testing. In addition, the use of actual lights will not change the design of programs that have been designed.
3.
SECTIONS
The conclusions obtained in this study are:
1. The application unravels traffic by controlling the traffic light is designed to work based on sensors installed in the lanes and intersections.
2. The system is designed to operate in three conditions, namely: normal system, system density and total system congestion.
3. The minimum waiting time for vehicles in a lane is 45 seconds and the maximum waiting time for vehicles in a lane is 81 seconds..
4.
REFERENCES
[1] Afit Al-Farit, Rachmadi, M. Febrian Masum, M. Anwar, Wibowo Adi, Jatmika Wisna, 12 November 2011, Implementasi Prototipe Sistem Pengaturan Lampu Lalu Lintas Terdistribusi Dengan Optimasi Pengenalan Dan Penjejakan KendaraanBerbasis Pemrosesan Video, KNS & I11-039
[2] Tjia May On, Mardjoko Pono Budi, Martanto Nato, Sistem Pengaturan Lampu LaluLintas Secara Sentral dari Jarak Jauh,Jurnal Teknik Elektro,Vol. 9, No. 27, 71-78, Oktober 2007
[3] Handry Khoswanto, Lim Resmana, Ling Budy Lie Sin, Traffic Light ControllerMenggunakan Media RF, Jurnal Teknik Elektro, Vol.5, No.1, 25-31, 2005
[4] Basuki Ahmad, Jozua F dan Fatchurrochman. 2005. Pengolahan Citra Digital Menggunakan Visual Basic. Yogyakarta : Graha Ilmu.