Kiloparsec-scale gaseous clumps and star formation at
z
=
5–7
S. Carniani,
1,2R. Maiolino,
1,2R. Amorín,
1,2L. Pentericci,
3A. Pallottini,
1,2,4,5A. Ferrara,
5C. J. Willott,
6R. Smit,
1,2J. Matthee,
7D. Sobral,
7,8P. Santini,
3M. Castellano,
3S. De Barros,
9,10A. Fontana,
3A. Grazian,
3and L. Guaita
111Cavendish Laboratory, University of Cambridge, 19 J. J. Thomson Ave., Cambridge CB3 0HE, UK 2Kavli Institute for Cosmology, University of Cambridge, Madingley Road, Cambridge CB3 0HA, UK 3INAF - Osservatorio Astronomico di Roma, via Frascati 33, 00078 Monteporzio, Italy
4Centro Fermi, Museo Storico della Fisica e Centro Studi e Ricerche ‘Enrico Fermi’, Piazza del Viminale 1, Roma, 00184, Italy 5Scuola Normale Superiore, Piazza dei Cavalieri 7, 56126 Pisa, Italy
6NRC Herzberg, 5071 West Saanich Rd, Victoria, BC V9E 2E7, Canada
7Leiden Observatory, Leiden University, PO Box 9513, NL-2300 RA, Leiden, The Netherlands 8Department of Physics, Lancaster University, Lancaster, LA1 4YB, UK
9Observatoire de Genève, Université de Genève, 51 Ch. des Maillettes, 1290 Versoix, Switzerland 10INAF–Osservatorio Astronomico di Bologna, via P. Gobetti 93/3, I-40129, Bologna, Italy
11Núcleo de Astronomía, Facultad de Ingeniería, Universidad Diego Portales, Av. Ejército 441, Santiago, Chile
13 December 2017
ABSTRACT
We investigate the morphology of the [Cii] emission in a sample of “normal” star-forming
galaxies at 5<z<7.2 in relation to their UV (rest-frame) counterpart. We use new ALMA observations of galaxies atz∼6−7, as well as a careful re-analysis of archival ALMA data. In total 29 galaxies were analysed, 21 of which are detected in [Cii]. For several of the latter the [Cii] emission breaks into multiple components. Only a fraction of these [Cii] components,
if any, is associated with the primary UV systems, while the bulk of the [Cii] emission is associated either with fainter UV components, or not associated with any UV counterpart at the current limits. By taking into account the presence of all these components, we find that the L[CII]-SFR relation at early epochs is fully consistent with the local relation, but it
has a dispersion of 0.48±0.07 dex, which is about two times larger than observed locally. We also find that the deviation from the local L[CII]-SFR relation has a weak anti-correlation
with the EW(Lyα). The morphological analysis also reveals that [Cii] emission is generally
much more extended than the UV emission. As a consequence, these primordial galaxies are characterised by a [Cii] surface brightness generally much lower than expected from the local Σ[CII]−ΣSFRrelation. These properties are likely a consequence of a combination of different
effects, namely: gas metallicity, [Cii] emission from obscured star-forming regions, strong
variations of the ionisation parameter, and circumgalactic gas in accretion or ejected by these primeval galaxies.
Key words: galaxies: evolution - galaxies: high-redshift - galaxies: ISM
1 INTRODUCTION
The morphological investigation of galaxies in the early Universe can provide important information on their formation and evolu-tionary processes. For instance, a disturbed and multi-clump mor-phology, especially in the cold phase, may suggest the presence of disc instabilities, and can give indication of feedback processes, as well as minor and/or major merger events during the galaxy assem-bly (e.g., Tamburello et al. 2015; Fiacconi et al. 2016; Ceverino et al. 2017; Pallottini et al. 2017b,a). In this context, the advent of facilities delivering high angular resolution observations has en-abled us to probe the internal structure of galaxies in the distant Universe, revealing that clumpy morphologies are more common at
higher redshift than atz=0 (e.g. Förster Schreiber et al. 2006; Gen-zel et al. 2008). For instance, the fraction of galaxies at 0.5<z<3 exhibiting kpc-scale clumps with sustained star-formation activity is higher than 30% (Ravindranath et al. 2006; Elmegreen et al. 2009; Guo et al. 2015). At higher redshifts the fraction of galax-ies showing disturbed morphology or multi clumps is even higher. on On a sample of 51 Lyαemitters (LAEs) and 16 Lyman break galaxies (LBGs) atz >5.7 Jiang et al. (2013) found that roughly half of the brightest galaxies (M1500<-20.5 mag) are made of multi-ple components that may be merging. Near-infrared (NIR) high-resolution imaging have also revealed that irregular shapes with multi-clump morphology are prevalent in LAEs and LBGs atz∼7
within the epoch of reionization (Ouchi et al. 2010; Sobral et al. 2015; Matthee et al. 2017; Bowler et al. 2017).
Additional identification of clumpy systems in the early epoch and a detailed characterisation of high-z clumps or satellites is fundamental to constrain galaxy assembly. The extended Atacama Large Millimetre/submillimetre Array (ALMA) configurations en-able us to reach high-angular resolution and exploit far-infrared (FIR) fine structure emission lines, such as [Cii] at 158µm, as
pow-erful diagnostics to assess the morphology of primeval galaxies. [Cii] is emitted primarily in the (mostly neutral) atomic and
molec-ular gas associated with Photon Dominated Regions (excited by the soft UV photons), but also in partly ionised regions and it is one of the primary coolants of the ISM. Indeed, it is generally the strongest emission lines observed in the spectra of galaxies. Since its first detection at high redshift (Maiolino et al. 2005) this tran-sition has then been detected in large samples of distant galaxies. However, until recently, the [Cii] emission was only detected in
ex-treme environments, such as quasar host galaxies and SMGs, char-acterised by SFRs of several hundred solar masses per year, not really representative of the bulk of the galaxy population at these epochs (e.g. Maiolino et al. 2009, 2012; De Breuck et al. 2011; Wagg et al. 2012; Gallerani et al. 2012; Carilli & Walter 2013; Carniani et al. 2013; Williams et al. 2014; Riechers et al. 2014; Yun et al. 2015; Schreiber et al. 2017; Trakhtenbrot et al. 2017; Decarli et al. 2017). Detecting [Cii] in “normal” galaxies has
re-quired the sensitivity delivered by ALMA. To date, the [Cii] line
has been detected in several galaxies atz > 5 and it is spatially resolved in most of these targets (Capak et al. 2015; Willott et al. 2015b; Maiolino et al. 2015; Knudsen et al. 2016; Pentericci et al. 2016; Bradaˇc et al. 2016; Smit et al. 2017; Carniani et al. 2017a; Matthee et al. 2017). Smit et al. (2017) recently presented [Cii]
ob-servations of two galaxies atz∼7 characterised by a gradient of velocity consistent with a undisturbed rotating gas disk. However, most of thez>5 galaxies show extended and clumpy [Cii]
emis-sion with velocities consistent with the systematic redshift of the galaxy (|∆vLyα|<500 km/s) but spatially offset relative to the rest-frame UV counterpart (Maiolino et al. 2015; Willott et al. 2015b; Capak et al. 2015; Carniani et al. 2017a,b; Jones et al. 2017b). In many cases these offsets have been ignored or ascribed to astromet-ric uncertainties. However, based on detailed astrometastromet-ric analysis, it has been shown that most of these offsets are physical (a revised analysis will be given in this paper), hence they should be taken as an important signature of the evolutionary processes in the early phases of galaxy formation. Various scenarios have been proposed to explain the positional offsets between [Cii] and star-forming re-gions such as stellar feedback clearing part of the ISM, gas accre-tion, wet mergers, dust obscuration and variations of the ionisation parameter (e.g. Vallini et al. 2015; Katz et al. 2017). Bariši´c et al. (2017) and Faisst et al. (2017) have recently found (rest-frame) UV faint companions whose locations is consistent with the displaced [Cii] emission, suggesting that the carbon line traces star-forming
regions where the UV light is absorbed by dust.
As mentioned, most previous studies have attempted to assess the nature of [Cii] emission in primeval galaxies neglecting the
positional offsets between the FIR line and rest-frame UV emis-sion. The goal of this paper is to assess the connection between [Cii] and SFR in the early Universe by taking into account the
multi-clump morphology of galaxies atz > 5 and by associating the components with their proper optical-UV counterparts (if de-tected). This is achieved by re-analysing ALMA [Cii] observations
ofz>5 star-forming galaxies, and by performing a detailed kine-matical analysis of the [Cii] line, in order to deblend the different
components of the multi-clump systems. In addition to previous ALMA observations, partly discussed in literature, we also make use of new ALMA data targeting fivez∼6 star-forming galaxies with SFR< 20 M yr−1. In Section 2 we detail the sample and
the analysis of ALMA observations. The morphological analysis is presented in Section 3, while the relation between the [Cii] and SFR
is discussed in Section 4. In Section 5 we investigate the connection between [Cii] luminosity and Lyαstrength in our sample. Section 6
focuses on the spatial extension of the [Cii] and UV emission and
the correlation between [Cii] surface brightness and SFR surface
density. We discuss the findings in Section 7, while the conclusions of this work are reported in Section 8
Throughout this paper we assume the following cosmological parameters:H0 =67.8 km s−1 Mpc−1,ΩM =0.308,ΩΛ=0.685
(Planck Collaboration et al. 2016)
2 SAMPLE, OBSERVATIONS AND ANALYSIS
2.1 Archival data
The sample is mainly drawn from the archive and literature by se-lecting only spectroscopically confirmed star-forming galaxies at
z>5 observed with ALMA in the [Cii] line. We limit our sample
to those systems with SFR. 100 Myr−1 since they are
repre-sentative of the bulk of the galaxy population in the early Universe (e.g. Robertson et al. 2015; Carniani et al. 2015). The list of se-lected sources is given in Table 1. The sample does not include lensed systems (Knudsen et al. 2016; González-López et al. 2014; Bradaˇc et al. 2016; Schaerer et al. 2015) since magnification factor uncertainties may lead to large errors on SFR and [Cii] luminosity
estimates, as well as on the morphology analysis.
For the purpose of our investigation, which focuses on the na-ture and implications of the positional offsets between [Cii] and UV
emission, we have retrieved and re-analysed ALMA data revealing a [Cii] detection at the systemic velocity of the galaxy (see Table 1).
For these objects, ALMA observations have been calibrated follow-ing the prescriptions presented in previous works.
Table 1.Overview of thez>5 star-forming galaxies observed with ALMA used in this paper, ordered by name.
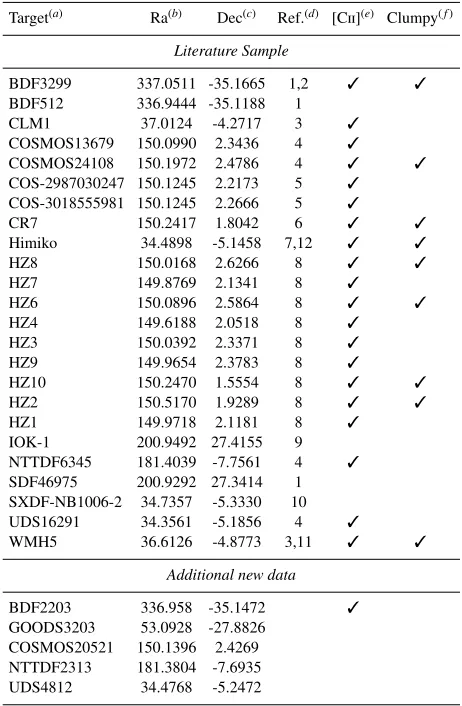
Target(a) Ra(b) Dec(c) Ref.(d) [Cii](e) Clumpy(f)
Literature Sample
BDF3299 337.0511 -35.1665 1,2 3 3
BDF512 336.9444 -35.1188 1
CLM1 37.0124 -4.2717 3 3
COSMOS13679 150.0990 2.3436 4 3
COSMOS24108 150.1972 2.4786 4 3 3
COS-2987030247 150.1245 2.2173 5 3
COS-3018555981 150.1245 2.2666 5 3
CR7 150.2417 1.8042 6 3 3
Himiko 34.4898 -5.1458 7,12 3 3
HZ8 150.0168 2.6266 8 3 3
HZ7 149.8769 2.1341 8 3
HZ6 150.0896 2.5864 8 3 3
HZ4 149.6188 2.0518 8 3
HZ3 150.0392 2.3371 8 3
HZ9 149.9654 2.3783 8 3
HZ10 150.2470 1.5554 8 3 3
HZ2 150.5170 1.9289 8 3 3
HZ1 149.9718 2.1181 8 3
IOK-1 200.9492 27.4155 9
NTTDF6345 181.4039 -7.7561 4 3
SDF46975 200.9292 27.3414 1 SXDF-NB1006-2 34.7357 -5.3330 10
UDS16291 34.3561 -5.1856 4 3
WMH5 36.6126 -4.8773 3,11 3 3
Additional new data
BDF2203 336.958 -35.1472 3
GOODS3203 53.0928 -27.8826 COSMOS20521 150.1396 2.4269 NTTDF2313 181.3804 -7.6935 UDS4812 34.4768 -5.2472
Notes.(a)Name of the source.(b, c)J2000 coordinates.(d)References in which ALMA observations are presented ( [1] Maiolino et al. 2015; [2] Carniani et al. 2017a; [3] Willott et al. 2015b; [4] Pentericci et al. 2016; [5] Smit et al. 2017; [6] Matthee et al. 2017; [7] Ouchi et al. 2013; [8] Capak et al. 2015; [9] Ota et al. 2014; [10] Ouchi et al. 2013; [11] Jones et al. 2017b [12] Carniani et al. 2017b)(e)Check mark,3, indicates that [Cii] emission has been detected at the redshift of the galaxy.(f)Check mark,3, indicates that the galaxy has a clumpy morphology.
GAIA and AllWISE catalogues, implying that, when a systemic (not physical) offset is seen, this is generally due to some small astrometric uncertainties in the optical-NIR data. These astromet-ric issues have been also discussed by Dunlop et al. (2016) who analysed ALMA images targeting the Hubble Ultra Deep Field. We therefore applied the astrometric shifts, which span a range be-tween 0.100
and 0.2500
, to the NIR images.
We note that additional systems with low SFRs have also been tentatively detected in 14 [Cii] line emitting candidates at 6<z<8
(Aravena et al. 2016), which are not included in this analysis as they are not spectroscopically confirmed yet and∼60% of these objects are expected to be spurious .
2.2 Additional new ALMA data
In addition to the archival/literature sample, we have also included new [Cii] observations of five star-forming galaxies atz∼6 with a
750 500 250 0 250 500 750
velocity [km/s]
1.5 1.0 0.5 0.0 0.5 1.0 1.5
flux [mJy]
BDF2203
Figure 1. ALMA spectrum of BDF2203 showing a new [Cii] detection. The velocity reference is set to the redshift defined by the Lyα. The dotted grey lines shows the 1σand -1σper channel. The red line indicates the best fit 1D Gaussian line profile.
SFR∼10 Myr−1observed with ALMA in Cycles 3 and 4 (P.I.
Pen-tericci). The five new sources, listed in Table 1, have been selected from a sample of>120 LBGs atz∼6−7. These have been spec-troscopically confirmed thanks to recent ultra-deep spectroscopic observations from the ESO Large Program CANDELSz7 (P.I. L. Pentericci; De Barros et al. 2017). The proposed ALMA programs aimed at observing [Cii] emission in ten star-forming galaxies at
z > 6 with UV luminosities lower than -21 mag (UV SFR< 20 Myr−1) and spectroscopic redshift uncertainties<0.03, but only
five galaxies have been observed. The observations and data cali-brations are presented in the Appendix A. We have registered NIR images to ALMA observations by matching the location of the fore-ground, serendipitous continuum sources and ALMA calibrators to the position given by the GAIA Data Release 1 catalogue (Gaia Collaboration et al. 2016).
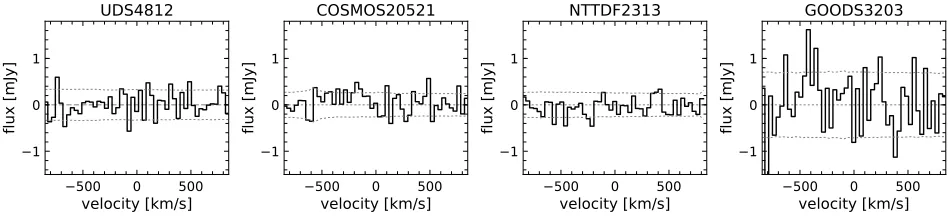
While the continuum emission is not detected at the location of any of the five galaxies, we detect two and one serendipitous sources in the COSMOS20521 and BDF2313 continuum maps, re-spectively. The positions of the serendipitous continuum sources is in agreement with the location of NIR foreground galaxies, thus confirming the astrometric shifts estimated from the catalogue.
The [Cii] emission is undetected in all but one of these sources,
that is, BDF2203. Figure 1 shows the spectrum of the detected [Cii]
emission, with a spectral rebinning of 40 km s−1, while the spectra of the non-detections are shown in the Appendix (Figure A1).
For the four non-detections, we assume a full-width-at-half-maximum of FWHM=100 km s−1, which is consistent with [C
ii]
line widths observed in otherz>6 galaxies (e.g. Pentericci et al. 2016; Carniani et al. 2017a,b), and we infer 3σupper limits on the [Cii] luminosity (Table A1).
The redshift of the [Cii] emission detected in BDF2203 is
z[CII] = 6.1224±0.0005, which is in agreement with that in-ferred from Lyα(zLyα = 6.12±0.03). By fitting a 1D Gaussian
profile to the [Cii] line we estimate a FWHM=150 ±50 km/s that is similar to those estimated in high-z[Cii]-emitting
galax-ies (FWHM=50-250 km/s; Willott et al. 2015b; Pentericci et al. 2016; Matthee et al. 2017; Carniani et al. 2017b). The flux map of the [Cii] line, extracted with a spectral width of 200 km/s,
is shown in Figure 2. The emission is detected in the map with a S/N=5 and has an integrated flux density of 140±35 mJy km/s, which corresponds to L[CII]= (12.5 ±2.5) ×107 L at
z=6.12. By fitting a 2D gaussian profile to the flux map, we mea-sure a size of (2.3±0.5)00×
(1.2±0.2)00
[image:3.612.46.277.135.488.2]22h27m50.5s 50.0s 49.5s -35°08'45"
50"
55"
09'00"
RA [J2000]
Dec [J2000]
22h27m50.2s50.1s 50.0s 49.9s -35°08'49"
50"
51"
52"
53"
RA [J2000]
[image:4.612.91.232.95.339.2]Dec [J2000]
Figure 2.Top: [Cii] flux map of BDF2203 obtained integrating the ALMA cube over the velocity range between -60 km/s and 132 km/s. Red solid contours are at levels of 2σ, 3σand 4σ, whereσ=23 mJy km/s. Dashed black contours indicate negative values at -3 and -2 times the noise level in the same map. Bottom: zoom of the central 2.500region around BDF2203.
[Cii] flux map contours are over imposed on the NIR image. Red contours are at the same levels as in the top panel. The ALMA synthesised beam in the lower left corner in both panels.
and a beam-deconvolved size of (1.4±0.8)00×
(0.5±0.4)00
with a PA=80 deg±20 deg. The [Cii] emission is thus marginally
re-solved and has a diameter size of∼5 kpc. The [Cii] flux map
over-laps with the rest-frame UV emission that has an extension of about 1 kpc. The centroids are separated by 0.2500
. However, given the ALMA beam size (1.9000 ×
1.1100
), such positional offset is consis-tent with the positional uncertainties∆θ≈<beam size>
S/N ∼0.2
00−0.400.
The low angular resolution and sensitivity of current observations are not sufficient to assess the morphology of the FIR line emission.
2.3 SFR estimates and morphology analysis
The continuum emission at rest-frame wavelengths around 158µm is associated to thermal emission from dust heated by the UV sion of young stellar populations in galaxies. The continuum emis-sion is detected only in four sources within the selected sample. When compared with the typical UV-IR SED of galaxies, the weak rest-frame far-IR continuum indicates that these galaxies are on av-erage characterised by low dust masses.
The spectral energy distribution (SED) of the thermal dust emission can be modelled with a greybody with dust temperature Tdand spectral index emissivityβ. However, one single photomet-ric measurement is not sufficient to perform the SED fitting and constrain the two free parameters. We thus assume Td=30K and β=1.5, which are consistent with those observed in local dwarf galaxies (Ota et al. 2014), to estimate the far-infrared (FIR) lumi-nosity from the ALMA continuum observations. For those galaxies that are not detected in ALMA continuum images we infer a 3σ upper limit on LFIR. We note that the FIR emission strongly
de-pends on the assumed dust temperature, yielding to a luminosity uncertainty of∆log(LFIR)=0.6 (Faisst et al. 2017).
For each galaxy we can infer the star-formation rate from both the UV (SFRUV) and FIR (SFRFIR) emission by adopting the calibrations presented in Kennicutt & Evans (2012). Excluding HZ9 and HZ10, all sources in the sample have SFRFIR/SFRUV/1 with an average value of SFRFIR/SFRUV ≈0.6 . Given that most of the FIR luminosity estimates are 3σupper limits, the average SFRFIR/SFRUVis actually much lower than 0.6.
Given the small contribution of SFRFIR (either in the IR-detected sources or those with upper limits), we assume total SFR≈SFRUVwith no dust correction for those galaxies without continuum detection. While we infer total SFR=SFRUV+SFRFIR for those galaxies revealing continuum emission at 158µm.
In order to assess the multi-clump morphology of the [Cii]
emission in our sources, we perform a kinematical analysis on the retrieved ALMA cube, extracting channel maps at different veloc-ities relative to the redshift of the galaxies. This analysis enables us to disentangle the emission of complex systems having multiple components at different velocities (e.g. Carniani et al. 2013; Riech-ers et al. 2014). We also estimate the size of the various UV and [Cii] emission by fitting a 2D elliptical Gaussian profile to
emis-sion maps and by taking into account the angular resolution of the observations.
The properties of the [Cii], FIR and UV emission, such as
red-shift, flux density, luminosity, SFR, and radius, are reported in Ta-ble 2
3 MULTI-COMPONENTS SYSTEMS
Carniani et al. (2017a) discuss the origin of the positional and spectral offsets between optical emission and FIR lines observed in high-zsystems, suggesting that the observational properties can arise from distinct regions (or components) of galaxies. In order to understand the nature of these offsets, we have re-analysed ALMA [Cii] observations for those galaxies showing [Cii] detections and
have performed a morphology analysis as discussed in Section 2.3. We have found a clear multi-clump morphology in nine out of 21
z>5 galaxies having [Cii] detections (Table 2). The UV rest-frame
images and [Cii] maps are shown in Figure 3, sorted by redshift. The stamps are 300
across, or∼17.5 kpc at the average redshift of this sample (<z>=6), and show the contours of the [Cii] maps,
obtained from our analysis, superimposed on the rest-frame UV emission in grayscale.
NewHSTnear-IR images of HZ6, HZ8, and HZ10 have al-ready been presented in Bariši´c et al. (2017) and Faisst et al. (2017) revealing multi-component structures. The location of the individ-ual rest-frame UV clumps is consistent with the peak positions of the [Cii] emission extracted at different velocities relative to the
redshift of the brightest component (which is labelled “a” in all stamps). The [Cii] emission detected in all individual clumps has a
level of significance1higher than 5σand it is spatially resolved (see Table 2). The channel map analysis confirms that HZ8b and HZ10b (Hz8W and Hz10W in previous works) are at the same redshift of HZ8a and HZ10a, respectively. We note that the kinematic prop-erties of HZ10 are consistent with the analysis reported by Jones et al. (2017a), who claim that the velocity gradient observed in this
1 σis the rms of the channel map in which we detect the [C
a
b
a
a
a
a
a
a
a
a
b
b
b
b
b
b
b
b
c
c
c
c
[image:5.612.58.533.92.582.2]L
Figure 3.Rest-frame UV images of the ninez>5 star-forming galaxies showing multi-clump morphology in [Cii] and/or rest-frame UV emission. The galaxies are ordered by redshift and each stamp is 300on the side, with North to the top and East to the left. The red, blue, and green contours show the [C
ii] channel maps at different velocity intervals. The levels of the contours and channel maps velocities are indicated in the legends. The properties of each galaxy are reported in Table 2.
galaxy matches a merger scenario rather than a rotating gas disk model.
The deeperHSTobservations reveal also two faint compan-ions close to the HZ2 galaxy within a projected distance of∼6 kpc. These sources are not discussed in previous studies (Capak et al. 2015; Bariši´c et al. 2017), since their redshifts were not fully spec-troscopically confirmed by the [Cii] line. However, a detailed
kine-matic investigation of the carbon line shows an extended emission with a morphology consistent with the rest-frame UV emission. Al-though the two faint companions are detected with a low level of significance (∼3.5σ), the match between the three UV peaks and the [Cii] emission supports the reliability of the ALMA detections.
The three sources, dubbed in this work as HZ2a, HZ2b and HZ2c, are at the same redshift and form a multi-component system sim-ilar to that observed in HZ6. The angular resolution and the low sensitivity of current ALMA observations are not sufficient to spa-tially resolve the [Cii] emission in HZ2b and HZ2c. HZ2a is instead
spatially resolved, with a diameter of 2.5 kpc.
An additional star-forming galaxy with a complex morphol-ogy is WHM5 atz=6.0695, which appears to consist of multiple components in [Cii]: a compact source, seen also in dust emission,
velocity of∼200 km/s. Both [Cii] emission components are
spa-tially resolved (∼1.3 and∼2.8 kpc) in the ALMA observations with an angular resolution of 0.300
(Jones et al. 2017b).
At higher redshift, the presence of multiple [Cii] components
has recently been reported in CR7 atz=6.6 by Sobral et al. (2015, 2017) and Matthee et al. (2015, 2017). Three out of four detected [Cii] clumps coincide with the location of UV clumps. In two cases
the [Cii] emission is spatially resolved with a radius of∼3−3.8
kpc (see Matthee et al. 2017 for details).
An additional multi-clump galaxy observed with ALMA is Himiko atz∼6.695 (Ouchi et al. 2013). The rest-frame UV image (see Figure 3 of Ouchi et al. 2013) reveals that the galaxy comprises three sub-components with SFR spanning in range between 5 and 8 Myr−1. The projected distance between the sources is of about
3-7 kpc. kpc. Out of the three sub-components have a LyαEW=68 Å while the other two have EW less than 8 Å. Although early ob-servations had reported non-detections of [Cii] in this source,
re-cently Carniani et al. (2017b) have reported a clear detection with extended/multi-clump morphology. The primary [Cii] emission is
coincident with the Lyα peak, while the UV clumps are much weaker in [Cii] or even undetected. More generally the extended
[Cii] emission does not resembles the UV clumpy distribution.
For the remaining systems (COS24108 and BDF3299) show-ing a clear positional offsets between [Cii] and UV emission in
Figure 3, we cannot speculate much more than what has been al-ready done in previous works due to the lack of deeper ALMA and/orHSTobservations. As discussed by Carniani et al. 2017a, these offsets are certainly associated with physically distinct sub-components, and the [Cii] clumps with no UV counterpart may
ei-ther be tracing star forming regions that are heavily obscured at UV wavelengths (Katz et al. 2017), or associated with accreting/ejected gas.
3.1 On the nature of the kpc-scale sub-components
The deeper [Cii] and rest-frame UV observations have unveiled the
real multi-component nature of nine star-forming galaxies atz>5 further highlighting and (partly) explaining positional offsets be-tween UV and [Cii] emission in previous studies (Capak et al. 2015;
Maiolino et al. 2015; Willott et al. 2015b; Pentericci et al. 2016; Carniani et al. 2017a). These results suggest that future evidence of displaced FIR line and UV emission should be not ignored since it generally reveals the presence of sub-components with different physical properties.
Such sub-components can be ascribed to either satellites in the process of accreting (Pallottini et al. 2017a) or clumps ejected by past galactic outflows (Gallerani et al. 2016). However, in many cases both the SFRUVand the size of the various sub-components are comparable to those estimated for the central galaxies, hence suggesting a major merger scenario in many cases. Future ALMA observations with higher resolution and sensitivity are necessary to detect further sub-components in these and other systems and to perform a detailed dynamical analysis, which allow us to to esti-mate the dynamic mass and assess the nature of sub-components.
4 THE L[CII]- SFR RELATION AT Z=5–7
A tight relation between the [Cii] luminosity and the global SFR
is seen in local galaxy observations, at least when excluding ex-treme (ULIRG-like) cases (De Looze et al. 2014; Kapala et al. 2015; Herrera-Camus et al. 2015). This finding makes the [Cii]
line a promising tool to investigate the properties of early galax-ies and to trace their star formation. However, the behaviour of the [Cii] line emission atz >5 seems to be more complex than
ob-served in the local Universe. Previous studies have shown that only a fraction of [Cii] detections of early galaxies agree with the
lo-cal relation, while most high-zgalaxies are broadly scattered, with claims that most of them are [Cii]-deficient relative to the local
re-lation. However, most of previous high-zstudies classified multi-component systems as single objects in the L[CII]-SF diagram. If we associate each clump and/or galaxy with its proper UV counter-parts (or lack thereof), then the resulting location on the L[CII]-SFR diagram changes significantly for these objects
Figure 4 shows L[CII] as a function of SFR. The green line illustrates the local relation obtained by De Looze et al. (2014) and its dispersion is given by the shaded area. Results forz > 5 galaxies, as listed in Table 2, are shown with various symbols in Figure 4. The SFR estimation for the z > 5 galaxies (and their sub-components) is discussed in Section 2.3. The multiple-component objects (HZ2, HZ6, HZ8, HZ10, WHM5, Himiko, CR7, COS24108, and BDF3299) are split into several individual com-ponents with their own SFRs and L[CII]. The nine complex sys-tems discussed in Section 3 are broken into 20 sub-components distributed on different regions of the L[CII]-SFR plane. The loca-tion of the individual subcomponents is indicated with yellow stars, while the location of these systems by integrating the whole [Cii]
and UV emission (i.e. ignoring that these are actually composed of different subsystems) is indicated with blue stars. The four new [Cii] non-detections presented in Section 2.2 fall below the local
relation, while the L[CII]for BDF2203 places this galaxy along the De Looze et al. (2014) relation.
Once the association between [Cii] emission and optical-UV
counterparts is properly done, we find that the resulting distribution occupies a large area of the L[CII]-SFR plot with a large scatter both above and below the local relation. About 19 objects of the total sample are in agreement within 1 sigma with the local relation, but the remaining 24 systems have deviations, either above or below the relation, up to 3 sigma.
In order to quantify the L[CII]-SFR offset of the high-z sam-ple from the relation found in the local population, we inves-tigate the distribution of offsets relative to the local relation. More specifically, for each galaxy we calculate the offset from the relation as∆Log([Cii])=Log([Cii])-Log([Cii]expect−local), where Log([Cii]expect−local) is the [Cii] luminosity expected from the
lo-cal relation according to the SFR measured in the galaxy or sub-component. The result of this distribution is shown in the left panel of Figure 5, while the right panel shows the distribution of the off -sets. In contrast with some previous claims based on fewer targets, the ∆Log([Cii]) distribution, which includes both detections and
0.0
0.5
1.0
1.5
2.0
log(SFR/M yr
1
)
7.0
7.5
8.0
8.5
9.0
9.5
log
(L
[C
II]
/L
)
HZ1
HZ3
HZ4
HZ7
HZ9
C13
N63
U16
C30
C29
CLM1
B22
HZ2
HZ6
HZ8
HZ10
C24
WMH5
B32
CR7
H
HZ2a
HZ2b
HZ2c
HZ6a
HZ6b
HZ6c
HZ8a
HZ8b
HZ10a
HZ10b
WMH5a
WMH5b
CR7a
CR7b
CR7c
Hb
HL
B51
S46
IOK
C20
N23
SXDF
U48
GS32
C24a
B32a
Ha Hc
C24b
B32b
total emission of multi-component systems
individual sub-components
[image:7.612.106.484.99.383.2]single systems
Figure 4.L[CII]as a function of SFR atz=5−7. Blue stars indicate the global SFR and [Cii] luminosity for system having multiple sub-components, as discussed in Section 3; in these cases the location of the individual sub-components are shown with yellow stars. Red circles show the location of the remaining high-zgalaxies (i.e. single systems) listed in Table 2, that do not exhibit any positional offsets and/or disturbed morphology. In the bottom-right of the figure we show an error bar that is representative for the whole sample. The green line is the local relation for local star-forming galaxies (De Looze et al. 2014).
0.0 0.5 1.0 1.5 2.0
log(SFR) 1.00 0.75 0.50 0.25 0.00 0.25 0.50 0.75 1.00 log ([C II] )-l og ([C
II]expe
ct
loc
al
)
0 10
Figure 5.Deviations from the local L[CII]-SFR relation as a function of SFR. The 1σdispersion of the local relation is indicated with the shaded green region. The distribution of the offsets is shown in the right panel. The black curve represents the Log([Cii])-Log([Cii]expect−local) distribution from our sample, while the dotted green histogram is the distribution of the local relation. The dashed grey line shows a Gaussian fit to the high-zdistribution.
5 THE RELATION BETWEEN LyαEW AND [Cii]
EMISSION
It is well known that Lyαemission depends on the level of ion-izing photons produced by star formation (or AGN activity) and radiative transfer effects in the ISM. Models and observations sug-gest that the LyαEW increases with decreasing metallicity and dust content (Raiter et al. 2010; Song et al. 2014). Since the [Cii]
emis-sion is sensitive on the ISM properties as well, and in particular the ISM heating through photoelectric ejection from dust grains, we
0.5
1.0
1.5
2.0
log(SFR/M yr
1)
7.0
7.5
8.0
8.5
9.0
9.5
log
(L
[CII]/L
)
HZ3 HZ1 [image:7.612.307.541.462.634.2]HZ4 HZ7 HZ9 C13 N63 U16 C30 C29 CLM1 B22 HZ6a HZ8a HZ10a WMH5b CR7a CR7b CR7c Hb HL B51 S46 IOK C20 N23 SXDFU48 GS32 C24a B32a Ha Hc
0
10
20
30
40
>50
EW
(L
y
) [
Å]
Figure 6. L[CII]as a function of SFR at z = 5−7. Stars and circles represent sub-components and individual galaxies, respectively. Symbols are colour-coded according to their LyαEWs (not corrected for the inter-galactic medium absorption), as indicated on the colour bar on the right. In the bottom-right corner we show an error bar that is representative for the whole sample. The green line are the local relation for local star-forming galaxies (De Looze et al. 2014) while its dispersion is indicated by the shaded green region.
expect a relation between the [Cii] luminosity and the Lyαstrength
(Harikane et al. 2017).
[image:7.612.43.283.463.585.2]1
10
100
EW(Ly ) [Å]
1.0
0.5
0.0
0.5
1.0
log
([C
II]
)-l
og
([C
II]
expe
ct
loc
al
)
6.5
7.0
7.5
8.0
log
(L
CII]/S
FR
)[L
/M
yr
1
]
1
10
100
EW(Ly )
int[Å]
1.0
0.5
0.0
0.5
1.0
log
([C
II]
)-l
og
([C
II]
expe
ct
loc
al
)
6.5
7.0
7.5
8.0
log
(L
CII]/S
FR
)[L
/M
yr
[image:8.612.44.278.75.455.2]1
]
Figure 7. Top panel: Offset from the local L[CII]-SFR relation as a function of EW(Lyα). The right hand axis shows the [Cii]/SFR ratio corresponding to the deviations from the local L[CII]-SFR relation. The 1σdispersion of the local relation is indicated by the shaded green region. Star and circles indi-cate sub-components and individual galaxies, respectively. The grey dashed relationship shows our linear fit (see text). Bottom panel: Same as the top panel but the EW(Lyα)int has been corrected for the IGM absorption by following Harikane et al. 2017.
the different symbols according to their LyαEWs (not corrected for the inter-galactic medium absorption). We include only those sub-components and galaxies having a LyαEW measurement. There is a weak tendency for galaxies with high EW(Lyα) to lie below the local L[CII]-SFR relation, and vice-versa. This is shown better in Figure 7 where the offset from the local L[CII]-SFR relation is plotted as a function of EW(Lyα). Note that, since the slope of the local relation is one, plotting the deviation from the local re-lation (∆log([Cii])=log([Cii])-log([Cii]expect−local)) is equivalent to plotting the ratio between [Cii] luminosity and SFR, i.e. L[CII]/SFR, which is indeed given on the right hand axis of Figure 6. Although there is a large dispersion, there is a tentative indication that the offset from the local relation (hence L[CII]/SFR) anti-correlates with LyαEW. A linear fit gives
∆log([Cii])=(0.55±0.20)−(0.44±0.15) log(EW(Lyα))
and the dispersion around this best-fit is 0.25 dex.
The result does not change significantly if we attempt to cor-rect the EW(Lyα) for IGM absorption, by following the prescrip-tion given by Harikane et al. (2017). In this case the relaprescrip-tion is
shown in the bottom panel of Figure 6 and the resulting best-fit linear relation is
∆log([Cii])=(0.56±0.20)−(0.41±0.14) log(EW(Lyα)int) (0.30dex)
and the dispersion around this best-fit is even larger, 0.3 dex. Harikane et al. (2017) find a relation between L[CII]/SFR and EW(Lyα) steeper than ours, though consistent within errors. The steeper relation found by Harikane et al. (2017) is probably as-sociated with the fact that in their work they combine the global properties of galaxies and do not extract the subcomponents.
Some anti-correlation between deviation from the local L[CII] -SFR relation and EW(Lyα) (or, equivalently, between L[CII]-SFR and EW(Lyα)int) is expected from the dependence of these quan-tities from the metallicity, either directly or through the associated dust content, as already predicted by some models (e.g. Vallini et al. 2015; Pallottini et al. 2017b; Matthee et al. 2017). Indeed, lower metallicity implies lower amount of carbon available for cooling, but also less dust content. Indeed, since the heating of PDRs occurs primarily through photoelectric effect on dust grains, the lower is the dust content the lower is the heating efficiency of the gas in the PDR, hence the lower is the emissions of the [Cii] cooling line. On
the other hand, the lower the dust content the lower is the absorp-tion of the Lyαresonant line, hence the higher is the EW(Lyα).
6 SPATIALLY RESOLVED L[CII]–SFR RELATION
In the previous sections, we show that the L[CII]-SFR relation at
z > 5 has a intrinsic dispersion larger than observed in the local Universe. Such a large scatter suggests that the [Cii] luminosity
may not be good tracer of the SFR at least at early epochs. Recent spatially resolved studies have claimed that the [Cii
]-SFR relation is better behaved in terms of ]-SFR surface density and [Cii] surface brightness than in global proprieties (L[CII]and SFR), since the surface brightness calibration is more closely related to the local UV field (Herrera-Camus et al. 2015; Smith et al. 2017). It is thus worth to analyse the relationΣ[CII]-ΣSFRatz>5.
In this section we compare the spatial extension of the [Cii]
and UV emission and, then, we investigate the correlation between [Cii] surface brightness and SFR surface density.
6.1 Spatial extension of the [Cii] emission
Figure 8 shows the extension of the [Cii] emission compared with
the extension of star formation traced by the UV counterpart. [Cii]
emission is generally much more extended than the UV emission tracing unobscured star formation. This discrepancy may be par-tially associated with observational effects. Indeed, while the high angular resolution ofHSTenables to resolve small clumps, it may have low sensitivity to diffuse, extended emission. However, even by smoothing the UV images in the deepest observations available to us, we still do not recover the extension observed in [Cii]. On the other hand, the resolution of the [Cii] observations may, in some
case, smear out clumps and result in an overall extended distribu-tion. However, in many cases the ALMA observations achieve a resolution comparable, or even higher, thanHSTat UV rest-frame wavelengths and, despite this, we measure clearly larger [Cii] sizes.
Moreover, when high angular resolution observation are used, these do reveal that a significant fraction of the [Cii] flux is resolved out
0.5
1.0
1.5
2.0
2.5
3.0
3.5
4.0
R
[CII][kpc]
0.5
1.0
1.5
2.0
2.5
R
UV[k
pc
[image:9.612.45.276.103.275.2]]
Figure 8.Half-light radii of star formation regions, as measured from the (rest-frame) UV light, compared with the half-light radii of the associated [Cii] emission. The dashed line indicates the 1:1 relation.
0.25 0.00 0.25 0.50 0.75 1.00 1.25 1.50 1.75
log
10(
SFR/M yr
1kpc
2)
39
40
41
42
43
log
10(
[CII]/e
rg
s
1
kp
c
2
)
HZ1
HZ4
HZ7
HZ9
C13
U16
C30
B22
HZ3
N63
CLM1
HZ2a
HZ6b
HZ6c
HZ8a
HZ8b
HZ10a
HZ10b
CR7a
CR7c
HZ2b
HZ2c
HZ6a
CR7b
Hb
WMH5b
Figure 9.Σ[CII]vsΣSFRforz >5 star-forming galaxies detected both in [Cii] and rest-frame UV. Symbols are as in Figure 4. The grey line indicates the local relation by Herrera-Camus et al. (2015). The dashed line indicates the best linear fit on thez>5 sample.
UV emission are tracing truly different distribution of the [Cii] and
UV emission on different scales.
There could be various explanations for these differences. If the star formation associated with the [Cii] emission on large scale is heavily obscured, the UV light does not trace this component (Katz et al. 2017). This is certainly a possibility, although one might expect that the bulk of the obscuration should affect the central re-gion more heavily than the outer parts, hence one would expect the opposite trend. In alternative, the extended component of [Cii] may
not be directly associated with star forming regions, but with cir-cumgalactic gas, either in accretion or ejected by the galaxy, and which is illuminated by the strong radiation field produced by the galaxy.
6.2 Surface brightness
Once we have measured the extension of the [Cii] emission and of
the SFR regions, we can estimate the [Cii] surface brightness and
SFR surface density of each sub-component and of the individual sources detected in [Cii] and UV. Figure 9 shows theΣ[CII]-ΣSFR relation, where we have included only those galaxies detected in both [Cii] and UV emission. Systems that are not spatially resolved
in [Cii] (or UV) emission are indicated with lower limits. We also
show the local relation by Herrera-Camus et al. (2015) and its dis-persion. In contrast to the L[CII]-SFR diagram, there are no galaxies located significantly above the local relation, only a few galaxies are located on the local relation, and most galaxies spread largely below the local relation. This is primarily due to the large extension of the [Cii] emission in these high redshift systems, as discussed in
the previous section. By fitting theΣ[CII]-ΣSFRmeasurements for our sample we obtain the following relation:
log(ΣSFR)=(0.63±0.11)×(log(Σ[CII])−(25±6)
Part of the Σ[CII] deficit may be ascribed to the metallicity of the gas. Indeed a similar deviations have been observed in local low-metallicity galaxies, in which theΣ[CII]-ΣSFRcalibration over-predicts theΣ[CII]by up to a factor of six. We note that Faisst et al. (2017) estimated a metallicity of 12+log(O/H)>8.5 for HZ10 and HZ9, and a metallicity of 12+log(O/H)<8.5 for HZ1, HZ2, and HZ4. The former agree with the local Σ[CII]-ΣSFR relation while HZ1, HZ2, and HZ4 have lowΣ[CII]-ΣSFR ratio. This interpreta-tion is also supported by the fact that all CR7 clumps, which have metallicities 12+log(O/H)< 8.2 (see discussion in Sobral et al. 2017) , are located well below the local relation. TheΣ[CII] deficit is also akin to the simulations by Pallottini et al. (2017a) who investigated the physical properties of a simulated galaxy at
z = 6, with metallicity 12+log(O/H)=8.35. Such galaxy has a log(Σ[CII]/erg s−1kpc−2)=40.797 and log(ΣSFR/Myr−1)=1.027,
which places the mock galaxy below theΣ[CII]-ΣSFRrelation found for local star-formation galaxies.
However, the offset observed in high-zgalaxies is significantly larger (one order of magnitude or more) than the one observed in local low metallicity galaxies, so other effects are likely in place, which will be discussed in the next section. Finally, still within the context of the surface brightness and SFR surface density, we mention that, for local galaxies, Smith et al. (2017) found a de-pendence between the L[CII]/LFIRratio and the SFR surface density, suggesting that the [Cii] deficit increases strongly with increasing
ΣSFR. Therefore theΣSFRdependence has a strong impact also on the L[CII]-SFR relation. In our sample, we cannot verify this de-pendence as most galaxies have only an upper limit on the LFIR. However, we can investigate the relation L[CII]/LUVandΣSFR since the contribution of SFRFIRto the total SFR is negligible (see discus-sion in Section 2.3). Figure 10 shows the observed L[CII]/LUVratio spanning a range between 0.002% to 0.4% (over two orders of mag-nitude), while the SFR surface density spans the range between 1 and 30 Myr−1kpc−2. There is only a very weak correlation
[image:9.612.45.275.362.531.2]7 DISCUSSION ON THE [Cii]-SFR SCALING
RELATIONS AT Z=5–7
Clearly galaxies atz>5 behave differently, relative to their local counterparts, for what concerns the [Cii] and SFR properties.
Sum-marising the finding of the previous sections: 1) both the L[CII]-SFR relation and the Σ[CII]–ΣSFR relation have a scatter much larger than the local relations; 2) contrary to some previous claims, the L[CII]–SFR relation is not offset relative to the local relation, while the Σ[CII]–ΣSFR relation is clearly offset by showing much lower Σ[CII]relative to local relation; 3) the extension of the [Cii]
emis-sion is larger than the extent of the star formation traced by the UV emission.
The larger scatter observed in the SFR-L[CII]relation is cer-tainly indicative of a broader range of properties spanned by such primeval galaxies relative to the local population. Indeed, high-z
cosmological simulations show that the [Cii] emission strongly
de-pends on the gas metallicity, ionisation parameter, and evolutionary stage of the system and that all of these properties are expected to span a much broader range at high-zwith respect to local galax-ies (Vallini et al. 2015, 2016, 2017; Pallottini et al. 2015, 2017b; Olsen et al. 2017; Katz et al. 2017). Recently, Lagache et al. (2017) investigated the expected dispersion of L[CII]-SFR relation in the distant Universe by using a semi-analytical model of galaxy forma-tion for a large sample of simulated galaxies atz>4. They found a L[CII]-SFR correlation with a large scatter of 0.4-0.8 dex, which is in agreement with our result. They claim that such large disper-sion is associated to the combined effects of different gas contents, metallicities, and interstellar radiation fields in the simulated high-z
galaxies.
As we have shown, the mild anti-correlation with EW(Lyα), as well as the analysis of some individual galaxies for which the metallicity has been estimated, does suggest that the metallicity may play a role on the [Cii] emission (either simply in terms of
carbon abundance and/or in terms of heating of the ISM through photoelectric effect on dust grains, whose abundance scales with the metallicity). In particular, the lower metallicity of galaxies at
z >5 can explain some of the scatter towards low [Cii] emission
in both the L[CII]-SFR relation and in theΣ[CII]-ΣSFRrelation. How-ever, metallicity effects are unlikely to explain the scatter towards high [Cii] emission in the L[CII]-SFR relation. Moreover, for what concerns theΣ[CII]-ΣSFRrelation, the offset and large spread toward lowΣ[CII]is probably too large to be entirely ascribed to metallicity. Large variations in ionisation parameter can also contribute to the spread in [Cii] emission (Graciá-Carpio et al. 2011; Katz et al.
2017). In particular, if [Cii] in primeval galaxies also traces
cir-cumgalactic gas in accretion and/or expelled from the galaxy, and excited by the UV radiation of the central galaxy, this would result into the observed larger [Cii] sizes, hence lowerΣ[CII] and lower ionisation parameter, and the latter would increase the total L[CII] relative to the local relation. On the other hand, young compact star forming, primeval galaxies would be characterised by higher ion-isation parameter, which would reduce the [Cii] emission, hence
contributing to the spread towards low L[CII].
As mentioned in the previous sections, yet another possibility is that the UV emission associated with some of the [Cii] clumps
is heavily obscured. This would explain the scatter above the L[CII] -SFR relation, in the sense that for some of these systems the under-lying SFR, as traced by the UV, is heavily underestimated. This can be the case for a few galaxies. However, as we mentioned, most of these systems show no or weak continuum dust emission, indicative of low dust content.
1
10
SFR
[M yr
1kpc
2]
0.01%
0.1%
L
[CII]/L
UVHZ1
HZ3HZ4 HZ7
HZ9
C13 N63 U16
C30
B22
HZ2a HZ2b
HZ2c
HZ6a HZ6b HZ6c
HZ8a HZ8b
HZ10a HZ10b
CR7a CR7b
CR7c Hb
C24a B32a
B51
IOK C20 U48 GS32 Ha
[image:10.612.307.542.99.275.2]Hc
Figure 10.L[CII]/LUVratio as a function of the SFR surface density. Sym-bols are as in Figure 4.
To make further progress additional data at other wavelength will be, in the future, extremely valuable. In particular, JWST will enable to identify obscured stellar components as well as Hα emis-sion associated with star formation. ALMA observations of other transitions, such has [OIII]88µm (though observable only in some redshift ranges), has proved extremely useful to constrain these sce-narios (e.g. Inoue et al. 2016; Carniani et al. 2017a).
8 CONCLUSIONS
In this work we have investigated the nature of the [Cii] emission
in star-forming galaxies atz = 5−7. In particular, we have ex-plored the positional offsets between UV and FIR line emissions, the presence of multiple components, and the implications on the [Cii]-SFR scaling relations in the distant Universe, once the
cor-rect association between [Cii] and UV emission is properly taken
into account. We have performed our investigation in a sample of 29z>5 “normal” star-forming galaxies (SFR<100 Myr−1)
ob-served with ALMA in the [Cii] line. In addition to the re-analysis
of archival objects, we have also included new ALMA observations targeting five star-forming galaxies atz∼6 with SFR∼10 Myr−1,
resulting into a new detection. Our mains results are:
• The continuum emission around 158µm is not detected in most of thez>5 galaxies observed with ALMA, indicating a low dust content. By modelling the dust emission with a greybody spec-trum with dust temperature Td=30 K and emissivity indexβ=1.5, we have found that the SFR based on the FIR emission is, on aver-age, lower than the SFR measured from the UV emission by at least a factor 0.6, but probably much more (due to several upper limits).
• By accurately registering ALMA and NIR images, and by kinematically discriminating multiple [Cii] components, our anal-ysis has revealed that the [Cii] emission breaks into multiple
sub-components in 9 out of the 21 galaxies having [Cii] detections. In
these nine targets we have observed the presence of 19 FIR-line emitting clumps. Only very few of these, if any, are associated with the primary (brightest) UV counterpart, while the bulk of the [Cii] is
• We have studied the relation between [Cii] and SFR on the
high-zsample by taking into account the presence of these sub-components and the proper associations between [Cii] and UV
components. The distribution ofz >5 galaxies on the L[CII]-SFR diagram follows the local relation, but the dispersion is 1.8 times larger than that observed in nearby galaxies.
• The deviation from the local L[CII]-SFR relation shows a weak anti-correlation with EW(Lyα) though shallower and with larger dispersion than what found in other studies that did not account for the multi-component nature of these systems.
• Most of the objects in the high-zsample are spatially resolved in [Cii] and UV emission. The extension of the [Cii] emission is
generally much larger than the extension of star forming regions traced by the UV emission.
• In theΣ[CII]-ΣSFRdiagramz>5 galaxies are characterised by a large scatter with respect to local galaxies, and are mostly dis-tributed below the local relation (i.e. fainterΣ[CII]at a givenΣSFR).
We have suggested that a combination of different effects may be responsible for the different properties of high-zgalaxies in terms of [Cii]–SFR properties relative to local galaxies. More
specifically: 1) the low metallicity of high-zgalaxies may be re-sponsible (also indirectly through the lower dust photoelectric heat-ing) for part of the scatter towards lower [Cii] emission relative to
the local relations; 2) the presence of circumnuclear gas in accre-tion and/or expelled from the galaxy may be responsible for the larger size in [Cii] relative to the SFR distribution and may also
be responsible for the scatter of the L[CII]-SFR distribution above the local relation as a consequence of lower ionisation parameter; 3) in compact young star forming regions the increased ionisation parameter and higher gas density may be responsible for the sup-pression of [Cii] for galaxies which are below the local relation;
4) dust obscuration may be responsible for both the different mor-phology between [Cii] and UV emission and also for the scatter of
sources above the local L[CII]-SFR relation.
ACKNOWLEDGMENTS
This paper makes use of the following
ALMA data: ADS/JAO.ALMA#2012.1.00719.S, ADS/JAO.ALMA#2012.A.00040.S, ADS/JAO.ALMA#2013.A.00433.S ADS/JAO.ALMA#2011.0.00115.S, ADS/JAO.ALMA#2012.1.00033.S, ADS/JAO.ALMA#2012.1.00523.S, ADS/JAO.ALMA#2013.1.00815.S, ADS/JAO.ALMA#2015.1.00834.S., ADS/JAO.ALMA#2015.1.01105.S, and ADS/JAO.ALMA#2016.1.01240.S which can be retrieved from the ALMA data archive: https://almascience.eso.org/ alma-data/archive. ALMA is a partnership of ESO (representing its member states), NSF (USA) and NINS (Japan), together with NRC (Canada) and NSC and ASIAA (Taiwan), in cooperation with the Republic of Chile. The Joint ALMA Observatory is operated by ESO, AUI/NRAO and NAOJ. We are grateful to G. Jones to for providing the [Cii] flux maps of WHM5. R.M.
and S.C. acknowledge support by the Science and Technology Facilities Council (STFC). R.M. acknowledges ERC Advanced Grant 695671 “QUENCH”. AF acknowledges support from the ERC Advanced Grant INTERSTELLAR H2020/740120.
REFERENCES
Aravena M. et al., 2016, ArXiv e-prints Bariši´c I. et al., 2017, ArXiv e-prints
Bowler R. A. A., Dunlop J. S., McLure R. J., McLeod D. J., 2017, MNRAS, 466, 3612
Bradaˇc M. et al., 2016, ArXiv e-prints Capak P. L. et al., 2015, Nature, 522, 455 Carilli C. L., Walter F., 2013, ARA&A, 51, 105 Carniani S. et al., 2015, A&A, 584, A78 Carniani S. et al., 2017a, A&A, 605, A42
Carniani S., Maiolino R., Smit R., Amorín R., 2017b, ArXiv e-prints
Carniani S. et al., 2013, A&A, 559, A29
Ceverino D., Primack J., Dekel A., Kassin S. A., 2017, MNRAS, 467, 2664
Cutri R. M., et al., 2013, VizieR Online Data Catalog, 2328 De Barros S. et al., 2017, ArXiv e-prints
De Breuck C., Maiolino R., Caselli P., Coppin K., Hailey-Dunsheath S., Nagao T., 2011, A&A, 530, L8
De Looze I. et al., 2014, A&A, 568, A62 Decarli R. et al., 2017, Nature, 545, 457 Dunlop J. S. et al., 2016, ArXiv e-prints
Elmegreen B. G., Elmegreen D. M., Fernandez M. X., Lemonias J. J., 2009, ApJ, 692, 12
Faisst A. L. et al., 2017
Fiacconi D., Mayer L., Madau P., Lupi A., Dotti M., Haardt F., 2016, ArXiv e-prints
Förster Schreiber N. M. et al., 2006, ApJ, 645, 1062 Gaia Collaboration et al., 2016, A&A, 595, A2 Gallerani S. et al., 2012, A&A, 543, A114
Gallerani S., Pallottini A., Feruglio C., Ferrara A., Maiolino R., Vallini L., Riechers D. A., 2016, ArXiv e-prints
Genzel R. et al., 2008, ApJ, 687, 59 González-López J. et al., 2014, ApJ, 784, 99 Graciá-Carpio J. et al., 2011, ApJ, 728, L7 Guo Y. et al., 2015, ApJ, 800, 39
Hao C.-N., Kennicutt R. C., Johnson B. D., Calzetti D., Dale D. A., Moustakas J., 2011, ApJ, 741, 124
Harikane Y. et al., 2017, ArXiv e-prints Herrera-Camus R. et al., 2015, ApJ, 800, 1 Inoue A. K. et al., 2016, ArXiv e-prints Jiang L. et al., 2013, ApJ, 773, 153 Jones G. C. et al., 2017a, ArXiv e-prints
Jones G. C., Willott C. J., Carilli C. L., Ferrara A., Wang R., Wagg J., 2017b
Kapala M. J. et al., 2015, ApJ, 798, 24
Katz H., Kimm T., Sijacki D., Haehnelt M. G., 2017, MNRAS, 468, 4831
Kennicutt R. C., Evans N. J., 2012, ARA&A, 50, 531
Knudsen K. K., Richard J., Kneib J.-P., Jauzac M., Clement B., Drouart G., Egami E., Lindroos L., 2016, ArXiv e-prints Lagache G., Cousin M., Chatzikos M., 2017, ArXiv e-prints Maiolino R. et al., 2015, MNRAS, 452, 54
Maiolino R., Caselli P., Nagao T., Walmsley M., De Breuck C., Meneghetti M., 2009, A&A, 500, L1
Maiolino R. et al., 2005, A&A, 440, L51 Maiolino R. et al., 2012, MNRAS, 425, L66 Matthee J. et al., 2017, ArXiv e-prints
Matthee J., Sobral D., Santos S., Röttgering H., Darvish B., Mobasher B., 2015, MNRAS, 451, 400
McMullin J. P., Waters B., Schiebel D., Young W., Golap K., 2007, in Astronomical Society of the Pacific Conference Series, Vol. 376, Astronomical Data Analysis Software and Systems XVI, Shaw R. A., Hill F., Bell D. J., eds., p. 127
Olsen K. P., Greve T. G., Narayanan D., Thompson R., Davé R., Rios L. N., Stawinski S., 2017
Ota K. et al., 2014, ApJ, 792, 34 Ouchi M. et al., 2013, ApJ, 778, 102 Ouchi M. et al., 2010, ApJ, 723, 869
Pallottini A., Ferrara A., Bovino S., Vallini L., Gallerani S., Maiolino R., Salvadori S., 2017a, MNRAS, 471, 4128
Pallottini A., Ferrara A., Gallerani S., Vallini L., Maiolino R., Sal-vadori S., 2017b, MNRAS, 465, 2540
Pallottini A., Gallerani S., Ferrara A., Yue B., Vallini L., Maiolino R., Feruglio C., 2015, MNRAS, 453, 1898
Pentericci L. et al., 2016, ApJ, 829, L11
Planck Collaboration et al., 2016, A&A, 594, A13
Raiter A., Schaerer D., Fosbury R. A. E., 2010, A&A, 523, A64 Ravindranath S. et al., 2006, ApJ, 652, 963
Riechers D. A. et al., 2014, ApJ, 796, 84
Robertson B. E., Ellis R. S., Furlanetto S. R., Dunlop J. S., 2015, ApJ, 802, L19
Schaerer D. et al., 2015, A&A, 576, L2 Schreiber C. et al., 2017, ArXiv e-prints Smit R. et al., 2017, ArXiv e-prints Smith J. D. T. et al., 2017, ApJ, 834, 5 Sobral D. et al., 2017, ArXiv e-prints
Sobral D., Matthee J., Darvish B., Schaerer D., Mobasher B., Röttgering H. J. A., Santos S., Hemmati S., 2015, ApJ, 808, 139 Song M. et al., 2014, ApJ, 791, 3
Tamburello V., Mayer L., Shen S., Wadsley J., 2015, MNRAS, 453, 2490
Trakhtenbrot B., Lira P., Netzer H., Cicone C., Maiolino R., Shem-mer O., 2017, ApJ, 836, 8
Vallini L., Ferrara A., Pallottini A., Gallerani S., 2016, ArXiv e-prints
Vallini L., Ferrara A., Pallottini A., Gallerani S., 2017, MNRAS Vallini L., Gallerani S., Ferrara A., Pallottini A., Yue B., 2015, ApJ,
813, 36
Wagg J. et al., 2012, ApJ, 752, L30
Williams R. J. et al., 2014, MNRAS, 439, 2096
Willott C. J., Bergeron J., Omont A., 2015a, ApJ, 801, 123 Willott C. J., Carilli C. L., Wagg J., Wang R., 2015b, ApJ, 807, 180 Yun M. S. et al., 2015, MNRAS, 454, 3485
APPENDIX A: ADDITIONAL ALMA DATA -OBSERVATION AND DATA REDUCTION
The fivez ∼6 star-forming galaxies listed in Table A1 were ob-served with ALMA in band 6 during Cycle 3 and Cycle 4 (program ID #2015.1.01105.S and #2015.1.01240.S). ALMA observations were carried out with a semi-compact array configuration with an-gular resolutions ranging from 0.300
and 0.800
. The sources were observed for a total on source integration time of 0.1-0.8 h with a precipitable water vapour of 0.4-1.4 mm, depending on the specific observation. For each target we used four spectral windows (SPWs) set up in frequency division mode with a spectral resolution of∼30 MHz (∼35 km/s) and bandwidth of 1.875 GHz. One of the four SPWs was tuned to the expected frequency of the [Cii] line. The
phase of each observation was centred at the NIR position of the respectively source.
J2248-3235, J0948-002, J1147-0724, J0239-0234, and J0552-3627 were observed as phase calibrator, respectively for the
four sources. The flux calibrators were J2056-4714, Ganymede, J1229+0203, J1229+0623, and J0334-4008 while bandpass cali-brations were carried out through the observations of J2258-2758, J1058+0133, J1229+0203, J0238+1636, and J0522-3627.
ALMA observations were calibrated by using CASA software version v4.5.2 (McMullin et al. 2007). Continuum and data cube images were obtained by using the CASA taskcleanand natural
weighting. The final angular resolution and sensitivity reached in each set of data are listed in Table A1.
We registered NIR images to ALMA observations by match-ing the location of the foreground sources and ALMA calibrators to the position given by the GAIA Data Release 1 catalogue (Gaia Collaboration et al. 2016).
As discussed in Section 2.2, [Cii] emission was detected only
in one target, BDF3203. Figures 1 and A1 show the ALMA [Cii]
Table 2.Star-forming galaxies atz>5
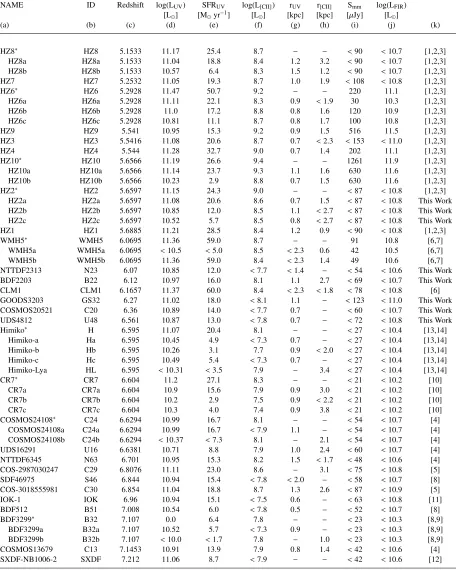
NAME ID Redshift log(LUV) SFRUV log(L[CII]) rUV r[CII] Smm log(LFIR) [L] [Myr−1] [L] [kpc] [kpc] [µJy] [L]
(a) (b) (c) (d) (e) (f) (g) (h) (i) (j) (k)
HZ8∗ HZ8 5.1533 11.17 25.4 8.7 − − <90 <10.7 [1,2,3]
HZ8a HZ8a 5.1533 11.04 18.8 8.4 1.2 3.2 <90 <10.7 [1,2,3]
HZ8b HZ8b 5.1533 10.57 6.4 8.3 1.5 1.2 <90 <10.7 [1,2,3]
HZ7 HZ7 5.2532 11.05 19.3 8.7 1.0 1.9 <108 <10.8 [1,2,3]
HZ6∗ HZ6 5.2928 11.47 50.7 9.2 − − 220 11.1 [1,2,3]
HZ6a HZ6a 5.2928 11.11 22.1 8.3 0.9 <1.9 30 10.3 [1,2,3]
HZ6b HZ6b 5.2928 11.0 17.2 8.8 0.8 1.6 120 10.9 [1,2,3]
HZ6c HZ6c 5.2928 10.81 11.1 8.7 0.8 1.7 100 10.8 [1,2,3]
HZ9 HZ9 5.541 10.95 15.3 9.2 0.9 1.5 516 11.5 [1,2,3]
HZ3 HZ3 5.5416 11.08 20.6 8.7 0.7 <2.3 <153 <11.0 [1,2,3]
HZ4 HZ4 5.544 11.28 32.7 9.0 0.7 1.4 202 11.1 [1,2,3]
HZ10∗ HZ10 5.6566 11.19 26.6 9.4 − − 1261 11.9 [1,2,3]
HZ10a HZ10a 5.6566 11.14 23.7 9.3 1.1 1.6 630 11.6 [1,2,3]
HZ10b HZ10b 5.6566 10.23 2.9 8.8 0.7 1.5 630 11.6 [1,2,3]
HZ2∗ HZ2 5.6597 11.15 24.3 9.0 − − <87 <10.8 [1,2,3]
HZ2a HZ2a 5.6597 11.08 20.6 8.6 0.7 1.5 <87 <10.8 This Work HZ2b HZ2b 5.6597 10.85 12.0 8.5 1.1 <2.7 <87 <10.8 This Work HZ2c HZ2c 5.6597 10.52 5.7 8.5 0.8 <2.7 <87 <10.8 This Work
HZ1 HZ1 5.6885 11.21 28.5 8.4 1.2 0.9 <90 <10.8 [1,2,3]
WMH5∗ WMH5 6.0695 11.36 59.0 8.7 − − 91 10.8 [6,7]
WMH5a WMH5a 6.0695 <10.5 <5.0 8.5 <2.3 0.6 42 10.5 [6,7]
WMH5b WMH5b 6.0695 11.36 59.0 8.4 <2.3 1.4 49 10.6 [6,7]
NTTDF2313 N23 6.07 10.85 12.0 <7.7 <1.4 − <54 <10.6 This Work
BDF2203 B22 6.12 10.97 16.0 8.1 1.1 2.7 <69 <10.7 This Work
CLM1 CLM1 6.1657 11.37 60.0 8.4 <2.3 <1.8 <78 <10.8 [6] GOODS3203 GS32 6.27 11.02 18.0 <8.1 1.1 − <123 <11.0 This Work COSMOS20521 C20 6.36 10.89 14.0 <7.7 0.7 − <60 <10.7 This Work UDS4812 U48 6.561 10.87 13.0 <7.8 0.7 − <72 <10.8 This Work
Himiko∗ H 6.595 11.07 20.4 8.1 − − <27 <10.4 [13,14]
Himiko-a Ha 6.595 10.45 4.9 <7.3 0.7 − <27 <10.4 [13,14] Himiko-b Hb 6.595 10.26 3.1 7.7 0.9 <2.0 <27 <10.4 [13,14] Himiko-c Hc 6.595 10.49 5.4 <7.3 0.7 − <27 <10.4 [13,14] Himiko-Lya HL 6.595 <10.31 <3.5 7.9 − 3.4 <27 <10.4 [13,14]
CR7∗ CR7 6.604 11.2 27.1 8.3 − − <21 <10.2 [10]
CR7a CR7a 6.604 10.9 15.6 7.9 0.9 3.0 <21 <10.2 [10]
CR7b CR7b 6.604 10.2 2.9 7.5 0.9 <2.2 <21 <10.2 [10]
CR7c CR7c 6.604 10.3 4.0 7.4 0.9 3.8 <21 <10.2 [10]
COSMOS24108∗ C24 6.6294 10.99 16.7 8.1 − − <54 <10.7 [4]
COSMOS24108a C24a 6.6294 10.99 16.7 <7.9 1.1 − <54 <10.7 [4] COSMOS24108b C24b 6.6294 <10.37 <7.3 8.1 − 2.1 <54 <10.7 [4]
UDS16291 U16 6.6381 10.71 8.8 7.9 1.0 2.4 <60 <10.7 [4]
NTTDF6345 N63 6.701 10.95 15.3 8.2 1.5 <1.7 <48 <10.6 [4] COS-2987030247 C29 6.8076 11.11 23.0 8.6 − 3.1 <75 <10.8 [5] SDF46975 S46 6.844 10.94 15.4 <7.8 <2.0 − <58 <10.7 [8] COS-3018555981 C30 6.854 11.04 18.8 8.7 1.3 2.6 <87 <10.9 [5]
IOK-1 IOK 6.96 10.94 15.1 <7.5 0.6 − <63 <10.8 [11]
BDF512 B51 7.008 10.54 6.0 <7.8 0.5 − <52 <10.7 [8]
BDF3299∗ B32 7.107 0.0 6.4 7.8 − − <23 <10.3 [8,9]
BDF3299a B32a 7.107 10.52 5.7 <7.3 0.9 − <23 <10.3 [8,9] BDF3299b B32b 7.107 <10.0 <1.7 7.8 − 1.0 <23 <10.3 [8,9] COSMOS13679 C13 7.1453 10.91 13.9 7.9 0.8 1.4 <42 <10.6 [4] SXDF-NB1006-2 SXDF 7.212 11.06 8.7 <7.9 − − <42 <10.6 [12] Notes:(a)Name of the source; the asterisk mark (∗) indicates that the source has a multi-clump morphology.(b)ID used to indicate the source in
Table A1.UV and far-IR properties of the new fivez∼6−7 sources observed with ALMA. Name RA(J2000) DEC(J200) zLyαa SFRb
UV νobs([CII])
c beamd t
expe σcontf σ
g
line L[CII] h
[deg] [deg] Myr−1] [GHz] [min00×maj00] [hours] [µJy] [mJy] [107L]
NTTDF2313 181.3804 -7.6935 6.07 12 268.817 0.98×0.71 0.7 18 0.15 <4.5
BDF2203 336.958 -35.1472 6.12 16 266.93 1.90×1.11 0.4 23 0.2 12.5±2.5
GOODS3203 53.0928 -27.8826 6.27 18 250.236 1.26×1.03 0.1 41 0.4 <12.0
COSMOS20521 150.1396 2.4269 6.36 14 258.225 1.46×1.20 0.8 20 0.15 <4.8
UDS4821 34.4768 -5.24728 6.561 13 251.361 0.24×0.22 0.3 24 0.2 <6.7
Notes:aRedshift from either Lyαline or spectroscopic Lyman break. The uncertainty is<0.04.bSFR inferred from the rest-frame UV continuum adopting
the calibration discussed in Kennicutt & Evans (2012).cExpected [C
ii] frequency according tozLyα.dALMA synthesised beam.eOn-source integration time.
fSensitivity in ALMA continuum map.gSensitivity in spectral channels of 100 km/s.h[C
ii] luminosity. The upper limits on the L[CII]are at 3σ, and are calculated on a width of 100 km/s.
![Figure 2. Top: [Cii] flux map of BDF2203 obtained integrating the ALMAcube over the velocity range between -60 km/s and 132 km/s](https://thumb-us.123doks.com/thumbv2/123dok_us/9320294.433884/4.612.91.232.95.339/figure-cii-ux-obtained-integrating-almacube-velocity-range.webp)
![Figure 3. Rest-frame UV images of the nine z > 5 star-forming galaxies showing multi-clump morphology in [Cii] and/or rest-frame UV emission](https://thumb-us.123doks.com/thumbv2/123dok_us/9320294.433884/5.612.58.533.92.582/figure-rest-images-forming-galaxies-showing-morphology-emission.webp)
![Figure 5. Deviations from the local L[CII]-SFR relation as a function ofSFR. The 1σ dispersion of the local relation is indicated with the shadedgreen region](https://thumb-us.123doks.com/thumbv2/123dok_us/9320294.433884/7.612.106.484.99.383/figure-deviations-relation-function-dispersion-relation-indicated-shadedgreen.webp)
![Figure 7. Top panel: Offset from the local L[CII]-SFR relation as a functionof EW(Lyα)](https://thumb-us.123doks.com/thumbv2/123dok_us/9320294.433884/8.612.44.278.75.455/figure-panel-oset-local-cii-relation-functionof-lya.webp)
![Figure 8. Half-light radii of star formation regions, as measured from the(rest-frame) UV light, compared with the half-light radii of the associated[Cii] emission](https://thumb-us.123doks.com/thumbv2/123dok_us/9320294.433884/9.612.45.275.362.531/figure-half-formation-regions-measured-compared-associated-emission.webp)
![Figure 10. L[CII]/LUV ratio as a function of the SFR surface density. Sym-bols are as in Figure 4.](https://thumb-us.123doks.com/thumbv2/123dok_us/9320294.433884/10.612.307.542.99.275/figure-cii-luv-ratio-function-surface-density-figure.webp)