Using HYDRUS to Simulate the Dynamic Changes
of Ca
2+and Na
+in Sodic Soils Reclaimed by Gypsum
Jinman WANG
1,2, Zhongke BAI
1,2and Peiling YANG
31College of Land Science and Technology, China University of Geosciences, Beijing, P.R. China; 2Key Laboratory of Land Consolidation and Rehabilitation, Ministry of Land and Resources, Beijing, P.R. China; 3College of Hydraulic and Civil Engineering,
China Agricultural University, Beijing, P.R. China
Abstract
Wang J., Bai Z., Yang P. (2016): Using HYDRUS to simulate the dynamic changes of Ca2+ and Na+ in sodic soils
re-claimed by gypsum. Soil & Water Res., 11: 1–10.
Sodic soils are characterized by the occurrence of excess sodium to levels that can adversely affect soil structure. In recent years, with the advent of alternatives for reclaiming sodic soils, such as the addition of by-products of flue gas desulfurization, fly ash, phosphogypsum, etc., using CaSO4 to reclaim sodic soil has again become a hot topic. In this study, cation exchange batch experiments and column leaching experiments were conducted to analyze the adsorption-exchange and dynamic changes of Ca2+ and Na+ during the reclamation of sodic soils
with CaSO4. The HYDRUS-1D software was subsequently used to simulate and predict dynamic changes in Ca2+ and Na+. The cation exchange batch experiments consisted of six treatments with six CaSO
4 rates (0, 0.25,
0.5, 1, 1.5, and 2 g/l), and the column leaching experiments consisted of two treatments with two CaSO4 con-centrations (0.5 and 1.5 g/l). The results of the static cation exchange batch experiments indicated that the ion adsorption-exchange coefficients KCa-Na, KCa-Mg,andKCa-K were 1.9, 0.8, and 1.1, respectively. Applying CaSO4 and leaching are efficient methods to reclaim sodic soil. The pH and electrical conductivity of the soil solution gradually decreased with longer leaching time in all of the treatments. HYDRUS-1D successfully simulated both the dynamic changes of the Ca2+ and Na+ concentrations at different soil depths under different treatments and
leaching time, and the effects of soil hydraulic conductivity and soil pH on the transport of Ca2+ and Na+. The
correspondence between the observed and simulated variables was remarkable.
Keywords: cation exchange; ion transport; leaching; simulation; soil reclamation
Sodic soils occur in large areas worldwide. These soils are unsuitable for growing agricultural crops, and a number of such soils are unable to support any plant growth whatsoever. These barren lands severely limit agriculture production and negatively impact the ecosystem (Qadir et al. 2001a; Wang
et al. 2008). Typical sodic soils contain an excess of exchangeable sodium (Na+) in soil colloids, and the soluble carbonates are in the form of Na2CO3 and NaHCO3 (Chun et al. 2001). This results in soil with a high pH (> 8.5), clay dispersion, soil swelling, and overall poor physical properties, all of which can adversely affect soil structure and disturb the
availability of certain nutrients to plants (Suarez
et al. 1984; Qadir et al. 2000). The physical and chemical properties of sodic soils can be improved by sodic soil reclamation (Chun et al. 2001; Qadir
et al. 2001b).
transporta-tion, and crushing of natural gypsum (Sakai et al.
2004; Wang et al. 2008). In recent years, with the advent of alternatives such as the by-products of flue gas desulfurization (BFGD), fly ash, phosphogyp-sum, etc. (Kumar & Singh 2003), the mechanism for reclaiming sodic soils using gypsum has again become a hot topic (Chun et al. 2001; Wang et al.
2008; Chi et al. 2012).
A series of complex physical and chemical processes, such as ion adsorption-exchange and precipitation-dissolution, are generated when sodic soils are re-claimed by gypsum, and the hydraulic conductivity of the soil changes dynamically during this process (Sahin & Anapali 2005; Sahin et al. 2011; Nayak et al. 2013; Wang et al. 2014). Therefore, understand-ing the mechanism of ion transport and the dynamic changes during the process of using gypsum to im-prove sodic soils is important. Computer modelling to simulate the movement and reactions of salts in sodic soils has been a potentially useful complement to experimental data (Suarez 2001). In addition, computer modelling may help assess the economic viability of different soil amelioration methods, which is needed to extend the results broadly to other similar locations (Qadir et al. 2001b; Simunek et al. 2012). These models are typically based on the numerical solutions of the Richards’ equation for variably satu-rated flow, and analytical or numerical solutions of the Fickian equation based on the convection-dispersion equation for solute transport (Simunek & Suarez 1997; Goncalves et al. 2006). The UNSATCHEM model can be used to assess the chemical reactions for solutions with very high ionic strengths. The model also considers kinetic chemical reactions, such as the precipitation/dissolution of calcite and the dis-solution of dolomite, and is suitable to simulate the ion dynamic change in sodic soils reclaimed by gyp-sum (Ramos et al. 2011; Seaman et al. 2012). The UNSATCHEM model has recently been incorporated in the HYDRUS-1D software package (Simunek et al. 2008, 2012). The HYDRUS-1D software may be used to analyze the movements of water and solute in unsaturated, partially saturated, or fully saturated homogeneous layered media (Simunek et al. 2008; Reading et al. 2012a).
The objectives of this study were to analyze and simulate the dynamic changes of individual ion con-centrations in sodic soils reclaimed by gypsum using the HYDRUS-1D software package, and to provide a theoretical basis for the field application of alterna-tive reclamation techniques (such as BFGD).
MATERIAL AND METHODS
Material. This study included two experiments:
a static cation exchange batch experiment and a column leaching experiment. The experiments were performed in the Soil Physics Laboratory of the China Agricultural University. The primary purpose of the static cation exchange batch experiment was to determine the adsorption-exchange coefficients among cations (Na+ and Ca2+, Mg2+, and K+) during sodic soil reclamation by gypsum. The purpose of the column leaching experiment was to study the variation in Na+ and Ca2+ in the soil leachate, soil solution, and soil colloid during sodic soil reclamation by gypsum. The same materials were used in both experiments. Pure CaSO4 was used to more precisely examine the mechanism of sodic soil reclamation.
The soil samples were derived from the Changsheng Experimental Station of the Baoyannur League Insti-tute of Water Resources in northwest China (40°20'N, 108°31'E). According to the FAO soil classification system, the soil was classified as Kastanozem. The soil material was not only sodic, but also saline. The soil displayed a high pH and exchangeable sodium percentage, and low hydraulic conductivity with a high electrical conductivity (EC). It had a clay texture (for its physical and chemical properties see Table 1). The soil was air-dried, crushed, and passed through a 2 mm sieve before the experiments.
The pure CaSO4 (molecular weight 136) was pur-chased from the Tianjin Wendaxigui Chemical Rea-gent Factory (Tianjin, P.R. China).
Cation exchange batch experiments. The cation
exchange batch experiments were conducted in the Soil Physics Laboratory of the China Agricultural University in August 2005. Pure CaSO4 was selected as the reagent, and distilled water was used to dis-solve the CaSO4. The solubility of CaSO4 is 2 g/l at room temperature. The experiments consisted of six treatments with six CaSO4 concentrations (0, 0.25, 0.5, 1, 1.5, and 2 g/l, with Ca2+ concentrations of 0, 3.68, 7.35, 14.71, 21.06, and 29.41 mmolc/l, respec-tively). Each treatment was replicated three times.
soil sample solution was then extracted to analyze the Ca2+, Na+, K+, and Mg2+ content.
Column leaching experiments. The
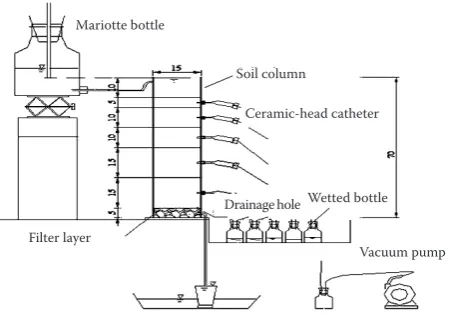
experimen-tal device (Figure 1) was a 70 cm high plexiglass column with an inner diameter of 15 cm (the soil in the column reached as high as 55 cm). A Mariotte bottle was used to supply the water, and a device composed of a pumping system and magnetic head catheters was used to extract the soil solution. The experiments consisted of two treatments with CaSO4 concentrations of 0.5 and 1.5 g/l, corresponding to Ca2+ concentrations of 7.35 and 21.06 mmol
c/l, re-spectively. The pure CaSO4 was selected as the reagent and distilled water was used to dissolve the CaSO4.
A 5 cm layer of quartz sand was placed on the bottom of each column as the filter layer. The tested soil sam-ples were poured homogeneously into the plexiglass column at a dry soil bulk density of 1.45 g/cm3 to a depth of 55 cm. The soil was filled in 5-cm intervals and tamped to a desired height in respective layers. The surface soil was loosened before the next soil layer was filled. A ceramic plate was buried at 2.5, 10, 20, 32.5, and 47.5 cm to extract the soil solution.
The soil columns were saturated with distilled water from the bottom upwards. Once the soils were saturated, the surface water was quickly drained with a vacuum pump and the Ca2+ solution, that had been prepared in the Mariotte bottle, was im-mediately supplied. Soil solutions at heights of 2.5, 10, 20, 32.5, and 47.5 cm were extracted once every 48 h using a vacuum pump to measure Ca2+ and Na+ concentrations; the volume, pH, EC, and Ca2+ and Na+ concentrations of the leachate were also measured. After the experiments, soil samples from the depths of 2.5, 10, 20, 32.5, and 47.5 cm were also collected, and the Ca2+ and Na+ concentrations in the soil solution and the soil colloid were measured.
Analytical methods and statistical analyses. The
[image:3.595.64.535.112.244.2]soil samples were air-dried and passed through a 1 mm sieve. The EC, pH, soluble anions and soluble cations were measured using saturated soil extracts. Soluble cations were measured using an atomic ab-sorption spectrophotometer (AA-6200, Shimadzu, Kyoto, Japan), soluble anions were determined by anion chromatography (ICS-2100, Dionex, Sunny-vale, USA), the soil pH was determined using the glass electrode method, and the EC was measured using a 1 cm conductivity cell, dip-type probe. Ex-changeable cations were determined using a 1 M ammonium acetate (pH = 7) extraction. Following this extraction and a wash with 96% alcohol, the cation exchange capacity was determined by the removal of ammonium ions by distillation. Na+ and K+ were determined by flame emission spectroscopy (AP1200, Aopu, Shanghai, P.R. China) in the extract, and Ca2+ and Mg2+ were determined by atomic absorption spectrophotometry (TAS-986, Persee, Beijing, P.R. China). The concentrations of Na+ and Ca2+ in the leachate were measured using an atomic absorption
Table 1. Physical and chemical properties of the studied soils
Exchangeable cations (cmolc/kg) Soil bulk density
(g/cm3) pH
Na+ K+ Ca2+ Mg2+ CEC
8.65 0.60 0.50 1.27 11.02 1.45 9.15
Soluble cations (mmolc/l) Soluble anions (mmolc/l)
Na+ K+ Ca2+ Mg2+ Cl– SO
42– HCO3– CO32–
303.15 5.18 3.33 3.33 193.33 50.00 51.67 20.00
Particle size distribution (%) EC
(dS/m) (cm/h)Ks
2.0–0.02 (mm) 0.02–0.002 (mm) < 0.002 (mm)
23.2 34.7 42.1 12.95 0.25
EC – electrical conductivity; Ks – saturated hydraulic conductivity; CEC – cation exchange capacity
Figure 1. Scheme of the column experimental setup (in cm)
Mariotte bottle
Filter layer
Wetted bottle Soil column
Ceramic-head catheter
Drainage hole
[image:3.595.308.534.582.740.2]spectrophotometer, the soil pH was determined using the glass electrode method, and the EC was measured using a 1 cm conductivity cell, dip-type probe. The saturated hydraulic conductivity (Ks) was determined using a cutting ring and it was calculated by Darcy’s law.
The sodium adsorption ratio of the soil solution was calculated as
(1)
where:
SAR – sodium adsorption ratio
Na+, Ca2+, Mg2+ – ion concentrations in soil solution
(mmolc/l)
The chemical analysis was replicated three times. The Standard error of the mean (SEM) values of the three samples from each treatment were calculated. The vari-ations between the treatments were analyzed using the SAS software (Statistical Analysis System, Version 9.1) and values of P < 0.05 were considered significant.
Criteria for model evaluation. To test the
perfor-mance of the HYDRUS-1D model, comparisons were made between the simulated and observed values, and two statistical tests were performed: the mean bias error (MBE) and the root mean square deviation (RMSE). The MBE and RMSE were calculated using Eqs (2) and (3), respectively as follows:
(2)
(3)
where:
n – total number of data
Csi – ith simulated datum
Coi – ith observed datum
Co – mean of observed data
The MBE and RMSE values were compared sepa-rately for concentrations of Ca2+ and Na+ for different soil depths. To increase the performance of the model, the adopted criteria were the lower value of the RMSE and the absolute value of the MBE (Willmott 1982; Wang et al. 2013). In general, RMSE ≥ MBE. The degree by which the RMSE value exceeds the MBE value is usually a good indicator of the presence and extent of outliers or the variance of the differences between the modelled and observed values.
Saturated water flow movement
Soil water flow movement equation. The one-dimensional movement of water in a saturated rigid porous medium is described by a modified form of the Richards’ equation (Simunek& Suarez 1997):
(4)
where:
h – water pressure head (cm)
Ks – saturated hydraulic conductivity (cm/h)
t – leaching time (h)
z – spatial coordinate (positive upward)
The effect of the solution chemistry on the hydraulic conductivity is implemented as
K(h, pH, SAR, Co) = r(pH, SAR, Co)K(h) (5)
where:
C0 – total salt concentration of the ambient solution (mmolc/l)
r – scaling factor related to the pH, SAR, and salinity
The overall scaling factor r was divided into two parts:
r(pH, SAR, Co) = r1(SAR, Co)r2(pH) (6)
where:
r1 – effect of the exchangeable sodium percentage and dilution of the solution on hydraulic conductivity
r2 – effect of the soil solution pH
r1 and r2 were taken from the results of others (Suarez et al. 1984).
Multicomponent solute transport
Solute transport equations. The partial differential equation governing one-dimensional advective-dis-persive chemical transport under transient water-flow conditions in a partially saturated porous medium is as follows (Simunek& Suarez 1997):
k = 1, 2, ..., Nc (7)
where:
ck – total dissolved concentration of the aqueous species
k (g/cm3) (for values in the initial conditions see Table 1)
c‒k – total surface species concentration of the aqueous component k (g/g) (for values in the initial conditions see Table 1)
SAR = Na+/
√
Ca2+ + Mg2+2
MBE = 1
∑
n (Csi – Coi) n i=1RMSE =
[
1∑
n (Csi – Coi)2]
1/2n i=1
∂
[
Ks(
∂h + 1)]
= 0∂z ∂z
∂θwck + ρ ∂c‒k + ρ ∂c^
k = ∂
[
θwD ∂ck – qwck
]
c^k – total solid phase concentration of the aqueous component (g/g) (for values in the initial condi-tions see Table 1)
ρ – bulk density of the medium = 1.45 g/cm3
D – dispersion coefficient, in this study = 5.6 cm2/h
qw – volumetric flux = 0.25 cm/h
Nc – number of the primary aqueous species CO32–,
HCO3–, Cl–, SO 4
2–, Ca2+, Mg2+, K+,and Na+ that were considered in this study
Cation exchange and selectivity. The partition between the solid phase and the solution is described by the Gapon equation (Simunek& Suarez 1997):
(8)
where:
y, x – valence of species i and j, respectively
Kij – Gapon selectivity coefficient
The adsorption concentration is expressed in mol/ kg of soil. The cation exchange capacity, c‒r (CEC), is assumed to be constant and independent of pH:
(9)
RESULTS AND DISCUSSION Cation adsorption-exchange coefficient
The concentrations of soluble cations and exchange-able cations in each treatment are shown in Texchange-able 2.
The cation adsorption-exchange coefficients KCa-Na,
KCa-Mg,andKCa-K were calculated using Eq. (8) under different Ca2+ concentrations, and the results are shown in Table 3. The calculation assumed a constant CEC of 110.2 mmolc/kg.
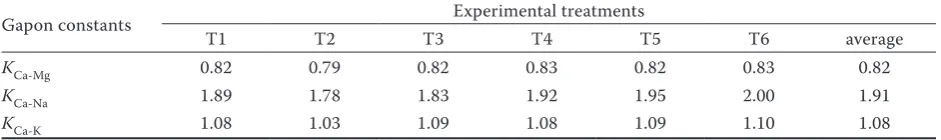
The average values of cation adsorption-exchange coefficients for KCa-Na, KCa-Mg,andKCa-K under dif-ferent Ca2+ concentrations (1.91, 0.82, and 1.08, respectively) were selected as the starting point for the soil reclamation process.
Changes in the physical and chemical properties of the soil and soil solution
during treatment with CaSO4
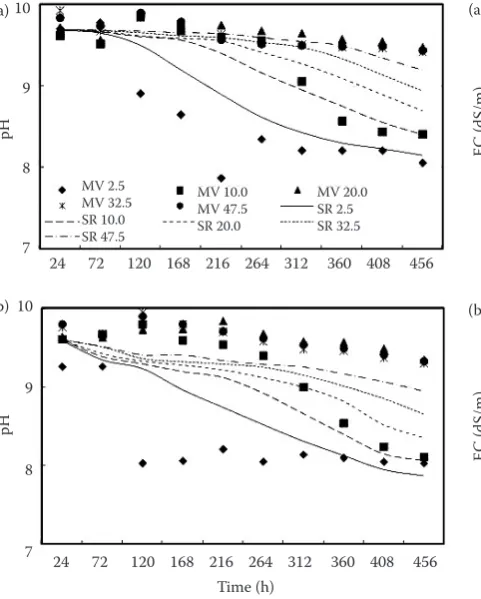
The pH of the soil solution. The measured values and simulation results of the pHin the soil solution at different soil depths and under different CaSO4 application treatments are shown in Figure 2. The soil solution pH gradually decreased as the leaching time increased in all the treatments. The pH of the solution decreased further as the Ca2+ concentration in the supplied water increased. The pH of the topsoil decreased more than that of the subsoil. Because of the great soil depth, the poor physicochemical properties of sodic soil, and the low soil hydraulic conductiv-ity, the Ca2+ in the supplied water first reacted with the Na+ in the soil colloids and the sodic salts of the topsoil. Despite the slight decrease in the pH of the subsoil solution, the magnitude of the decrease was much less than that of the topsoil. The solution pH Kij = c‒iy+ (cjx+)1/x
c‒jx+ (c
iy+)1/y
[image:5.595.63.532.536.651.2]c‒r = ∑ c‒i
Table 2. The content of soluble and exchangeable cations after ion adsorption and exchange under different treatments
Experimental treatments (g/l)
Soluble cations (mmol/l) Exchangeable cations (mmolc/kg)
K+ Na+ Ca2+ Mg2+ K+ Na+ Ca2+ Mg2+
T1/0 5.18 283.00 6.00 13.5 4.5 102.1 1.4 2.1
T2/0.25 5.19 284.25 15.05 13.4 4.5 101.8 1.7 2.1
T3/0.5 5.21 285.83 20.51 13.4 4.4 101.7 1.9 2.1
T4/1 5.22 287.17 23.15 13.5 4.4 101.6 1.9 2.1
T5/1.5 5.23 289.83 28.79 13.6 4.4 101.5 2.0 2.1
T6/2 5.22 290.75 33.82 13.6 4.4 101.4 2.1 2.1
Table 3. Calculated results for ion adsorption and exchange coefficients
Gapon constants Experimental treatments
T1 T2 T3 T4 T5 T6 average
KCa-Mg 0.82 0.79 0.82 0.83 0.82 0.83 0.82
KCa-Na 1.89 1.78 1.83 1.92 1.95 2.00 1.91
[image:5.595.63.534.689.759.2]of the soil at a depth of 0–15 cm was less than 8.5, which is still classified as a moderately sodic soil level.
The EC of the soil solution. The measured values and simulation results of EC in the soil solution at different soil depths and under different CaSO4 appli-cation treatments are shown in Figure 3. In the initial stage, the solution EC slightly increased. As the sodic soil constantly improved, the solution EC at each soil depth began to decrease, and the solution EC of the topsoil decreased more than that of the subsoil. As the concentration increased in the supplied water, the soil hydraulic conductivity also increased. However, the ef-fect of the concentration increase in the supplied water was lower than that of the increase in soil hydraulic conductivity. Therefore, when the Ca2+ concentration in the supplied water was higher, the EC exhibited a stronger decrease. When the concentrations of supplied water were 0.5 and 1.5 g/l, the soil depths, at which the solution EC was lower than 4 dS/m,were 0–15 and 0–25 cm after 480 h, respectively.
The soil hydraulic conductivity. The changes in the soil hydraulic conductivity (K) under different CaSO4 application treatments are shown in Figure 4.
[image:6.595.112.523.90.394.2]The soil solution K gradually increased as the leaching time increased in all the treatments. When treated with higher concentrations, the soil K was better than when treated with lower concentrations. This may be because CaSO4 application decreased soil solution pH, increased aggregation stability, and improved the soil hydraulic conductivity proper-ties. The efficiency of Ca2+ application to improve
Figure 2. Changes in the soil solution pH at different soil depths with leaching time: 0.5 g/l (a); 1.5 g/l (b); MV – me-asured values; SR – simulation results (in cm)
[image:6.595.68.309.95.395.2]Figure 3. Changes in the soil solution electrical conductivity at different soil depths with leaching time: 0.5 g/l (a); 1.5 g/l (b); MV – measured values; SR – simulation results (in cm)
Figure 4. Changes in hydraulic conductivity (K) with leaching time: treatment 1 (T1) – 0.5 g/l; treatment 2 (T2) – 1.5 g/l; MV – measured values; SR – simulation results (in cm)
Time (h)
0 40 80 120 160 200 240 280 320 360 400 440 480
T1 MV T2 MV T1 SR T2 SR
0.16
0.12
0.08
0.04
0.00
K
(c
m/h)
Time (h)
24 72 120 168 216 264 312 360 408 456 20
15
10
5
0
EC (
dS/m)
(b)
24 72 120 168 216 264 312 360 408 456 20
15
10
5
0
EC (
dS/m)
MV 2.5 MV 32.5 SR 10.0 SR 47.5
MV 10.0 MV 47.5 SR 20.0
MV 20.0 SR 2.5 SR 32.5
(a)
Time (h)
pH
24 72 120 168 216 264 312 360 408 456 10
9
8
7
pH
10
9
8
7
MV 2.5 MV 32.5 SR 10.0 SR 47.5
MV 10.0 MV 47.5 SR 20.0
MV 20.0 SR 2.5 SR 32.5
24 72 120 168 216 264 312 360 408 456 (a)
[image:6.595.305.530.582.714.2]permeability of sodic and saline-sodic soils was dem-onstrated previously (Suarez et al. 1984; Reading
et al. 2012a). The change of soil K under different treatments with leaching time can be simulated by HYDRUS-1D, which reflects the measured result.
Changes and simulations of cations at different
soil depths during treatment with CaSO4
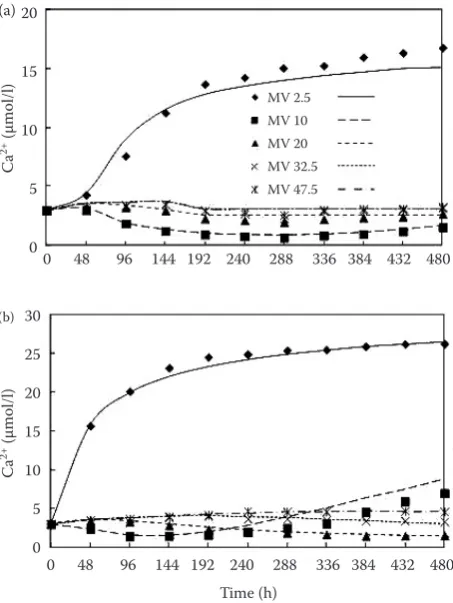
The Ca2+ in soil solution. The measured values
and simulation results of Ca2+ in the soil solution at different soil depths and under different CaSO4 ap-plication treatments are shown in Figure 5. The Ca2+ concentration in the topsoil solution increased rapidly under different treatments. The Ca2+ concentration in the subsoil solution had a slight decrease in the initial stage and then slowly increased. The trend at the site closest to the soil surface was more obvious than that at sampling site farther from the soil surface. The change in Ca2+ concentration at different soil depths under different treatments as a function of leaching time can be simulated by HYDRUS-1D in a way reflecting the measured result. In the 0–5 cm
soil layer, the Ca2+ concentration in the soil solution increased rapidly as the supply of CaSO4 increased. In the 5–15 cm soil layer, the Ca2+ concentration in the soil solution slightly decreased in the initial stage and then slowly increased. In the 15–55 cm soil layer, the Ca2+ concentration gradually decreased in all the soil layers, but the magnitude of this decrease was very low. The Ca2+ concentration at the site closer to the soil surface decreased more than that in the site more distant from the soil surface.
The Ca2+ decrease observed at soil depths of 5–15 cm may be due to the following reasons: the permeability is poor for sodic soils, and the trans-port of Ca2+ down into the 5–15 cm soil layer in the supplied water takes time (Mzezewa et al. 2003; Reading et al. 2012b). At the same time, the Ca2+ in the supplied water will react with the sodic salts in the soil solution and the exchangeable sodium in the soil colloid, which will consume a portion of the Ca2+ in the soil solution (Qadir et al. 2002; Singh et
al. 2013). Although the Ca2+ in the supplied water did not supply this soil layer, the Ca2+ in this soil layer penetrates to the soil layer underneath. Therefore, in the initial stages, the Ca2+ in the topsoil layer was not sufficiently supplying Ca2+ to the 5–15 cm soil layer, and the Ca2+ concentration in this soil layer gradually decreased. The extent of Ca2+ in the supplied water reaching down into the bottom soil layer gradually increased as the above soil layers improved. The Ca2+ concentration in the supplied water in treatment T2 was higher than that in T1; therefore, the trend in T2 was more obvious than that in T1. The changing trend of the Ca2+ concentration in the 15–55 cm soil layer should be consistent with that in the 5–15 cm, but the poor hydraulic conductivity of sodic soils led to the change in concentration that showed a trend that was slower than expected.
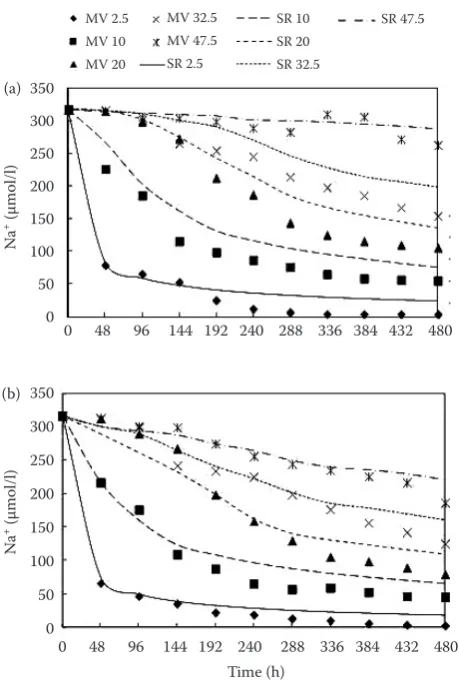
The Na+ in the soil solution. The measured values
[image:7.595.64.291.412.714.2]and simulation results of Na+ in soil solution at dif-ferent soil depths under difdif-ferent CaSO4 application treatments are shown in Figure 6. The Na+ concentra-tion in each soil soluconcentra-tion constantly decreased under different treatments, and the Na+ concentration in the topsoil solution decreased faster than in the sub-soil. The rate at which the concentration decreased at the site closer to the soil surface was faster than that in the site farther from the soil surface. When the soil was treated with a higher supplied solution concentration, the rate at which the Na+ concentra-tion decreased in the soil soluconcentra-tion was faster. The change of Na+ concentration at different soil depths
Figure 5. Ca2+ concentration atdifferent soil depths with
different supply solution: 0.5 g/l (a); 1.5 g/l (b); MV – me-asured values; SR – simulation results (in cm)
Time (h)
0 48 96 144 192 240 288 336 384 432 480
SR 2.5 SR 10 SR 20 SR 32.5 SR 47.5
30
25
20
15
10
5
0
Ca
2+ (μmol/l) 20
15
10
5
0
Ca
2+ (μmol/l)
0 48 96 144 192 240 288 336 384 432 480
MV 2.5 MV 10 MV 20 MV 32.5 MV 47.5
(a)
under different treatments with leaching time can be simulated by HYDRUS-1D, which reflects the measured result.
The source of Na+ in the soil solution consisted mainly of two parts: one was the Na+ contained in
soil in the original state, and the other was the Na+ exchanged by Ca2+ in the soil solution from the soil colloid (Qadir et al. 2005; Yazdanpanah & Mah-moodabadi 2013). The Na+ concentration might decrease due to the following: no Na+ was present in the supplied water, although Na+ was being con-stantly exchanged from the soil colloid (Li et al.
2004; Li & Keren 2008), but the relative amount of Na+ was low. Because the Na+ in the soil solution leached out of the soils, the soil levels constantly decreased. Because Na+ was transported from the surface soil layer to the bottom soil layer, and the Na+ at the surface soil layer was supplementary to the bottom soil layer, the rate of decrease of Na+ in the bottom soil layer was slower than that in the surface soil layer.
Validation of the HYDRUS-1D model
As shown in Table 4, the values of the MBE and RMSE between the measured and simulated Ca2+ concentrations ranged from 0.01 to 0.91 and 0.71 to 1.13, respectively; the values for the measured and simulated Na+ concentrations ranged from 10.15 to 59.78 and 11.45 to 70.93. The RMSE and the absolute value of MBE between the simulated and measured Ca2+ and Na+ concentrations at the five soil depths were relatively low, and the RMSE was more than the MBE for Ca2+ and Na+ concentrations at differ-ent soil depths under differdiffer-ent treatmdiffer-ents. However, the degree, at which the RMSE value exceeded the MBE, was relatively low.
[image:8.595.62.292.91.439.2]These data indicate that Hydus-1D can be used to confidently simulate the dynamic changes of Ca2+ and Na+ concentrations at different soil depths under different treatments with leaching time (Willmott
Table 4. Statistical parameters indicative of model performance
Soil depth (cm)
CaSO4 (g/l)
0.5 1.5
Ca2+ concentration Na+ concentration Ca2+ concentration Na+ concentration
RMSE MBE RMSE MBE RMSE MBE RMSE MBE
2.5 0.63 > –0.01 18.54 –13.99 0.59 0.33 11.45 –10.15
10 0.12 –0.11 52.25 –48.81 1.22 –0.94 39.34 –35.70
20 0.70 –0.58 62.97 –50.50 0.15 –0.10 47.43 –30.54
32.5 0.42 0.25 70.93 –59.78 0.21 –0.09 50.99 –40.04
47.5 1.13 0.91 22.11 –17.11 0.12 –0.01 29.04 –18.17
[image:8.595.63.538.594.739.2]RMSE – root mean square deviation; MBE – mean bias error
Figure 6. Na+ concentration at different soil depths with
different supply solution: 0.5 g/l (a); 1.5 g/l (b); MV – me-asured values; SR – simulation results (in cm)
Time (h)
0 48 96 144 192 240 288 336 384 432 480 350
300 250 200 150 100 50 0
Na
+ (μmol/l) (b)
Na
+ (μmol/l) 350 300 250 200 150 100 50 0
0 48 96 144 192 240 288 336 384 432 480
MV 2.5 MV 10 MV 20
SR 10 SR 20 SR 32.5 MV 32.5
MV 47.5 SR 2.5
SR 47.5
1982; Simunek et al. 2012). Overall, the simulated Ca2+ and Na+ concentrations values obtained with the HYDRUS-1D software were in agreement with the measured values, despite some discrepancies (Figures 5 and 6). The agreement was good, par-ticularly considering the complexity of conditions to which the model was subjected, including the cation adsorption-exchange coefficient, the effects of the exchangeable sodium percentage, of the dilution of the solution on hydraulic conductivity, and of the soil solution pH (Simunek et al. 2008).
CONCLUSION
The following conclusions can be drawn from our findings:
(1) The ion adsorption-exchange coefficients KCa-Na,
KCa-Mg,andKCa-K were 1.9, 0.8, and 1.1, respec-tively, according to the static cation exchange batch experiments.
(2) Applying CaSO4 and leaching are both efficient methods to reclaim sodic soil. The soil solu-tion pH and sodium adsorpsolu-tion ratio gradually decreased as the leaching time increased in all the treatments.
(3) The HYDRUS-1D software was able to success-fully simulate both the dynamic changes of Ca2+ and Na+ concentrations at different soil depths under different treatments with leaching time and the effects of soil hydraulic conductivity and soil pH on the transport of Ca2+ and Na+. The correspondence between the observed and simulated variables was remarkably accurate.
Acknowledgements. This research was supported by
the National Natural Science Foundation of China (No. 50749032), Fundamental Research Funds for the Central Universities of China (No. 2652012072), and Beijing Higher Education Young Elite Teacher Project.
References
Chi C.M., Zhao C.W., Sun X.J., Wang Z.C. (2012): Reclama-tion of saline-sodic soil properties and improvement of rice (Oriza sativa L.) growth and yield using desulfurized gypsum in the west of songnen plain, Northeast China. Geoderma, 187: 24–30.
Chun S., Nishiyama M., Matsumoto S. (2001): Sodic soils reclaimed with by-product from flue gas desulfurization: Corn production and soil quality. Environmental Pollu-tion, 114: 453–459.
Goncalves M.C., Simunek J., Ramos T.B., Martins J.C., Neves M.J., Pires F.P. (2006): Multicomponent solute transport in soil lysimeters irrigated with waters of dif-ferent quality. Water Resources Research, 42: W08401. Kumar D., Singh B. (2003): The use of coal fly ash in sodic
soil reclamation. Land Degradation & Development, 14: 285–299.
Li F., Keren R. (2008): Native caco3 mineral dissolution and its contribution to sodic calcareous soil reclamation under laboratory conditions. Arid Land Research and Management, 22: 1–15.
Li Q.S., Willardson L.S., Li L.X., Liu C.J., Wu L.Z. (2004): Amelioration of saline-sodic soil with mildly saline wa-ter in the songnen plain, northeast china. Soil Use and Management, 20: 439–443.
Murtaza G., Murtaza B., Usman H.M., Ghafoor A. (2013): Amelioration of saline-sodic soil using gypsum and low quality water in following sorghum-berseem crop rota-tion. International Journal of Agriculture and Biology, 15: 640–648.
Mzezewa J., Gotosa J., Nyamwanza B. (2003): Characterisa-tion of a sodic soil catena for reclamaCharacterisa-tion and improve-ment strategies. Geoderma, 113: 161–175.
Nayak A.K., Mishra V.K., Sharma D.K., Jha S.K., Singh C.S., Shahabuddin M., Shahid M. (2013): Efficiency of phospho-gypsum and mined phospho-gypsum in reclamation and productivity of rice-wheat cropping system in sodic soil. Communica-tions in Soil Science and Plant Analysis, 44: 909–921. Prathapar S.A., Aslam M., Kahlown M.A., Iqbal Z., Qureshi
A.S. (2005): Gypsum slotting to ameliorate sodic soils of pakistan. Irrigation and Drainage, 54: 509–517.
Qadir M., Ghafoor A., Murtaza G. (2000): Amelioration strategies for saline soils: A review. Land Degradation & Development, 11: 501–521.
Qadir M., Ghafoor A., Murtaza G. (2001a): Use of saline-sodic waters through phytoremediation of calcareous saline-sodic soils. Agricultural Water Management, 50: 197–210.
Qadir M., Schubert S., Ghafoor A., Murtaza G. (2001b): Amelioration strategies for sodic soils: A review. Land Degradation & Development, 12: 357–386.
Qadir M., Qureshi R.H., Ahmad N. (2002): Amelioration of calcareous saline sodic soils through phytoremediation and chemical strategies. Soil Use and Management, 18: 381–385.
Qadir M., Noble A.D., Oster J.D., Schubert S., Ghafoor A. (2005): Driving forces for sodium removal during phytoremediation of calcareous sodic and saline-sodic soils: A review. Soil Use and Management, 21: 173–180. Ramos T.B., Simunek J., Goncalves M.C., Martins J.C.,
evaluation of a multicomponent solute transport model in soils irrigated with saline waters. Journal of Hydrol-ogy, 407: 129–144.
Reading L.P., Baumgartl T., Bristow K.L., Lockington D.A. (2012a): Applying hydrus to flow in a sodic clay soil with solution composition-dependent hydraulic conductivity. Vadose Zone Journal, 11: doi 10.2136/vzj2011.0137. Reading L.P., Baumgartl T., Bristow K.L., Lockington D.A.
(2012b): Hydraulic conductivity increases in a sodic clay soil in response to gypsum applications: Impacts of bulk density and cation exchange. Soil Science, 177: 165–171. Sahin U., Anapali O. (2005): A laboratory study of the ef-fects of water dissolved gypsum application on hydraulic conductivity of saline-sodic soil under intermittent pond-ing conditions. Irish Journal of Agricultural and Food Research, 44: 297–303.
Sahin U., Eroglu S., Sahin F. (2011): Microbial applica-tion with gypsum increases the saturated hydraulic con-ductivity of saline-sodic soils. Applied Soil Ecology, 48: 247–250.
Sakai Y., Matsumoto S., Sadakata M. (2004): Alkali soil rec-lamation with flue gas desulfurization gypsum in china and assessment of metal content in corn grains. Soil & Sediment Contamination, 13: 65–80.
Seaman J.C., Chang H., Goldberg S., Simunek J. (2012): Reactive transport modeling. Vadose Zone Journal, 11: doi 10.2136/vzj2013.03.0058
Simunek J., Suarez D.L. (1997): Sodic soil reclamation using multicomponent transport modeling. Journal of Irriga-tion and Drainage Engineering – ASCE, 123: 367–376. Simunek J., van Genuchten M.T., Sejna M. (2008):
Develop-ment and applications of the HYDRUS and STANMOD software packages and related codes. Vadose Zone Jour-nal, 7: 587–600.
Simunek J., van Genuchten M.T., Sejna M. (2012): HYDRUS: Model use, calibration, and validation. Transactions of the ASABE, 55: 1261–1274.
Singh K., Singh B., Singh R.R. (2013): Effect of land reha-bilitation on physicochemical and microbial properties of a sodic soil. Catena, 109: 49–57.
Sivapalan S. (2005): Effect of gypsum and polyacrylamides on water turbidity and infiltration in a sodic soil. Austral-ian Journal of Soil Research, 43: 723–733.
Suarez D.L. (2001): Sodic soil reclamation: Modelling and field study. Australian Journal of Soil Research, 39: 1225–1246.
Suarez D.L., Rhoades J.D., Lavado R., Grieve C.M. (1984): Effect of pH on saturated hydraulic conductivity and soil dispersion. Soil Science Society of America Journal, 48: 50–55.
Wang J., Bai Z., Yang P. (2014): Mechanism and numerical simulation of multicomponent solute transport in sodic soils reclaimed by calcium sulfate. Environmental Earth Sciences, 72: 157–169.
Wang J.D., Gong S.H., Xu D., Juan S., Mu J.X. (2013): Nu-merical simulations and validations of water flow and heat transport in a subsurface drip irrigation system using hydrus-2d. Irrigation and Drainage, 62: 97–106. Wang S.J., Chen C.H., Xu X.C., Li Y.J. (2008): Amelioration
of alkali soil using flue gas desulfurization byproducts: Productivity and environmental quality. Environmental Pollution, 151: 200–204.
Willmott C.J. (1982): Some comments on the evaluation of model performance. Bulletin of the American Meteoro-logical Society, 63: 1309–1313.
Yazdanpanah N., Mahmoodabadi M. (2013): Reclamation of calcareous saline-sodic soil using different amendments: Time changes of soluble cations in leachate. Arabian Journal of Geosciences, 6: 2519–2528.
Received for publication January 27, 2015 Accepted after corrections May 5, 2015
Corresponding author: