Partially supported by the European Regional Development Fund (Project No. POIG.01.01.02-014-090/09 “BIOFOOD – innovative, functional products of animal origin”).
Effects of supplementary vegetable and animal fats
on the slaughter values of fatteners, meat quality,
and fatty acid profile in pigs
D. Lisiak
1, E. Grześkowiak
1, K. Borzuta
1, S. Raj
2, P. Janiszewski
1, G. Skiba
21Department of Meat and Fat Technology, Institute of Agricultural and Food Biotechnology,
Poznań, Poland
2The Kielanowski Institute of Animal Nutrition and Physiology, Polish Academy of Sciences,
Jabłonna, Poland
ABSTRACT: The study was conducted on 32 hybrids of (Polish Large White × Danish Landrace) × Duroc breeds fed similar energy content feed, however differing in fat diet supplements. The animals were divided into four groups in which the following fat supplements were added to the feed: A – rapeseed and linseed oils, B – rapeseed and fish oils + swine fat, C – linseed and fish oils, D – rapeseed and linseed oils + lard. The carcass slaughter value was estimated and physicochemical and sensorytraits of longissimus lumborum (LL) and triceps brachii (TB) muscles were determined. The content of fatty acids in the subcutaneous fat of the loin as well as in the raw LL and TB muscles was estimated as well. It was shown that there were no significant differences in the range of slaughter value traits and meat quality between the groups. However, it was found that different kinds of supplemented fat had a different effect on the content of the polyunsaturated fatty acids in the backfat and in the raw LL muscle. The lowest level of fatty acids characterized the group of pigs fed with supplements consisting of rapeseed and fish oils + lard. The highest values were detected among fatteners sup-plemented with linseed. The kind of supsup-plemented fat affected the changes in the level of PUFA n-3 fatty acids, especially the linolenic acid C18:3 in backfat. The n-6/n-3 ratio in pigs fed with a greater share of linseed (C and D groups) was better (about 3) than in pigs which obtained a greater portion of rapeseed and fish oils (about 5.5). In both the muscles and fat of fatteners from groups B and C the DHA content was 2–3 times higher than in A and D groups. Higher EPA content was found in the TB muscle.
Keywords: pigs’ feeding; oils; backfat; triceps brachii; longissimus lumborum
The relationships between the tissue composi-tion of carcasses, their technologicalusefulness, and commercial value have been known for a long time (Branscheid et al., 1990). The most valuable component of a carcass is the meat and then the fat. The slaughter value of the carcass increases with the increase of the meat content. On the other hand, there are also positive relationships betweenthe level of the intramuscular fat and meat juiciness, tenderness, and palatability. According to Wood et al. (1994, 2008), the content of the intramuscular fat in the range of 2–3% is the most favourable for the expected
group n-3 has increased. The most significant of this group are eicosapentaenoic (EPA, C20:5) and docosehexanoic (DHA, C20:6) acids. These acids can be accreted in animals’ tissues directly from their feed or can be synthesized from α-linolenic acid which is a precursor of these fatty acids.The basic source of α-linolenic acid is vegetable oil (linseed, rapeseed). In full-fat flaxseeds α-linolenic acid amounts to about 52% of the total of fatty acids, however in rapeseed oil it is 8.1%, in fish 1.2%, and in swine fat 0.8% (Barowicz and Kędzior, 2000; Ptasznik and Jerzewska, 2005; Makała and Kern-Jedrychowski, 2006).
Many authors described the positive effect of flax seeds as a supplement in pig feed on the increase of α-linolenicacid (C18:3 n-3) and on the decrease of the PUFA n-6/n-3 acids ratio (Barowicz and Kędzior, 2000; Nuernberg et al., 2005; Haak et al., 2008). Worse results in the modification of the fatty acids profile were stated in the case when olive oil (Nuernberg et al., 2005) or soybean oil (Benz et al., 2011) was used. According to Mitsumoto et al. (1991) and Leksanich et al. (1997), too high amount of polyunsaturated fatty acids in the intramuscular and depot fat affects the fat consistency (soft, sticky), worsens the taste, and also durability. For this reason, the supplementation of polyunsaturated fatty acids in feeding animals requires the use ofantioxidants such as vitamin E. Vitamin E breaks the chain of free radical reactions in body cells, so the meat of such fed animals can be stored longer without oxidative fat changes (Barowicz and Kędzior, 2000).
The presented literature review concerning the use of supplements of various plant oils in pig nutrition did not give a full answer to what kind of supplement and in which dose must be used to obtain a raw product with high slaughter value and good quality of meat. Thus, the aim of the present study was to obtain dietetic meat by using fat supplements composed ofdifferent proportions oflinseed, rapeseed, and fish oils and lard in the pigs’ feeding. The studies included the slaughter value of carcasses, the physicochemical and sensory traits of meat, and also the profile of fatty acids.
MATERIAL AND METHODS Animals and diets
Studies were conducted on 32 crossbred pigs, progeny of a Duroc boar and eight half-sisters (Polish
Large White × Danish Landrace). The animals came from one boar and related mothers. The animals were maintained individually in pens equipped with automatic feeders and nipple drinkers, in the pigsty of the Institute of Animal Physiology and Nutrition in the Polish Academy of Sciences in Jabłonna near Warsaw, under the same thermo-neutral conditions: air temperature 18–20°C, humidity 60–70%, and the air speed 0.2–4 m/s.
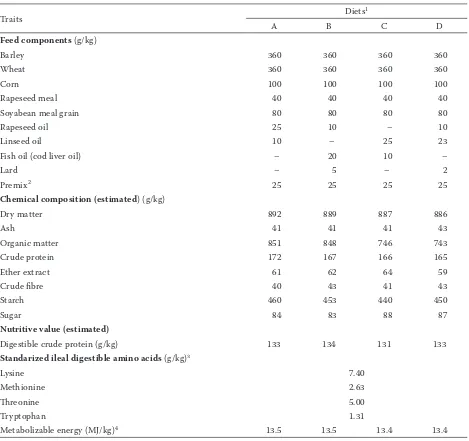
The feedswere prepared from barley, maize, wheat, soybeans, rapeseed supplemented with premix containing vitamins, minerals, and crys-talline amino acids. In each feed approximately 10% of the metabolic energy was replaced by a fat mixture (to the amount of 3.5%) containing fish oil, linseed or rapeseed, and lard. All mix-tures were isoenergetic (13.5 MJ ME/kg) and iso-protein (133 g/kgdigestible protein), the ratio of lysine to energy amounted to0.55 g/MJ. Essential amino acids were balanced regarding the content of standardized ileal digestible (Degussa, 1999). The feeds differed in the concentration of omega-3 acid. The ingredients and chemical composition of the feeds, nutritive value, and metabolic energy content are shown in Table 1.
Nutrition
The animals were fed semi ad libitum(95% of ad libitum intake), andhad continuous access to water from nipple drinkers. In the period of 25–60 kg of body weight (BW) the pigswere fed with the grower mixture (13.5 MJ ME and 7.4 g of lysine per 1 kg feed). When the pigs reached BW of 60 kg, they were allotted into 4 groups: A, B, C, and D (n = 8 per group) (Table 1). The individual groups of pigs were offered feeds with similar energy content and digestible protein content and also lysine, but different fat supplements, until they reached BW of about 105 kg (about 51 days of fattening). The content of fatty acids in the feeds of the studied groups was determined (Table 2).
Carcass measurements
ultrasonic Ultra Fom 300 device (Carometec A/S, Herlev, Denmark) were performed on the warm, left half carcasses. Callipers were used for measuring the carcass fat thickness in the following points: backfat thickness on the back, i.e. over the last rib, backfat thickness over the beginning of the muscle gluteus medius (cross-section I), backfat thick-ness over the middle of the muscle gluteus medius
(cross-section II), backfat thickness over the end of the muscle gluteus medius (cross-section III).
Pork quality measurements
[image:3.595.64.533.98.539.2]pH and electrical conductivity of muscles. In the muscle longissimus lumborum (LL) at the height Table 1. Components, chemical composition, and nutritive value of compound feed (g/kg)
Traits Diets1
A B C D
Feed components (g/kg)
Barley 360 360 360 360
Wheat 360 360 360 360
Corn 100 100 100 100
Rapeseed meal 40 40 40 40
Soyabean meal grain 80 80 80 80
Rapeseed oil 25 10 – 10
Linseed oil 10 – 25 23
Fish oil (cod liver oil) – 20 10 –
Lard – 5 – 2
Premix2 25 25 25 25
Chemical composition (estimated) (g/kg)
Dry matter 892 889 887 886
Ash 41 41 41 43
Organic matter 851 848 746 743
Crude protein 172 167 166 165
Ether extract 61 62 64 59
Crude fibre 40 43 41 43
Starch 460 453 440 450
Sugar 84 83 88 87
Nutritive value (estimated)
Digestible crude protein (g/kg) 133 134 131 133
Standarized ileal digestible amino acids (g/kg)3
Lysine 7.40
Methionine 2.63
Threonine 5.00
Tryptophan 1.31
Metabolizable energy (MJ/kg)4 13.5 13.5 13.4 13.4
1diets: A = 2.5% rapeseed oil and 1% linseed oil, B = 1% rapeseed oil, 2% fish oil + 0.5% lard, C = 2.5% linseed oil and 1% fish
oil, D = 2.3% linseed oil, 1% rapeseed oil + 0.2% lard
2premix as 2.5% of the diet provided the required amount of micro- and macrominerals, essential amino acids, and vitamins
(α-tocopherol 240 mg/kg of feed)
3according to Degussa (1999)
4calculated on the basis of digestible nutrient components, taking into account correction on the content of digestible protein,
of the 1st–2nd lumbar basilar vertebra and also in
the muscle triceps brachii (TP), pH measurements were carried out using the pH meter Radiometer PHM 80 Portable (Radimeter Analytical S.A. Vil-leurbanne, Cedex, France) with a composite Danish made electrode at 45 min (pH45) and 24 h (pH24) postmortem (ISO 2917, 2001). The electrical con-ductivity was measured 24 h postmortem in the muscle LL using the conductor LF-Star Model 340 (Mettler-Toledo, Greifensee, Switzerland).
Instrumental and subjective colour and mar-bling evaluation. The instrumental measurement of the colour was performed 24 h postmortem on the section of the muscle LL between the 1st–2nd
basilar vertebra. Measurements were made using a Chroma Meter CR-400 camera (Konica Minolta Co. Ltd., Osaka, Japan) estimating L* (lightness), a* (redness), and b* (yellowness). The subjec-tive evaluation of the colour was conducted by a five-person team using a five-point model of colours, 1 point = the colour of pale pinkish grey to white, on the other hand, 5 points = dark pur-plish red (NPPC, 1991; Kauffman et al., 1992). The estimation of marbling in the same section of both studied muscles was conducted by using the standard five-point model of marbling (1 = devoid to practically devoid;5 = moderately abundant or greater) (Kauffman et al., 1992; NPPC, 1999).
Drip loss, cooking and roast losses. About 100 g samples of the muscles LL and TB were placed in plastic bags and left at a temperature of 4°C for 48 h. Then the samples were weighed and from the difference of weights, the drip loss was calculated. Samples of the LL muscle of the thoracic part were weighed and heated in water to reach the internal temperature of 75°C in the middle of the meat sam-ple. After cooling, the samples were weighed and from the difference of the weight, the percentage losses during the meat cooking were calculated. The weighed meat sample of TBwas placed in an electric oven to reach the internal temperature of 80°C in the middle of the meat sample and then from the weight difference a calculation was made to find the loss from roasting (Honikel, 1997).
Water, intramuscular fat, and total protein content. The water content was determined ac-cording to ISO 1442 (2000). It was transferred to the cell weight of about a 3 g sample of minced meat (prepared according to ISO 3100 (1999)), weighed, and dried at a temperature of 105°C to obtain a constant weight. The water content in percentages was calculated from weight difference
of the sample before and after drying. The content of the intramuscular fat was determined according to ISO 1444 (2000). The dried, weighed sample was placed in an extracted thimble and fatty substances were extracted with petroleum ether using the automatic extraction system SOXTHERM from the Gerhardt Laboratory System (Königswinter, Germany). The fat content was calculated from the difference of the samples weight before and after extraction. The total protein content was deter-mined according to the Polish Standard Method PN-75/A-04018 (2002) using the method of the Kjeltec System 1002 Distilling Unit.
Sensory evaluation. The sensory evaluation of the cooked LL muscle and the roasted TB muscle was carried out by a five-person trained team that tested the sensory sensitivity (ISO 8586-1, 1996; ISO 5496, 1997; ISO 3972, 1998). A five-point scale was used to evaluate flavour, juiciness, ten-derness, and palatability (NPPC, 1991; ISO 4121, 1998). The flavour and palatability scale: 1 = very unacceptable; 5 = very acceptable. The juiciness scale: 1 = very dry; 5 = very juicy. The tenderness scale: 1 = very tough; 5 = very tender.
Warner-Bratzler shear force. From the cooked LL muscle and roasted TB muscle, cylindrical samples with a diameter of 2.54 cm were cut off. The shear force was measured by the Warner-Bratzler apparatus.
Lipid analysis. The profile of the fatty acids was determined in the following tissues: dorsal backfat, intramuscular fat of the raw LL muscle, and also intramuscular fat of the raw TB muscle. Esters of fatty acids of the tested fats were prepared according to ISO 5509 (1996). The determination of the composition of fatty acids was conducted by gas chromatography using a HP 6890 apparatus (Agilent Technologies Inc., Santa Clara, USA) equipped with a flame-ionizing detector and a high-polar column BPX 70 (length 60 m, film thickness 0.25 μm, internal diameter 0.22 mm). The analysis was carried out in the programmed temperature and time. The content of the tested fatty acids was expressed as g/100 g of the total of all fatty acids in the sample.
Statistical analysis
RESULTS AND DISCUSSION
Estimation results of the carcass slaughter value
The characteristic traits of the slaughter value of the examined carcasses of three-race hybrids (Polish Large White × Danish Landrace) × Duroc are shown in Table 3. The examined groups of animals (A–D) were fed the same composition of feed components, while the individual groups varied in the fat supplements added to the feed (Table 1). The presented data show that feeding with fat supplements caused no significant differ-ences between the groups in a range of studied slaughter traits. The average carcass weight was similar (82.54–84.3 kg), however the meatiness of carcasses varied (54.82–57.3%). It was also shown that the carcasses of the compared groups did not differ significantly regarding the back-fat thickness measured at four locations on the carcass (17.9–20.4 mm) and also after slaughter yield (79–80.3%). Other authors (Jaturasitha et al.,
[image:5.595.66.531.412.684.2]2009) have also shown that pigs fed with tuna oil supplements exhibited no significant differences in the slaughter yield, meatiness, and also the backfat thickness compared to the control group. Similarly, Mas et al. (2011) in pigs of Landrace × Large White breed fed soybean seeds with a sup-plement of the oleic acidGreedy-Grass OLIVA stated no significant differences in meatiness and backfat thickness in comparison to the control group. Also Casa et al. (2010) in the hybrids of pigs (Landrace × Yorkshire) × Duroc, which were given a diet supplemented with α-linolenic acid, noted a similar result as concerns the slaughter yield of carcasses, meat quality, ham and loin yields as in the control group. Moreover, the simi-lar meatiness and backfat thickness (20.02 mm on the average) as in the presented study were recorded in pig carcasses of the Landrace breed and its crossbreeds with Yorkshire and Duroc pigs (Koćwin-Podsiadła et al., 2004). Contrarily, Sab-bioni et al. (2002) in crossbreeds of the Duroc × Large White × Landrace pigs obtained by about 10% lower meatiness (47.4%) and thicker backfat
Table 2. Fatty acids concentration of the diets (g/kg)
Fatty acids Diets1
A B C D
ΣSFA 7.56 9.59 9.51 9.32
C14:0 0.05 0.50 0.42 0.15
C16:0 5.87 7.24 6.99 6.86
C18:0 1.04 1.31 1.63 1.77
ΣMUFA 17.42 16.74 15.14 15.12
C16:1 0.08 0.78 0.63 0.22
C18:1 16.65 14.00 12.23 14.04
ΣPUFA 24.71 23.63 28.68 27.95
LA C18:2 n-6 19.58 19.58 18.22 19.31
ALA C18:3 n-3 5.13 2.30 8.98 8.51
EPA 0.00 0.70 0.59 0.03
DPA 0.00 0.12 0.09 0.03
DHA 0.00 0.93 0.76 0.15
AA C20:4 0.00 0.01 0.00 0.00
ΣPUFA/ΣSFA2 3.27 2.46 3.01 3.00
C18:2n-6/C18:3n-33 3.82 8.53 2.03 2.27
∑PUFA n-3/∑PUFA n-64 3.82 4.84 1.75 2.22
1diets: A = 2.5% rapeseed oil and 1% linseed oil, B = 1% rapeseed oil, 2% fish oil + 0.5% lard, C = 2.5% linseed oil and 1% fish
oil, D = 2.3% linseed oil, 1% rapeseed oil + 0.2% lard
2ratio of total polyunsaturated fatty acids (PUFA) to saturated fatty acids (SFA) 3proportion of linoleic acid to α-linolenic acid
(30.6 mm on the average) from three measure-ments on the carcass. This diversity in comparison to the results of the present work may be caused by different nutritive and environmental condi-tions. Mucha and Różycki (2004) showed that with age, the backfat accumulates much faster in the capitular and caudal parts than in the region of the last ribs.
Quality traits of longissimus lumborum and triceps brachii muscles
Results of the quality traits of the LLmuscle were shown in Table 4 and those on TB in Table 5. The pH values of both muscles obtained 45 min after slaughter confirmed the correct run of the process of glycolysis in the muscular tissue. Also, results of the pH measurements 24 h after slaughter are correct and among others point to proper treat-ment before slaughter. The obtained results of pH and the electrical conductivity confirmed that in the studied population, there were no deviations in the meat quality between the types PSE and DFD (Kauffman et al., 1993; Fischer, 2001; Homsi and Francisco, 2003). The degree of the tissular acidification is strictly related to the colour and drip loss. Relatively lower drip losses were reported in TB (1.98–2.54%) and higher in LL (3.82–5.15%) muscular tissue. Homsi and Francisco (2003) also mentioned similar values of drip loss for both the
muscles. There were no statistically significant dif-ferences in the range of pH values, lightness of the colour,and size of the drip loss between the studied groups. It indicates that these parameters were not influenced by oil supplements in the diet. Also, in the studies of other authors, in the LL muscle of pigs fed a diet either with or without oil supplements (e.g. linseed or olive oil), no differences were noted in the values of pH45, the drip loss, and colour defined subjectively using a Minolta apparatus (Lauridsen et al., 2005; Nuernberg et al., 2005; Jaturasitha et al., 2009; Mas et al., 2011). The loss during cooking of the LL muscle was higher in group C (29.71%) in comparison to other groups (25.09–27.28%). It can be associated with the higher water content and lower fat level in the muscles of these pigs.
[image:6.595.64.532.101.297.2]Interesting studies were conducted by Moeller et al. (2010) who analyzed the loss of meat weight in dependence on the temperature of the heat treat-ment ranging 62.8–79.4°C. These authors stated lower weight losses at lower temperatures and larger at higher temperatures (24.6% and 28.2%, respectively). Among the studied groups, the high-est fat content in the LL muscle was recorded in the carcasses of group B (2.62%) and the lowest in those of group C (1.44%). Similarly, the highest level of intramuscular fat in the TB muscle exhibited group B carcasses – 2.31% and the lowest those of group C – 1.61%. Other authors of works on pig feeding with fat supplements in the diet have also noted no statistically significant differences in the Table 3. Effect of oil diet inclusion on carcass characteristics (n = 8)
Carcass characteristics Diets1 SEM Significance
A B C D
Live weight (kg) 105.10 103.90 104.18 104.19 2.38 ns
Hot carcass weight (kg) 84.3 82.54 83.59 83.02 2.10 ns Meat content in carcass (%) 57.30 56.94 54.82 56.41 1.82 ns Backfat thickness (mm)
cross-section I 21.25 21.12 24.12 22.0 3.41 ns
cross-section II 13.88 13.75 16.63 14.38 2.59 ns
cross-section III 22.75 23.13 23.25 24.0 3.59 ns
over last rib 13.87 13.75 17.75 15.5 3.61 ns
Backfat thickness (mm)
(means from 4 measurements) 17.94 17.93 20.43 18.97 3.29 ns Dressing percentage (%) 80.3 79.45 80.29 79.44 1.49 ns
1diets: A = 2.5% rapeseed oil and 1% linseed oil, B = 1% rapeseed oil, 2% fish oil + 0.5% lard, C = 2.5% linseed oil and 1% fish
intermuscular fatof the LL muscle between the control and experimental groups (Jaturasitha et al., 2009). However, these differences were noted
[image:7.595.64.531.101.316.2]be-tween sex – higher muscular fatness was observed in barrows than in gilts (Nuernberg et al., 2005; Mas et al., 2011). In our study the protein level in Table 4. Effect of oil diet inclusion on traits of raw longissimus lumborum muscle
Traits Diets1 SEM Significance
A B C D
pH45 6.13 6.22 6.32 6.28 0.24 ns
pH24 5.57 5.55 5.86 5.75 0.26 ns
EC242 6.16 5.56 5.97 4.90 0.23 ns
L* (lightness) 50.17 49.34 50.14 49.34 2.82 ns
a* (redness) 5.68 5.59 5.66 5.84 1.00 ns
b* (yellowness) 2.03 2.13 1.64 2.37 1.15 ns
Drip loss (%) 3.92 5.15 4.77 4.58 2.01 ns
Cooking loss (%) 25.09a 27.28a 29.71b 27.08a 2.82 *
Colour evaluation (score)3 2.20 2.16 2.16 2.41 0.28 ns
Marbling (score)4 2.17 2.44 2.65 2.33 0.62 ns
Moisture content (%) 73.10a 72.65a 74.49b 74.02a 1.18 *
Fat content (%)5 2.10 2.62 1.44 1.96 0.96 ns
Protein content (%) 23.70 23.63 22.97 22.91 0.96 ns
1diets: A = 2.5% rapeseed oil and 1% linseed oil, B = 1% rapeseed oil, 2% fish oil + 0.5% lard, C = 2.5% linseed oil and 1% fish
oil, D = 2.3% linseed oil, 1% rapeseed oil + 0.2% lard
2electrical conductivity
3colour scale (1–5): 1 = pale pinkish gray to white, 5 = dark purplish red (NPPC, 1991)
4marbling scale (1–5): 1 = devoid to practically devoid, 5 = moderately abundant or greater (NPPC – Kaufman, 1992) 5intramuscular fat content
a,bdifferent letters within a row indicate significant differences, ns = nonsignificant difference, *P ≤ 0.05
Table 5. Effect of oil diet inclusion on traits of raw triceps brachii muscle
Traits Diets1 SEM Significance
A B C D
pH24 5.75 5.82 5.72 5.67 0.18 ns
L* (lightness) 44.89 43.93 43.43 43.93 1.78 ns
a* (redness) 11.05 12.01 12.07 11.08 1.60 ns
b* (yellowness) 2.15 2.88 2.30 3.16 1.12 ns
Drip loss (%) 1.98 2.74 2.75 2.54 1.31 ns
Colour evaluation (score)2 2.16 2.52 2.18 2.24 0.53 ns
Roast loss (%) 33.78 37.55 32.63 34.38 4.18 ns
Marbling (score)3 3.62 3.27 3.30 3.61 0.23 ns
Moisture content (%) 75.3 74.2 75.6 75.49 0.90 ns
Fat content (%) 2.10 2.32 1.61 2.28 0.80 ns
Protein content (%) 21.5 22.4 21.64 21.11 0.95 ns
1diets: A = 2.5% rapeseed oil and 1% linseed oil, B = 1% rapeseed oil, 2% fish oil + 0.5% lard, C = 2.5% linseed oil and 1% fish
oil, D = 2.3% linseed oil, 1% rapeseed oil + 0.2% lard
2colour scale (1–5): 1 = pale pinkish gray to white, 5 = dark purplish red (NPPC, 1991)
3marbling scale (1–5): 1 = devoid to practically devoid, 5 = moderately abundant or greater (NPPC – Kaufman, 1992)
[image:7.595.64.536.499.686.2]both muscles did not differ significantly between the groups. Moreover, in both musclesthe protein level was relatively balanced (22.91–23.70% and 21.1–22.4% in the LL and TB muscles, respectively).
Weight losses during roasting of the TB mus-cle were rather diversebetween the groups, but insignificantly. Lower thermal weight losses were recorded in the muscles of group C (32.63%) and higher in group B (37.55%).
Sensoric quality of the longissimus lumborum and triceps brachii muscles
Results of the sensory evaluation of the cooked muscle LL and roasted muscle TB and shear force of the studied groups are presented in Table 6. Both muscles obtained high results for flavour, juiciness, tenderness, and palatability (4.3–4.4 points on an average). These balanced results of the estimation were confirmed by statistical analysis, which showed no significant differences among the sensory properties of the muscles in the studied groups. Perhaps this positive evaluation of sensory meat traits was caused by supplement-ing the diet with vitamin E. It is known that this antioxidant influences the stability of oxidative fat, which is connected with taste and flavour (Migdał et al., 2008). Nuernberg et al. (2005) also
found no differences in the sensory evaluation of the grilled LL muscle coming from pigs fed a diet supplemented with linseed and olive oils. Calkins and Hodgen (2007) claim that about 50 substances contribute to creating meat flavour. Moreover, the authors think that aroma is created and developed not only during meat preparation, but also at the stage of animals’ feeding and meat treatment after slaughter (ripening conditions).
[image:8.595.65.534.498.685.2]Positive relationships have been known between intramuscular fat in meat and its juiciness, ten-derness, andpalatability. According to Wood et al. (1994), the 2–3% intramuscular fat content is the most favourable as concerns expected sensory traits of meat. Wood et al. (2004) showed a positive correlation between meat taste and the content of saturated and monounsaturatedfatty acids and a negative correlation in comparison to unsaturated fatty acids. Moreover, the optimal level of intra-muscular fat, pH, and also temperature during meat treatment affects its fragility (Moeller et al., 2010). In our study, measurements of the muscle shear force turned out to be rather differentiated but the differences between the groups were not confirmed statistically. The shear force of the cooked LL muscle was in the range of 86.8–103.8 N, while in the TB muscle it made 103.2–126.8 N. Also Jatu-rasitha et al. (2009) and Mas et al. (2011) reported similar shear force values of the meat in control
Table 5. Effect of oil diet inclusion on traits of raw triceps brachii muscle
Traits Diets1 SEM Significance
A B C D
pH24 5.75 5.82 5.72 5.67 0.18 ns
L*(lightness) 44.89 43.93 43.43 43.93 1.78 ns
a* (redness) 11.05 12.01 12.07 11.08 1.60 ns
b* (yellowness) 2.15 2.88 2.30 3.16 1.12 ns
Drip loss (%) 1.98 2.74 2.75 2.54 1.31 ns
Colour evaluation (score)2 2.16 2.52 2.18 2.24 0.53 ns
Roast loss (%) 33.78 37.55 32.63 34.38 4.18 ns
Marbling (score)3 3.62 3.27 3.30 3.61 0.23 ns
Moisture content (%) 75.3 74.2 75.6 75.49 0.90 ns
Fat content (%) 2.10 2.32 1.61 2.28 0.80 ns
Protein content (%) 21.5 22.4 21.64 21.11 0.95 ns
1diets: A = 2.5% rapeseed oil and 1% linseed oil, B = 1% rapeseed oil, 2% fish oil + 0.5% lard, C = 2.5% linseed oil and 1% fish
oil, D = 2.3% linseed oil, 1% rapeseed oil + 0.2% lard
2colour scale (1–5): 1 = pale pinkish gray to white, 5 = dark purplish red (NPPC, 1991)
3marbling scale (1–5): 1 = devoid to practically devoid, 5 = moderately abundant or greater (NPPC – Kaufman, 1992)
and experimental pigs fed a diet supplementedwith Greedy Grass OLIVA (soybeans and oleic acid).
Fatty acids composition (%) of backfat lipids
The content of fatty acids in the dorsal backfat of the studied nutrition groups was presented in Table 7. The level of the saturated fatty acids (SFA) in the backfat of tested fattenerswasroughly similar (35.7–37.9%) but the content ofmonounsaturated fatty acids (MUFA) differed among animals. The pigs of groups B and C had significantly (P < 0.01) more palmitoleic acid (C16:1) (1.74 and 1.56 g/100 g, respectively) and eicosenoic acid (C20:1) (1.7 and 1.44 g/100 g, respectively) compared to the remain-ing groups. However, the pigs of groups A and B had more oleic acid (C18:1) (37.47 and 36.94 g/100 g, respectively) in comparison to other animals. The significantly smaller total share of polyunsaturated fatty acids (PUFA), including PUFA n-3 was noted in group B (20.85 and 3.05 g/100 g, respectively). For this reason, the n-6 : n-3 ratio in this group was less profitable (5.57) in comparison to groups C and D (3.11 on the average). However, the values
of these coefficients are not high in comparison to the studies of other authors. Wajda et al. (2004) and Nuernberg et al. (2005) reported the PUFA n-6/n-3 ratio amounting to 7–10 in the backfat of pigs whose diet wassupplemented with olive oil, soya oil or flax seeds (APC-Premix). Based on our results it can be assumed that a profitable ratio of PUFA n-6/n-3 acids in the backfat of pigs ofgroups C and D resulted from the doubled supplement of the linseed oil in the diet compared to other animals. Barowicz and Kędzior (2000) mentioned that full-fat flax seeds are the richest source of α-linolenic acid (C18:3, n-3) attaining here to 52–58% of the total fatty acids. In the organism of mammals the α-linolenic acid is the precursor of the long-chained polyunsaturated fatty acids EPA and DHA, which are essential for the proper development and main-tenance of human health.
[image:9.595.73.531.100.330.2]The Polish Institute of Meat and Fat conducted an experiment in which two groups of pigs were for 60 days on diets supplemented with a prepa-ration from linseed oil (Leenlife E – 5 and 7.5% respectively). In the backfat of both groups the PUFA n-6/n-3 ratio amounted to 1.7, whereas in the control group it was 5.56 (Grześkowiak Table 6. Sensory traits of the longissimus lumborum (LL) and triceps brachii (TB) muscles (points)
Traits Diets1 SEM Significance
A B C D
Traits of cooked LL muscle
Flavour2 4.34 4.29 4.43 4.41 0.22 ns
Juiciness3 4.50 4.43 4.36 4.19 0.23 ns
Tenderness4 4.31 4.30 4.29 4.28 0.17 ns
Taste2 4.45 4.29 4.36 4.36 0.14 ns
Overall examination traits 4.40 4.33 4.36 4.31 0.18 ns
Shear force (N) 86.83 93.4 103.8 90.72 25.6 ns
Traits of roasted TB muscle
Flavour 4.53 4.57 4.53 4.41 0.19 ns
Juiciness 4.30 4.10 4.34 4.31 0.26 ns
Tenderness 4.5 4.37 4.32 4.32 0.18 ns
Taste 4.56 4.39 4.45 4.48 0.17 ns
Overall examination traits 4.47 4.36 4.41 4.38 0.20 ns
Shear force (N) 103.27 126.8 109.8 107.47 32.08 ns
1diets: A = 2.5% rapeseed oil and 1% linseed oil, B = 1% rapeseed oil, 2% fish oil + 0.5% lard, C = 2.5% linseed oil and 1% fish oil,
D = 2.3% linseed oil, 1% rapeseed oil + 0.2% lard
2scale: 1 = very unacceptable, 5 = very acceptable 3scale: 1 = very dry, 5 = very juicy
4scale: 1 = very tough, 5 = very tender
Table 7. Fatty acids composition (g/100 g FAME) of backfat lipids
Fatty acid Diets
1
SEM Significance
A B C D
C10:0 0.1 0.1 0.1 0.1 0.00 ns
C12:0 0.1 0.1 0.1 0.1 0.00 ns
C14:0 1.0 1.12 1.05 1.02 0.06 ns
C15:0 0.1 0.1 0.1 0.1 0.00 ns
C16:0 20.41 21.60 20.69 20.71 0.91 ns
C16:1 1.39X 1.74Y 1.56Z 1.32X 0.12 **
C17:0 0.25 0.30 0.30 0.29 0.06 ns
C17:1 0.21 0.22 0.24 0.22 0.05 ns
C18:0 13.59 14.35 13.91 14.37 0.83 ns
C18:1 37.47x 36.94xy 35.64y 34.87y 1.35 *
C18:2 n-6 18.29 16.59 17.15 18.06 1.34 ns
C18:3 n-3 3.36X 2.00Y 4.81Z 5.52Q 0.33 **
C20:0 0.27 0.25 0.21 0.21 0.04 ns
C20:1 1.25X 1.7Y 1.44ZX 0.99Q 0.15 **
C20:2 n-6 0.99 0.85 0.81 0.81 0.11 ns
C20:3 n-6 0.1 0.1 0.1 0.1 0.00 ns
C20:4 n-6 0.19 0.17 0.14 0.14 0..04 ns
C20:5 n-3 EPA 0.12x 0.19y 0.17y 0.10x 0.03 *
C22:4 n-6 0.10 0.10 0.10 0.10 0.00 ns
C22:5 n-3 DPA 0.15X 0.41Y 0.34Y 0.16X 0.06 **
C22:6 n-3 DHA 0.12X 0.45Y 0.31Y 0.10X 0.04 **
ΣSFA2 35.75 37.9 36.39 36.87 0.38 ns
ΣMUFA3 40.32x 40.60x 38.87xy 37.41y 0.18 *
ΣPUFA4 23.32X 20.85Y 23.89X 25.04X 0.28 **
PUFA n-3 3.66Xx 3.05Xy 5.64Y 5.89Y 0.12 **
PUFA n-6 18.67 16.95 17.44 18.34 0.29 ns
OFA5 21.41 22.72 21.74 21.73 0.50 ns
UFA6 63.65x 61.45y 62.76xy 62.45y 0.55 ns
DFA7 77.24 75.80 76.67 76.82 0.56 ns
UFA/SFA 1.78 1.62 1.72 1.69 0.30 ns
PUFA n-6/PUFA n-3 5.11X 5.57Y 3.11Z 3.11Z **
1diets: A = 2.5% rapeseed oil and 1% linseed oil, B = 1% rapeseed oil, 2% fish oil + 0.5% lard, C = 2.5% linseed oil and 1% fish
oil, D = 2.3% linseed oil, 1% rapeseed oil + 0.2% lard
2all saturated fatty acids 3all monounsaturated fatty acids 4allpolyunsaturated fatty acids
5dietary fatty acids having undesirable hypercholesterolemic effect in humans (C14:0 + C16:0) 6ΣPUFA + MUFA
7dietary fatty acids having desirable neutral of hypocholesterolemic effect in humans (UFA + C18:0) X–Zdifferent letters within a row indicate significant differences P ≤ 0.01 (*P < 0.05)
x–zdifferent letters within a row indicate significant differences P ≤ 0.05 (**P < 0.01)
Table 8. Fatty acids composition (g/100 g FAME) of intramuscular fat in raw longissimus lumborum muscle
Fatty acid Diets
1
SEM Significance
A B C D
C10:0 0.1 0.1 0.1 0.1 0.0 ns
C12:0 0.1 0.1 0.1 0.1 0.0 ns
C14:0 1.09 1.22 1.1 1.19 0.10 ns
C16:0 22.9 23.89 22.96 23.62 0.98 ns
C16:1 2.39x 2.71y 2.34x 2.45xy 0.25
C17:0 0.2 0.2 0.2 0.19 0.0 ns
C17:1 0.17 0.2 0.19 0.17 0.04 ns
C18:0 13.19 14.01 13.75 14.32 0.92 ns
C18:1 39.87xy 41.01x 39.52y 40.22xy 2.24
C18:2 n-6 13.22 10.72 12.05 10.95 2.17 ns
C18:3 n-3 1.51X 0.90Y 2.04Z 2.17Z 0.24
C20:0 0.19 0.20 0.20 0.20 0.01 ns
C20:1 0.97xy 1.06x 1.04xy 0.9y 0.10
C20:2 n-6 0.49x 0.40y 0.44xy 0.40y 0.06
C20:3 n-6 0.27 0.22 0.26 0.20 0.07 ns
C20:4 n-6 1.75 1.16 1.32 1.15 0.51 ns
C20:5 n-3 EPA 0.30x 0.41xy 0.62y 0.32x 0.15
C22:4 n-6 0.22x 0.11y 0.11y 0.12y 0.04
C22:5 n-3 DPA 0.55 0.45 0.61 0.46 0.14 ns
C22:6 n-3 DHA 0.21x 0.51y 0.52y 0.19x 0.09
ΣSFA2 37.76 39.72 38.41 39.72 0.52 ns
UFA3 61.95 59.88 61.07 59.72 0.40 ns
ΣMUFA4 43.41 44.98 43.08 43.75 0.64 ns
ΣPUFA5 18.53 14.9 17.99 15.97 0.17 ns
PUFA n-3 2.57X 2.27X 3.8Y 3.15Y 0.15
PUFA n-6 15.47 12.22 13.75 12.42 1.18 ns
DFA6 75.14 73.89 74.82 74.04 1.30 ns
OFA7 23.99 25.11 24.06 24.81 0.59 ns
UFA/SFA 1.61 1.51 1.59 1.50 0.29 ns
PUFA n-6/PUFA n-3 6.01X 5.38Y 3.60Z 3.95Z
1diets: A = 2.5% rapeseed oil and 1% linseed oil, B = 1% rapeseed oil, 2% fish oil + 0.5% lard, C = 2.5% linseed oil and 1% fish
oil, D = 2.3% linseed oil, 1% rapeseed oil + 0.2% lard
2all saturated fatty acids 3ΣPUFA + MUFA
4all monounsaturated fatty acids 5all polyunsaturated fatty acids
6dietary fatty acids having desirable neutral of hypocholesterolemic effect in humans (UFA + C18:0) 7dietary fatty acids having undesirable hypercholesterolemic effect in humans (C14:0 + C16:0) X–Zdifferent letters within a row indicate significant differences (P ≤ 0.01)
x–zdifferent letters within a row indicate significant differences (P ≤ 0.05)
Table 9. Fatty acids composition (g/100 g FAME) of intramuscular fat in raw triceps brachii muscle
Fatty acid Diets1 SEM Significance
A B C D
C10:0 0.1 0.1 0.1 0.1 0.00 ns
C12:0 0.1 0.1 0.1 0.1 0.00 ns
C14:0 0.92 0.92 1.02 1.02 0.08 ns
C15:0 0.1 0.1 0.1 0.1 0.00 ns
C16:0 21.45 21.9 21.4 21.92 0.85 ns
C16:1 2.02 2.21 2.05 2.09 0.24 ns
C17:0 0.21 0.24 0.29 0.22 0.04 ns
C17:1 0.17 0.20 0.20 0.19 0.05 ns
C18:0 13.21 13.46 13.3 13.72 0.60 ns
C18:1 36.58 36.76 35.56 37.78 0.82 ns
C18:2 n-6 17.21 16.1 16.45 14.72 1.90 ns
C18:3 n-3 2.03X 1.14Y 2.77Z 3.16XZ 0.32
C20:0 0.15 0.12 0.10 0.11 0.04 ns
C20:1 0.86X 1.02Y 0.95XY 0.84X 0.07
C20:2 n-6 0.62x 0.51y 0.52y 0.55y 0.08
C20:3 n-6 0.32x 0.34x 0.27y 0.24y 0.05
C20:4 n-6 1.99x 1.97x 1.76xy 1.30y 0.35
C20:5 n-3 EPA 0.36X 0.72Yy 0.91Zz 0.36X 0.12
C22:4 n-6 0.26X 0.17Y 0.16Y 0.16Y 0.04
C22:5 n-3 DPA 0.59X 0.77Y 0.84Y 0.56Y 0.07
C22:6 n-3 DHA 0.24X 0.77Y 0.72Y 0.23X 0.11
ΣSFA2 36.19 36.94 36.36 37.25 0.40 ns
UFA3 63.28 62.71 63.10 62.2 0.35 ns
ΣMUFA4 39.65 40.20 38.67 40.9 0.29 ns
ΣPUFA5 23.64 22.51 24.42 21.3 0.34 ns
PUFA n-3 3.22X 3.41X 5.25Y 4.32Z 0.15
PUFA n-6 19.78x 18.59y 18.65y 16.42z 0.48
DFA6 76.49 76.17 76.4 75.92 0.47 ns
OFA7 22.37 22.82 22.37 22.94 0.48 ns
UFA/SFA 1.75 1.70 1.73 1.67 0.27 ns
PUFA n-6/PUFA n-3 6.12X 5.45X 3.57Y 3.81Y
1diets: A = 2.5% rapeseed oil and 1% linseed oil, B = 1% rapeseed oil, 2% fish oil + 0.5% lard, C = 2.5% linseed oil and 1% fish
oil, D = 2.3% linseed oil, 1% rapeseed oil + 0.2% lard
2all saturated fatty acids 3ΣPUFA + MUFA
4all monounsaturated acids 5all polyunsaturated fatty acids
6dietary fatty acids having desirable neutral of hypocholesterolemic effect in humans (UFA + C18:0) 7dietary fatty acids having undesirable hypercholesterolemic effect in humans (C14:0 + C16:0) X–Zdifferent letters within a row indicate significant differences (P ≤ 0.01)
x–zdifferent letters within a row indicate significant differences (P ≤ 0.05)
et al., 2008). Benz et al. (2011) used in the diet a 5% supplement of soybean oil in a period of 25 to 82 days of the pigs’ life. In the backfat of ani-mals, the total contentof PUFA acids increased from 17.2% (on day 26 of feeding) to 29.6% (on day 82). Koczanowski et al. (2004) determined the fatty acids contents in a variously thick backfat of Landrace × Polish Large White pigs with a body weight of 100 kg. The authors found out that with the increasing backfat thickness (from 12 to 16 mm), the participation of saturated fatty acids went up (from 37.7 to 40.4%), while the share of the polyunsaturated fatty acids decreased(from 16.1 to 12.9%). The authors showed that the backfat of gilts contained less saturated acids (by about 1.22%) and more polyunsaturated fatty acids (by about 1.59%) than the backfat of barrows.
Fatty acids composition (%) of intramuscular fat in the raw longissimus lumborum muscle
The level of fatty acids in the intramuscularfat of the raw LL muscle is shown in Table 8. There were no significant differences between the groups in the total content of saturated (SFA, 37.76–39.72 g/ 100 g), monounsaturated (MUFA, 43.08–44.98 g/ 100 g), and polyunsaturated(PUFA, 14.9–18.53 g/ 100 g) fattyacids. However,in groups C and D the PUFA n-6/n-3 ratios significantly lowered (3.60 and 3.95) in comparison with groups A and B (6.01 and 5.38), respectively. In our previous study in (Landrace × Large White) × (Hampshire × Du-roc) crossbreeds, when 5% and 7.5% of a linseed oil preparation was added to the feed for 60 days, the ratio of n6/n3 fatty acids in LL muscle was low and amounted to 2.8 and 2.47, respectively (Grześkowiak et al., 2008). In the study by Haak et al. (2008), in the longissimus thoracis muscle of pigs fed a diet supplementedwith flax seeds (linseed oil), fish oil, and also their mixtures, the ratio of PUFA n-6/n-3 fatty acids amounted to 5.23, 3.03, and 3.74, respectively. It should be noted that in the longissimus dorsi (LD) muscle of pigs from different breeds non-supplemented with fats, the ratio of PUFA n-6/n-3 fatty acids was higher and amounted to over 10 (Barowicz and Kędzior, 2000). According to experts of the International Society for the Study of Fatty Acids and Lipids, this ratio in the human diet should be lower than 4 and therefore it is recommended to increase the n-3 group fatty acids and to lower the n-6 group
fatty acids intake. Thus, in our study the feeding regimen of pigs from groups C and D fully met the mentioned standards. Significant differences in EPA and DHA concentration in different feeding schemes were observed. In the TB muscle of group B and group C, EPA concentration was respectively 2 and 3 times higher than in groups A and D. EPA level in the LL muscle was also higher in groups B and C reaching respectively 0.41 and 0.62 g/100 g whereas in groups A and D it was only 0.30 g/100 g. DHA level was also higher in groups B and C. In the LD muscle DHA concentration was more than twice higher than in other groups whereas in the TB muscle and fat it was over 3 times higher.
It could be assumed that the higher DHA and EPA concentrations in the muscles and fat by groups B and C might be caused by codfish liver oil added to the feed (group B – 20 g/kg, group C – 10 g/kg). This fact has been confirmed by a fatty acids pro-file found in the feed mixture. Guil-Guerrero et al. (2011) reported a relatively high EPA and DHA concentration in Atlantic codfish liver oil reaching 8.9 and 10.7 g/100 g, respectively.
Fatty acids composition (%) of intramuscular fat in the raw triceps brachii muscle
The compositionof fatty acids in the raw TB mus-cle is shown in Table 9. There were no significant differences between the groups in the range of the total content of fatty acids of the SFA, MUFA, and PUFA groups. However, a higher (by 5–6 g/100 g) content of PUFA was detected in the raw TB muscle than in the raw LL muscle (Table 8). The contents of PUFA n-3 fatty acids differed significantly between groups, but as concerns the raw LL muscle, a higher content of these acids was detected in all groups of pigs (by 0.65, 1.14, 1.45, and 1.17 g/100 g in group A, B, C, and D, respectively). Simultaneously, a higher content of PUFA n-6 acids was noted in the raw TB compared to the raw LL muscle (by 4.3, 6.37, 4.9, and 4.0 g/100 g in group A, B, C, and D, respectively). It indicates thatmodifying the profile of fatty acids in the meat of the studied groups seems to be more profitable in the TB than in the LL muscle.
CONCLUSION
ef-fect on the carcass value, physicochemical and sensory traits of meat. However, it was found that different kinds of supplemented fat had different effects on the content of the poly-unsaturated fatty acids in backfat and in the raw longissimus lumborum muscle. The lowest level of fatty acids characterized the group of pigs fed with supplements of rapeseed, fish oil, and lard. Better results were achieved among fatteners supplemented with linseed. The kind of supplemented fat affected the level of PUFA n-3 fatty acids, especially of the linolenic acid C18:3, which in consequence led to the differ-entiation between the ratio of n-6 and n-3 acids in backfat. The n-6/n-3 ratio in pigs consuming a larger share of linseed (groups C and D) was better (about 3) than in pigs which obtained a larger portion of rapeseed and fish oils (about 5.5). The higher DHA and EPA concentration in muscles and fat in groups B and C might be caused by codfish liver oil added to the feed.
REFERENCES
Barowicz T., Kędzior W. (2000): The use of full-fat flax seeds and various vitamin E doses for modifying the chemical composition and dietetic value of pork. ZeszytyNaukowe PrzegląduHodowlanego, 48, 161–174. (in Polish) Benz J.M., Tokach M.D., Dritz S.S., Nelssen J.L., DeRouchey
J.M., Sulabo R.C., Goodband R.D. (2011): Effects of choice white grease and soybean oil on growth performance, carcass characteristics and carcass fat quality of growing-finishing pigs. Journal of Animal Science, 89, 404–413. Boler D.D., Gabriel S.R., Yang H., Balsbaugh R., Mahan
D.C., Brewer M.S., McKeith F.K., Killefer J. (2009): Effect of different dietary levels of natural-source vitamin E in grow-finish pigs on pork quality and shelf life. Meat Sci-ence, 83, 723–730.
Branscheid W., Dempfle L., Dobrowolski A., Sack E., Hoereth R. (1990): Die Handelsklassen fuer Schweine-halften. Neue Wege der apparativen Klassifizierung. Fleischwirtschaft, 70, 1428–1436.
Calkins C.R., Hodgen J.M. (2007): A fresh look at meat flavour. Meat Science, 77, 63–80.
Casa G., Della F., Bochicchio D., Faeti V., Marchetto G., Poletti E., Rossi A., Panciroli A., Mordenti A.L., Brogna N. (2010): Performance and fat quality of heavy pigs fed maize differing in linolenic acid content. Meat Science, 84, 152–158.
Degussa G. (1999): Standardized Ileal Digestibility of Amino Acids in Pigs. Frankfurt am Main, Germany.
Fischer K. (2001): Fleischfehler muessen nicht sein. Bedin-gungen zur Produktion von Fleisch guter sensorischer und technologischer Qualität. Fleischwirtschaft,10, 21–24. Grześkowiak E., Zając T., Borzuta K., Zając P., Tratwal
Z., Lisiak D., Strzelecki J. (2008): Investigations on the effect of the addition to feed of a preparation of oil flax on slaughter value carcass meat and fatt quality. Annals of Meat and Fat Research Institute, 46, 7–20. (in Polish) Guil-Guerrero J.-L., Venegas-Venegas E., Rincon-Cervera
M.A., Suarez M.D. (2011): Fatty acids profiles of livers from selected marine fish species. Journal of Food Com-position and Analysis, 24, 217–222.
Haak L., De Smet S., Fremaut D., van Walleghem K., Raes K. (2008): Fatty acid profile and oxidative stability of pork as influenced by duration and time of dietary linseed or fish oil supplementation. Journal of Animal Science, 86, 1418–1425. Homsi B.L.A., Francisco P.L. (2003): Water holding capacity
(WHC) and subjective color assessment of different pre-classified swine carcass cuts according to the longissimus dorsi pH. Proc. 49th Internat. Congress of Meat Science
and Technology, Sao Paulo, Brazil, 223–224.
Honikel K.O. (1997): Reference methods supported by OECD and their use in Mediterranean meat products. Food Chemistry, 59, 573–582.
ISO 5509 (1996): Animal and vegetable fats and oils – Preparation of methyl esters of fatty acids.
ISO 8586-1 (1996): Sensory analysis. General guidance for selection, training and monitoring of assessors. Part 1: Selected assessors.
ISO 5496 (1997): Sensory analysis. Methodology – Initiation and training of assessors in the detection and recogni-tion of odours.
ISO 3972 (1998): Sensory analysis. Methodology – Method of investigating sensitivity of taste.
ISO 4121 (1998): Sensory analysis. Methodology – Evalua-tion of food products by methods using scales.
ISO 3100 (1999): Meat and meat products. Sampling and preparation of test samples.
ISO 1442 (2000): Meat and meat products. Determination of water content.
ISO 1444 (2000): Meat and meat products. Determination of free fat content.
ISO 2917 (2001): Meat and meat products. Measurement of pH – Reference method.
Jaturasitha S., Khiaosaard R., Pongpiachan P., Krauzer M. (2009): Early deposition of n-3 fatty acids from tuna oil in lean and adipose tissue of fattening pigs is mainly per-manent. Journal of Animal Science, 87, 693–703. Kauffman R.G., Cassens R.G., Scherer A., Meeker D.L.
Kauffman R.G., Sybesma W., Smulders F.J.M., Eikelenboom G., Engel B., van Laack R.L.J.M., Hoving Bolink A.H., Ster-renburg P., Nordheim E.V., Walstra P., van der Wal P.G. (1993): The effectiveness of examining early post-mortem musculature to predict ultimate pork quality. Meat Science, 34, 283–300.
Koćwin-Podsiadła M., Zybert A., Sieczkowska H., Krzęcio E., Antosik K., Włodawiec P. (2004): Muscling and carcass composition in fatteners obtained from F0 generation im-ported from Denmark. Animal Science Papers and Reports, 22 (Suppl. 3), 147–151. (in Polish)
Koczanowski J., Migdał W., Orzechowska B. (2004): The effect of rate of fatness and sex of fatteners on fatty acid compo-sition of backfat. Animal Science Papers and Reports, 22 (Suppl. 3), 89–92. (in Polish)
Lauridsen C., Mu H., Henckel P. (2005): Influence of dietary conjugated linoleic acid (CLA) and age at slaughtering on performance, slaughter- and meat quality, lipoproteins, and tissue deposition of CLA in barrows. Meat Science, 69, 393–399.
Leksanich C.O., Matthews K.R., Warkup C.C., Noble R.C., Hazzledine M. (1997): The effect of dietary oil containing (n-3) fatty acids on the fatty acid, physicochemical and organoleptic characteristics of pig meat and fat. Journal of Animal Science, 75, 673.
Makała H., Kern-Jędrychowski J. (2006): Role of fish oil, em-ployed in model meat products in aspect of improvement of fatty acid profile and run of oxidative changes. Annals of Meat and Fat Research, 44, 117–129. (in Polish)
Mas G., Llavall M., Coll D., Roca R., Diaz I., Oliver M.A., Gispert M.E., Realini C.E. (2011): Effect of an elevated mono- unsaturated fat diet on pork carcass and meat quality traits and tissue fatty acid composition from York-crossed barrows and gilts. Meat Science, 89, 419–425.
Migdał W., Pieszka M., Barowicz T., Janik A., Wojtysiak D., Pustkowiak H., Nowak J., Kozioł A. (2008): Pros and against for modification of fatty acids profile in animal tissues. Annals of Meat and Fat Research,46, 111–123. (in Polish) Mitsumoto M., Faustman C., Cassens R.G., Arnold R.N.,
Schaefer D.M., Scheller K.K. (1991): Vitamines E and C improve pigment and lipid stability in ground beef. Journal of Animal Science, 56, 194.
Moeller S.J., Miller R.K., Edwards K.K., Zerby H.N., Logan K.E., Aldredge T.L., Stahl C.A., Boggess M., Box
Steffens-meier J.M. (2010): Consumer perceptions of pork eating quality as effected by pork quality attributes and point cooked temperature. Meat Science, 84, 14–22.
Mucha A., Różycki M. (2004): Backfat thickness in pigs as re-lated to lower or higher meat content of carcass. Animal Sci-ence Papers and Reports, 22 (Suppl. 3), 175–182. (in Polish) NPPC (1991): Procedures to Evaluate Market Hogs. National
Pork Producers Council, Washington, USA.
NPPC (1999): Official Colour and Marbling Standards. Na-tional Pork Producers Council, Washington, USA. Nuernberg K., Fischer K., Nuernberg G., Kuechenmeister U.,
Kłosowska D., Elmanowska-Wenda G., Fiedler I., Ender K. (2005): Effect of dietary olive and linseed oil on lipid com-position, meat quality, sensory characteristics and muscle structure in pigs. Meat Science, 70, 63–74.
Polish Standard Method PN-75/A-04018 (2002): Agricultural-food products. Determination of nitrogen using Kiejdahl’s method and conversion into albumen. (in Polish)
Ptasznik S., Jerzewska M. (2005): Physical and chemical proper-ties of selected mixtures of rapeseed oil and pork lard. Annals of Meat and Fat Research Institute, 42/43, 255–262. (in Polish) Sabbioni A., Superchi P., Sussi C., Bonomi A. (2002): Effect
of Duroc genes proportion on growth performance and on carcass and meat quality characteristics in heavy pigs. Italian Journal of Animal Science, 1, 17–24.
Wajda S., Daszkiewicz T., Borzuta K., Grześkowiak E. (2004): Carcass traits, meat quality and fatty acid profile of backfat in fatteners fed diet supplemented with the APC premix. Animals Science Papers and Reports, 22 (Suppl. 3), 211–217. (in Polish) Wood J.D., Wiseman J., Cole D.J.A. (1994): Control and ma-nipulation of meat quality. In: Cole D.J.A., Wiseman J., Varley M.A. (eds): Principles of Pig Science. Nottingham University Press, Nottingham, UK, 433–456.
Wood J.D., Richardson R.I., Nute G.R., Fisher A.V., Campo M.M., Kasapidou E., Sheard P.R., Enser M. (2004): Effect of fatty acids on meat quality: a review. Meat Science, 66, 21–32. Wood J.D., Enser M., Fisher A.V., Nute G.R., Sheard P.R.,
Richardson R.I., Hughes S.I., Whittington F.M. (2008): Fat deposition, fatty acid composition and meat quality: a re-view. Meat Science, 78, 343–358.
Received: 2012–11–30 Accepted after corrections: 2013–06–17
Corresponding Author
Dr. Dariusz Lisiak, Institute of Agricultural and Food Biotechnology, Department of Meat and Fat Technology, Głogowska 239, 61-111 Poznań, Poland