Supported by the State Key Laboratory of Animal Nutrition of China (Project No. 2004DA125184F1209), by the National Natural Science Foundation of China (Project No. 31372329), by the Innovation Scientists and Technicians Troop Construction Projects of Zhengzhou City (Project No. 121PCXTD516), and by the Zhengzhou City Feed and Nutritional Key Lab (Project No.111PYFZX153).
Effects of the replacement of corn oil with linseed
oil on fatty acid composition and the expression
of lipogenic genes in broiler chickens
W. Chen
1, R. Zhao
1,3, B.X. Yan
1, J.S. Zhang
1, Y.Q. Huang
1, Z.X. Wang
1, Y.M. Guo
21College of Animal Science and Veterinary Medicine, Henan Agricultural University, Zhengzhou,
P.R. China
2State Key Laboratory of Animal Nutrition, China Agricultural University, Beijing, P.R. China 3Henan Province Xinxiang City Livestock Husbandry and Veterinary Management Bureau,
Xinxiang, P.R. China
ABSTRACT:The effect of dietary 18:2n-6/18:3n-3 ratio (by the replacement of corn oil with linseed oil) on n-3 polyunsaturated fatty acids (PUFA) enrichment in breast muscle of broiler chickens and the expression of lipogenic genes were investigated. Broiler chickens were fed ad libitum with diets containing 5% corn oil (CO), 3.75% corn oil + 1.25% linseed oil (CL1), 2.5% corn oil + 2.5% linseed oil (CL2), and 5% linseed oil (LO) based on the basic diets, respectively. Dietary 18:2n-6/18:3n-3 ratio did not affect 42-day body weight and 0–42-day feed conversion efficiency (feed/gain, P >0.05) of broiler chickens, however, 5% linseed oil significantly increased 0–21-day feed conversion efficiency (feed/gain, P < 0.05) and decreased breast muscle weight (by 16%, P < 0.05) of broiler chickens. With the decrease of dietary 18:2n-6/18:3n-3 ratio, the enrichment of total n-3 PUFA, 18:3n-3, 20:5n-3, and 22:5n-3 increased linearly (P <0.01), while the enrichment of total n-6 PUFA and 18:2n-6 decreased linearly (P <0.01) in breast muscle of broiler chickens. Dietary corn oil increased the enrichment proportion of 20:4n-6 in a dosage-independent manner. Replacing 1.5% corn oil with linseed oil increased the enrichment proportion of 22:6n-3 (P <0.05), but continuing to increase dietary linseed oil could not further elevate its deposition. Real-time quantitative RT-PCR was used todetermine the expression of the mRNA levels of related genes. Dietary PUFA had insignificant effect on the expressions of LPIN2, WD, and tetratricopeptide repeats 1 (WDTC1) and △-6 fatty acid desaturase (FADS2) in both breast muscle and abdominal fat. The effect of dietary PUFA on the expression of LPIN1 gene showed clear tissue dependence. Equivalent adding of corn oil and linseed oil could up-regulate the mRNA level of LPIN1 in abdominal fat (P < 0.01). This study demonstrated that decreasing dietary 18:2n-6/18:3n-3 ratio promoted the deposition of desirable n-3 long chain PUFA in the edible tissue and influenced the expression of LPIN1 in a tissue-dependent manner.
Keywords: birds; performance; essential fatty acid; gene expression
INTRODUCTION
Eicosapentaenoic acid (EPA, 20:5n-3) and doco-sahexaenoic acid (DHA, 22:6n-3) were found to be benefit for human health (Brenna et al. 2009). Recent literature provides clues that the ratio of
15 : 1. It was found that the human dietary imbal-ance between n-6 and n-3 PUFA has led to the development of an adverse cardiovascular and metabolic disease (Toshimitsu et al. 2007), and contributed to the pathogenesis of non-alcoholic fatty liver disease. Therefore, interest has turned to the intake of specific fatty acids, notably n-6 and n-3 PUFA and their ratios, rather than total fat intake (Leitzmann et al. 2004) in recent years.
Dietary fatty acids are absorbed by monogas-tric animals and deposited in their tissues, n-6 and n-3 PUFAs are competitively metabolized by the same pathway (Luo et al. 2009). So, there is a considerable potential for the manipulation of the fatty acid profiles of poultry tissue by dietary means, thus to increase the supply of n-3 PUFA (especially EPA and DHA), and to regulate n-6/n-3 PUFA ratio to a level which is suitable for human consumption. It seems that both the type and the ratio of dietary oils affect the deposition of fatty acid in most animals (including chickens). So it is interesting to explore ways for increasing the conversion efficiency from alpha-linolenic acid (ALA, 18:3n-3) to EPA and DHA, and seeking suitable n-6/n-3 PUFA ratio in chickens.
Apart from being an important macronutrient, dietary fat has recently gained much prominence for its role in regulating gene expression in poultry (Royan et al. 2011; Zhang et al. 2011; Jing et al. 2013). LPIN1, LPIN2, WDTC1/ADIPOSE, and △-6 fatty acid desaturase (FADS2) were reported as lipid metabolism genes in human and mouse. LPIN1 and
LPIN2 were the members of Lipin protein family, one novel family of Mg2+-dependent phosphatidic acid phosphatases with bifunctional proteins that dephosphorylate phosphatidic acid to produce diacylglycerol and act in the nucleus to regulate gene expression in human and mouse (Reue and Zhang 2008). WDTC1 is an evolutionarily con-served gene isolated from naturally occurring obese
Drosophila homozygous for an adipose mutation, the homologous gene in mouse appears to inhibit the fat formation in a dosage-sensitive manner (Hader et al. 2003; Suh et al. 2007). FADS2 gene is one member of the fatty acid desaturase gene family, a component of lipid metabolic pathway that converts human essential fatty acids including linoleic acid (LNA, 18:2n-6) and ALA (18:3n-3) into long chain (LC)-PUFA among species. It was reported that n-3 PUFA could reduce the FADS2
expression in muscle of bull (Herdmann et al. 2010). The homologous genes for LPIN1 (Wang et
al. 2012), LPIN2, WDTC1/ADIPOSE (Chen et al. 2010), and FADS2 in chickens have been reported by our lab recently.
Corn oil is enriched with LNA (18:2n-6), while linseed oil is enriched with ALA (18:3n-3). Till now, a certain amount of reports on the effects of diet rich in n-3 PUFA, especially 18:3 ALA (by the replacement of corn oil with linseed oil), on the enrichment of fatty acid in broiler chickens have been found, studies about its effects on the expres-sion of lipid related genes have been focused on human and mice while few data have been found on broilers. Our objective was to evaluate the effects of dietary corn oil replaced by linseed oil (with different ratio of 18:2n-6/18:3n-3 PUFA) on the growth performances, carcass traits, fatty acid profiles, and gene expressions of LPIN1, LPIN2,
WDTC1, and FADS2 in chickens. The study should help reveal the mechanism of fatty acid deposition in poultry meat by diets.
MATERIAL AND METHODS
Birds, housing, and experimental design. The
240 female Cobb-500 broiler chickens at 1 day of age (body weight (BW) = 46 ± 4 g) were randomly allotted into four treatments (CO, CL1, CL2, and LO) with six replicates. The birds were raised in 24 cages (10 individuals per cage) under 24-hour light, standard temperature (33–35°C the first week, then decreasing by 2–3°C per week), humidity, and ventilation. Feed and water were provided ad libitum. The diets were formulated according to the broilers’ requirements recommended by the NRC (1994) criteria (Table 1). CO, CL1, CL2, and LO diets contained 5% corn oil, 3.75% corn oil + 1.25% linseed oil, 2.5% corn oil + 2.5% linseed oil, and 5% linseed oil, respectively (Table 1). The BW of each broiler chicken and food consumption (per cage broilers) were recorded weekly. The fatty acid compositions of finisher diets were analyzed and listed in Table 2. The fatty acid composition of corn and linseed oil is presented in Table 3. The study was carried out according to the Henan Agricultural University Animal Care and Use Com-mittee Guidelines.
Measurements and sampling. At day 42, 12
weighed. About 50 g breast muscle of each chicken was stored at −20°C for fatty acid analysis. About 10 g breast muscle (pectoralis major) and abdomi-nal fat tissues were snap-frozen in liquid nitrogen and transferred to –80°C for RNA extraction, respectively.
Fatty acid content. Lipids were extracted from
the diet (3 g) and breast muscle (20 g) samples using chloroform/methanol (1 : 1 vol/vol) by a modified method of Folch et al. (1957). Fatty acid methyl esters were prepared for gas chromatography de-termination using KOH/methanol (Luo et al. 2009).
The 6890N-5973 gas chromatograph-mass spec-trometer (Agilent Technologies Inc., Wilmington, USA) equipped with a quadrupole mass spectrom-eter detector, a hydrogen flame ionization detector, and a quartz capillary chromatographic column HP-5MS (30 m × 0.25 mm × 0.25 μm) was used in this experiment. The injector and quadrupole mass spectrometer detector were kept at 250°C and 150°C, respectively. Nitrogen was used as car-rier gas with a flow rate of 1.0 ml/min, split ratio was 1 : 10. The column was programmed as fol-lows: 60°C for 3 min, increase to 260°C (4°C/min), and held constant for 50 min. The fatty acids were identified by comparing the area of the peaks with those of known standards (Sigma Chemical Co., St. Louis, USA).
RNA isolation and cDNA synthesis. Total RNAs
were extracted from pectoralis major and abdominal fat tissues of broiler chickens by using RNAisoTM Plus (TaKaRa Biotechnology, Dalian, China). Total RNA concentration and purity were determined using a NanoVueTM Plus spectrophotometer (GE Healthcare, Freiburg, Germany). The 2 μg total RNA was used to synthesize the cDNA using random hexamer prim-ers with PrimeScript® RT reagent kit with gDNA
Eraser (TaKaRa) according to the manufacturer’s instructions. The synthesized first strand cDNA was stored at –20°C for use.
Real-time quantitative RT-PCR (qRT-PCR).
[image:3.595.63.289.115.540.2]Taqman qRT-PCR was used to determine the expression of LPIN1 (GenBank accession No. HM473175), LPIN2 (GenBank accession No. JN012098), WDTC1 (GenBank accession No. XM_417728), and FADS2 (GenBank accession No. EF636888.3). The 18S rRNA (GenBank acces-sion No. FM164514.1), β-actin(ACTB, GenBank accession No. L08165), and GAPDH (GenBank accession No. NM_204305.1) were used as the internal controls. Primer sequences are listed in Table 4. The primers/probes for qRT-PCR were Table 1. Ingredients and nutrient levels of the
experimen-tal diets (air-dry basis)
Ingredients/composition Starter1 (%) Finisher (%) Ingredients
Corn 52.30 57.44
Soybean meal (CP 48%) 35.41 30.30
Corn gluten meal (CP 60%) – 0.5
Variable oil2 5 5
Fish meal 3 3
Dicalcium phosphate 1.55 1.26
Limestone 1.26 1.20
Salt 0.35 0.35
dl-Methionine (98%) 0.14 0.05
l-Lysine-HCl (78%) 0.03 –
Choline chloride (60%) 0.26 0.20
Vitamin premix3 0.20 0.20
Trace mineral premix4 0.50 0.50
Total 100 100
Composition5
ME (MJ/kg) 12.61 13.03
CP 21.5 20.0
Crude fat 7.65 7.77
Lysine 1.15 1.05
Met + Cys 0.90 0.72
Ca 1.00 0.92
Available P 0.45 0.40
Analytical composition (%)
CP 21.40 19.88
Crude fat 7.60 7.71
Met + Cys 0.88 0.73
Ca 0.98 0.90
Available P 0.44 0.41
ME = metabolizable energy, CP = crude protein, Met = methionine, Cys = cystine
1starter diets, provided during weeks 0–3; finisher diets,
provided during weeks 4–6
25% variable oil, for CO, CL1, CL2, and LO treatments was
5% corn oil, 3.75% corn oil + 1.25% linseed oil, 2.5% corn oil + 2.5% linseed oil, and 5% linseed oil, respectively
3provided per kg of diet: vitamin A 1500 IU, vitamin D 3 200 IU, vitamin E 10 mg, vitamin K3 0.5 mg, thiamin 1.8 mg, riboflavin 3.6 mg, vitamin B6 3.5 mg, vitamin B12 25 μg, niacin 35 mg, folic acid 0.55 mg, biotin 0.2 mg, pantothenic acid 10 mg
4provided per kg of diet: 40 mg Zn (as ZnSO
optimized according to the reference Gangisetty and Reddy (2009). The standard curve for each gene was constructed with purified PCR products generated using the specific primers of objective genes and reference genes. Purified PCR products were quantified using NanoVueTM Plus spectropho-tometer (GE Healthcare) and serially diluted tenfold to span the range of predicted Ct values that would be obtained from experimental samples. The qRT-PCR was performed using the 7500 Real-Time qRT-PCR System (Applied Biosystems, Foster City, USA), in a total volume of 25 μl with 1 µl cDNA, 12.5 μl TaqMan Universal PCR Master mix (TaKaRa), 260nM of each specific forward and reverse primer, and 250nM TaqManTM fluorescent probe. Each sample (including no template control) had three replications. For the unstable expression of 18S
rRNA, ACTB, and GAPDH genes among treatments, finally, we normalized gene expression based upon the constant amount of RNA and cDNA amplified. This method has been proposed to be the most reli-able standardization of quantitative measurement of mRNA expression (Bustin 2002; Lkhagvadorj et al. 2010). For each gene, the relative mRNA level = average copy number for each treatment/the copy number for the treatment with the lowest average value among treatments (including breast muscle and abdominal fat tissues). The mRNA level for the treatment with the lowest average value was normalized to 1.
Statistical analysis. Data was analyzed using
[image:4.595.66.531.100.444.2]the SAS software (Statistical Analysis System, Version 8.0, 2000). General linear model I was used to analyze carcass traits including breast Table 2. Fatty acid composition (each fatty acid/total fatty acid; %) in finisher diets (measured value)1
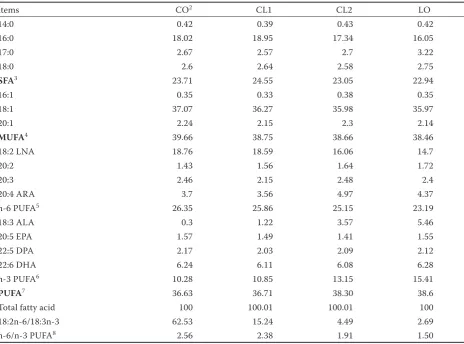
Items CO2 CL1 CL2 LO
14:0 0.42 0.39 0.43 0.42
16:0 18.02 18.95 17.34 16.05
17:0 2.67 2.57 2.7 3.22
18:0 2.6 2.64 2.58 2.75
SFA3 23.71 24.55 23.05 22.94
16:1 0.35 0.33 0.38 0.35
18:1 37.07 36.27 35.98 35.97
20:1 2.24 2.15 2.3 2.14
MUFA4 39.66 38.75 38.66 38.46
18:2 LNA 18.76 18.59 16.06 14.7
20:2 1.43 1.56 1.64 1.72
20:3 2.46 2.15 2.48 2.4
20:4 ARA 3.7 3.56 4.97 4.37
n-6 PUFA5 26.35 25.86 25.15 23.19
18:3 ALA 0.3 1.22 3.57 5.46
20:5 EPA 1.57 1.49 1.41 1.55
22:5 DPA 2.17 2.03 2.09 2.12
22:6 DHA 6.24 6.11 6.08 6.28
n-3 PUFA6 10.28 10.85 13.15 15.41
PUFA7 36.63 36.71 38.30 38.6
Total fatty acid 100 100.01 100.01 100
18:2n-6/18:3n-3 62.53 15.24 4.49 2.69
n-6/n-3 PUFA8 2.56 2.38 1.91 1.50
1considering the oil was added to the diets in the same pattern in starter and finisher diets, here only the fatty acid compo-sitions of finisher diets were presented
2CO = 5% corn oil group, CL1 = 3.75% corn oil + 1.25% linseed oil group, CL2 = 2.5% corn oil + 2.5% linseed oil group, LO = 5% linseed oil group; n = 6
muscle weight, leg muscle weight, heart weight, liver weight, and abdominal fat weight, where BW at day 42 was taken as a covariate to analyze the effect of dietary lipids on these carcass traits. Other data was analyzed by the general linear model II. The LSD method was used for multiple comparisons among the four groups. P ≤ 0.05 was considered significant.
Model I :
yi= µ + Gi+ b(Wi – —W)ei
Model II:
yi= µ + Gi+ ei
where:
yi = observation value of the traits μ = population mean
Gi = treatment effect (i = 1, 4)
b = regression coefficient for body weight
Wi = individual body weight —
W = average body weight
ei = random error
RESULTS
Fatty acid composition of diets. The fatty acid
compositions of the finisher experiment diets are shown in Table 2. The n-3 PUFA (especially for ALA, 18:3n-3) content was obviously differ-Table 3. Sequences of primers and probes
Gene Sequences of primer and probe Product length (bp)
LPIN1 (HM473175)
F: 5'GAGATGGATAACAATCAGGAG3'
140 R: 5'GAAGATACACTGCTGTCCAG3'
Probe: 5'CTGTCTACGTCCCCCATCCTGTCT3'
LPIN2 (JN012098)
F: 5'CCGGAATCAACCAAGATAAGC3'
105 R: 5'ATCAGAGCTGAGGATGACTC3'
Probe: 5'CTGGAACATCCCAGAACAGCTACC3'
WDTC1 (XM_417728)
F: 5'GGAGACTTGTTGGCCTCTG3'
131 R: 5'GAATGCGGCAAGAACTTGAC3'
Probe: 5'CCATTGTCTGGGATCCTCTGCACC3'
FADS2 (EF636888.3)
F: 5'ATTGGACACCTTAAGGGTGC3'
104 R: 5'AGCATGTTCACATCTGGGTC3'
Probe: 5'CCATCGTCACTTCCAACATCACGC3'
18S rRNA (FM165414.1)
F: 5'GATCCATTGGAGGGCAAGTC3'
113 R: 5'CAGCTCGATCCCAAGATCC3'
Probe: 5'CAGCAGCCGCGGTAATTCCAGC3'
ACTB (L08165)
F: 5'AGAGAGAAGATGACACAGATC3'
117 R: 5'GTCCATCACAATACCAGTGG3'
Probe: 5'CCTTCAACACCCCAGCCATGTATG3'
GAPDH (NM_204305.1)
F: 5'TTGTCAGCAATGCATCGTGC3'
108 R: 5'TGATGGCATGGACAGTGGTC3'
[image:5.595.65.535.102.413.2]Probe: 5'CCACCAACTGCCTGGCACCCTT3'
Table 4. Fatty acid composition of corn oil and linseed oil1
Items C14:0 C16:0 C18:0 C18:1 C18:2LNA C18:3ALA C20:4ARA C20:5EPA C22:6DHA n-6/n-3 PUFA2
Linseed oil 6.4 4.5 21.0 17.4 50.6 0.1 0.35
Corn oil 12.2 2.2 27.5 57.0 0.9 63.33
1fatty acid composition of corn oil and linseed oil wasdetermined by gas chromatography of fatty acid methyl esters ac-cording to GB/T 17377-1998
[image:5.595.62.534.670.714.2]ent among the four treatments. The replacement of corn oil with linseed oil increased n-3 PUFA (especially for ALA, 18:3n-3) content while de-creased n-6 PUFA (especially for LNA, 18:2n-6), 18:2n-6/18:3n-3 ratio, and n-6/n-3 PUFA ratio in diets. ALA (18:3n-3) levels in CL1, CL2, and LO treatments were 4.06, 11.9, and 18.3 times of those in CO treatment, respectively. LNA (18:2n-6) levels in CL1, CL2, and LO treatments were 99, 85.6, and 78.4% of those in CO group, respectively. Dietary 18:2n-6/18:3n-3 ratios were 62.53, 15.24, 4.49, and 2.69, while dietary n-6/n-3 PUFA ratios were 2.56, 2.38, 1.91, and 1.50 in CO, CL1, CL2, and LO groups, respectively (Table 2).
Effects of dietary corn oil replaced by linseed
oil on performance of broiler chickens. The
ef-fects of the replacement of dietary corn oil with linseed oil on growth traits of broiler chickens are shown in Table 5. The replacement of the dietary corn oil with linseed oil did not significantly affect 42-day body weight, 21–42-day and 0–42-day feed conversion (feed/gain, P >0.05) of broiler chickens, but significantly affected 0–21-day feed conversion (feed/gain, P <0.05) and weakly affected
0–21-day body gain (P < 0.1). The feed efficiency (feed/ gain) and the body gain of CL1 and CL2 broilers in 0–21 days were significantly higher than those of LO broilers (P <0.05) (Table 5). The effects of the replacement of dietary corn oil with linseed oil on carcass traits of broiler chickens are shown in Table 6. The replacement of dietary corn oil with linseed oil did not significantly affect the traits including heart weight, liver weight, leg muscle weight, and abdominal fat weight (P >0.05). How-ever, the breast muscle weight of LO broilers was by about 16% lower than that of animals in the other groups (P < 0.05) (Table 6).
Effects of the replacement of corn oil by linseed oil on fatty acid composition of breast muscle.
[image:6.595.64.533.102.188.2]Fatty acid compositions of total fat in breast muscle of broiler chickens are presented in Table 7. Corn oil replaced by linseed oil had no significant ef-fect on the deposition of total saturated fatty acid (SFA) content in breast muscle. However, the 14:0 content in birds of CO group was significantly higher than that of animals in the other groups (P <0.01), the 18:0 content in LO group was the most abundant (P <0.05). The 16:0 was the major Table 5. Effects of dietary oil lipids on growth traits of broiler chickens
Items CO1 CL1 CL2 LO RMSE P-value
42-day body weight (kg) 2.32 2.31 2.31 2.25 0.12 0.786
0–21-day body gain (g) 585ab 636a 616a 556b 48 0.073
0–21-day feed/gain (g/g) 1.42ab 1.35b 1.39b 1.46a 0.05 0.019
21–42-day feed/gain (g/g) 1.80 1.83 1.81 1.77 0.08 0.657
0–42-day feed/gain (g/g) 1.70 1.70 1.70 1.69 0.06 0.991
RMSE = root mean-square error
1CO = 5% corn oil group, CL1 = 3.75% corn oil + 1.25% linseed oil group, CL2 = 2.5% corn oil + 2.5% linseed oil group,
LO = 5% linseed oil group; n = 30
[image:6.595.65.533.598.698.2]a,bwithin the same row, means with different letter represent P ≤ 0.05, means with the same letter or no letter represent P > 0.05
Table 6. Effects of dietary oil lipids on carcass traits of broiler chickens
Group CO1 CL1 CL2 LO RMSE P-value
Body weight (kg) 2.33 2.30 2.38 2.25 0.11 0.502
Breast muscle weight (g) 455a 458a 442a 388b 37 0.034
Leg muscle weight (g) 303 300 336 315 30 0.200
Heart weight (g) 7.8 8.2 8.8 9.2 1.2 0.272
Liver weight (g) 42.8 40.5 41.6 42.9 3.8 0.682
Abdominal fat weight (g) 29.1 34.2 38.5 34.9 8.1 0.279
RMSE = root mean-square error
1CO = 5% corn oil group, CL1 = 3.75% corn oil + 1.25% linseed oil group, CL2 = 2.5% corn oil + 2.5% linseed oil group, LO = 5% linseed oil group; n = 6
SFA in breast muscle as that in diets, its proportion in breast muscle was not significantly changed by dietary fatty acid.
The replacement of dietary corn oil with linseed oil unchanged total monounsaturated fatty acid (MUFA) enrichment in breast muscle of broiler chickens. However, 20:1 proportion of CO group was lower than that of CL1 group (P <0.05) in breast muscle, the differences among CL1, CL2, and LO groups were not significant (Table 7).
The replacement of corn oil with linseed oil had no significant effect on the total PUFA proportion, but it significantly changed the proportion of n-6 PUFA (P <0.01), n-3 PUFA (P <0.01), 18:2n-6/ 18:3n-3 ratio (P <0.01), and n-6/n-3 PUFA ratio (P <0.01) in breast muscles of broiler chickens.
[image:7.595.65.533.323.664.2]These items presented significant differences among the four treatments (Table 7). With the decrease of dietary 18:2n-6/18:3n-3 ratio by the replacement of corn oil with linseed oil, the en-richment of n-3 PUFA in breast muscle linearly increased (P <0.01). Comparing with CO group, n-3 PUFA contents in breast muscle of CL1, CL2, and LO broilers were elevated by 50.1, 81.0, and 123.8%, respectively (Table 7). On the contrary, the content of n-6 PUFA (P <0.01), 18:2n-6/18:3n-3 ratio (P <0.01), and n-6/n-3 ratio (P < 0.01) in breast muscle of corresponding treatments linearly decreased (Table 7). The 18:2n-6/18:3n-3 ratios of CO, CL1, and CL2 groups were 32.84, 5.54, and 2.27 times of those in LO group, respectively. The n-6/n-3 PUFA ratios of CO, CL1, and CL2 groups
Table 7. Fatty acid composition (each fatty acid/total fatty acid; %) of breast muscle
Items CO1 CL1 CL2 LO RMSE P-value
14:0 0.32a 0.24b 0.22b 0.24b 0.04 0.007
16:0 16.34 13.76 15.01 15.56 0.72 0.108
17:0 3.01 2.48 2.87 2.54 0.41 0.141
18:0 6.61b 6.22b 6.45b 7.02a 0.41 0.026
SFA2 26.29 22.70 24.55 25.35 0.86 0.168
16:1 2.32 1.93 2.02 2.11 0.25 0.195
18:1 25.60 26.05 25.92 26.62 1.86 0.890
20:1 1.41b 1.81a 1.85a 1.89a 0.20 0.011
MUFA3 28.74 28.87 29.12 30.57 1.67 0.404
18:2 LNA 24.35a 22.30a 18.06b 14.98c 1.51 0.000*
20:2 1.60 1.86 1.69 1.42 0.22 0.061
20:3 1.71 2.01 1.97 1.73 0.23 0.238
20:4 ARA 7.05a 7.08a 6.28a 4.42b 0.91 0.003
n-6 PUFA4 35.23a 32.74b 27.99c 21.88d 1.46 < 0.001*
18:3 ALA 0.50d 2.72c 5.37b 10.06a 1.07 < 0.001*
20:5 EPA 1.39c 2.02b 2.40b 3.10a 0.30 < 0.001*
22:5 DPA 1.15b 1.25ab 1.32ab 1.43a 0.20 0.020*
22:6 DHA 6.60b 8.43a 8.49a 7.09ab 0.93 0.04
n-3 PUFA5 9.76d 14.65c 17.67b 21.84a 0.85 < 0.001*
PUFA6 43.04 43.48 45.67 40.60 5.38 0.676
Total Fatty Acid 99.97 100.03 100.02 100
18:2n-6/18:3n-3 48.61a 8.20b 3.37c 1.48c 2.28 < 0.01*
n-6 /n-3 PUFA7 3.62a 2.27b 1.58c 1.01d 0.25 < 0.001*
RMSE = root mean square error
1CO = 5% corn oil group, CL1 = 3.75% corn oil + 1.25% linseed oil group, CL2 = 2.5% corn oil + 2.5% linseed oil group, LO = 5% linseed oil group; n = 6
2Σ14:0 + 16:0 + 17:0 + 18:0; 3Σ16:1 + 18:1 + 20:1; 4Σ18:2 + 20:2 + 20:3 + 20:4; 5Σ18:3 + 20:5 + 22:5 + 22:6; 6Σn-3 PUFA + n-6 PUFA; 7n-6 PUFA/n-3 PUFA
were 3.58, 2.24, and 1.56 times of those in LO group, respectively (Table 7).
For n-6PUFA, LNA (18:2n-6) was the predomi-nant PUFA in diets. Its deposition was abundant in breast muscle of broiler chickens, too (Table 7). The enrichment proportion of LNA (18:2n-6, P < 0.01) in breast muscle of broiler chickens linearly decreased with the increase of dietary linseed oil (enriching 18:3n-3). The content of LNA (18:2n-6) and arachidonic acid (ARA, 20:4n-6) in breast muscle of the LO group was significantly lower than that of other groups, and the LNA (18:2n-6) content of CL2 group was significantly lower than that of CO and CL1 groups (Table 7).
For n-3 PUFA, the enrichment of ALA (18:3n-3) in breast muscle of broiler chickens was dramati-cally elevated (linearly, P <0.01) with the increase of dietary linseed oil (18:3n-3) content (Table 7). The enrichment of ALA (18:3n-3) in CL1, CL2, and LO groups was 5.44, 10.74, and 20.12 times of that in the CO group, respectively. The enrich-ment of EPA (20:5n-3, P <0.01) and DPA (22:5n-3,
P <0.05) in breast muscle of broiler chickens was
also linearly elevated with the increase of dietary linseed oil/18:3n-3 content, the contents of EPA (20:5n-3) and DPA in LO group were significantly higher than those in CO group (P < 0.05, Table 7). For the enrichment of DHA in breast muscle, the proportion of DHA in CO group was significantly lower than that in CL1 and CL2 groups, while there were not significant differences among other groups (Table 7).
Expression of lipid metabolism related genes in
breast muscle and abdominal fat.In this study, it
was found that the mRNA levels of three reference genes (18S rRNA, ACTB, and GAPDH) exhibited significant differences between breast muscle and abdominal fat, dietary oil significantly affected the expression of 18S rRNA, ACTB, and GAPDH (Ta-ble 8). So the expression values of objective genes were normalized based upon the constant amount of RNA and cDNA amplified. The relative mRNA levels of LPIN1, LPIN2, WDTC1, and FADS2 were presented in Table 8. The mRNA levels of LPIN1
[image:8.595.62.530.411.634.2](P <0.01), LPIN2 (P <0.01), and FADS2 (P <0.01) in abdominal fat of broiler chickens were markedly
Table 8. Effects of different dietary oil lipids on relative expression of genes in breast muscle and abdominal fat
Gene Tissue CO1 CL1 CL2 LO RMSE P-value Tissue2
(n = 24)
LPIN1 abdominal fatbreast muscle 2.261.00 ab 1.331.18 a 6.331.47 c 4.661.57 bc 0.621.83 0.4400.001 3.53*1.30
LPIN2 breast muscleabdominal fat 1.26 4.80 1.00 6.25 1.76 7.34 1.21 6.85 0.552.16 0.3060.233 6.31*1.27
WDTC13 breast muscle 2.19 1.76 2.96 2.59 0.98 0.275 2.33*
abdominal fat 1.00 1.25 1.27 1.13 0.32 0.517 1.77
FADS24 breast muscle 1.14 1.00 1.30 1.50 0.41 0.224 1.23
abdominal fat 3.64 4.16 4.39 4.69 1.94 0.850 4.22*
GAPDH breast muscleabdominal fat 260.731.45 ab 212.011.61 a 388.261.09 b 137.061.00 a 81.500.38 0.0020.053 235.767* 1.303
ACTB breast muscleabdominal fat 1.412.37 a 1.003.39 a 1.623.36 a 2.672.57 b 1.130.53 0.3560.000 2.946* 1.691
18S rRNA breast muscleabdominal fat 1.951.00ab 2.211.09ab 1.641.22a 2.881.41b 0.390.55 0.3990.015 2.232*1.176
RMSE = root mean square error
1CO = 5% corn oil group, CL1 = 3.75% corn oil + 1.25% linseed oil group, CL2 = 2.5% corn oil + 2.5% linseed oil group, LO = 5% linseed oil group; n = 6
2comparison between the mRNA level of breast muscle and abdominal fat 3WDTC1 = WD and tetratricopeptide repeats 1
4FADS2 = Δ-6 fatty acid desaturase
a–cwithin four groups, means with different letter represent P ≤ 0.05, with the same letter or no letter represent P > 0.05; for each
higher than those in breast muscle, which were about 3, 5, and 3 times of those in breast muscle, respectively; while WDTC1 had a higher expression level in breast muscle than that in abdominal fat (P <0.01). Dietary corn oil replaced with linseed oil had no significant effect on the expression of
LPIN2, WDTC1, and FADS2 in both breast muscle and abdominal fat of broiler chickens, while the expression of LPIN1 was significantly affected by dietary oil in abdominal fat (P <0.01). The LPIN1
mRNA level of the CL2 group in abdominal fat was the highest, being significantly higher than that in CO group (P <0.01) and CL1 group (P < 0.05), and LO group value was significantly higher than that of CL1 group (Table 8).
DISCUSSION
In this study, we confirmed that the change of dietary 18:2n-6/18:3n-3 PUFA did not affect 42-day body weight, 0–42-day feed conversion efficien-cy (feed/gain), leg muscle weight, abdominal fat weight of broiler chickens as reported in previous studies (Martin et al. 2007; Qi et al. 2010; Benat-mane et al. 2011). We observed that 5% linseed oil significantly decreased the breast muscle weight by about 16% (Table 6), it indicated that linseed oil as a single oil lipid provider in diets had nega-tive effect on the development of breast muscle in broiler chickens, which might be related with that chickens of LO group had low body gain in the early growth stage (0–21 days, Table 5). This result was inconsistent with some reports that feeding a linseed diet had no significant effect on breast muscle weight (Martin et al. 2007; Qi et al. 2010). The inconsistence might be due to the differences among the trial designs of those researches. The relatively higher breast muscle weight in CO, CL1, and CL2 treatments may be related with that the diets containing corn oil were more beneficial to the breast muscle development of broiler chickens, or that the antinutritional factors in linseed oil had some negative effects on the breast muscle development of broilers (Bond et al. 1997). It was reported by Brue and Latshaw (1985) that daily heat production was lesser when corn oil was fed to broiler chickens.
The MUFA and SFA have double origins, directly from the diet and by de novo synthesis, while PUFA can only have a dietary origin (Villaverde et al. 2006; Ferrini et al. 2010). Our research indicated that varying the ratio of 18:2n-6/18:3n-3 in diets
had a weak effect on 16 : 1 and 18 : 1 concentrations in tissues as observed by Qi et al. (2010). We found that increasing dietary 18:3n-3 in a low-dosage manner (replacing 1.5% dietary corn oil with lin-seed oil) could increase the deposition of 20 : 1 in breast muscle; however, further adding linseed oil in diets did not change 20 : 1 proportion in breast muscle of broiler chickens, which reflected that the deposition of 20 : 1 appeared to be tightly regulated by feedback inhibition of n-3 PUFA.
Our study confirmed that the fatty acid composi-tions of total n-3 PUFA (including ALA, 18:3n-3) and n-6 PUFA (including LNA, 18:2n-6) in poultry meat were affected by the dietary fat source in a dosage-dependence manner as Qi et al. (2010) reported. It may be related with that a competition existed between the n-3 and n-6 fatty acid families for metabolism with an excess of one causing a significant decrease in the conversion of the other (Schmitz and Ecker 2008).
Individuals eating diets containing large amounts of linoleic acid will deposit this component readily in the tissue and complex lipids where it will be elongated and desaturated to ARA. In this study, the ARA (20:4n-6) levels of treatments contain-ing corn oil with different proportions (CO, CL1, and CL2, enriching with LNA) were higher than that of LO group in breast muscle, but the ARA (20:4n-6) levels were similar among CO, CL1, and CL2 groups, which suggested that dietary LNA (18:2n-3) could increase ARA deposition in meat in a dosage-independent manner. LO group had the lowest ARA (20:4n-6), which also reflected that high amounts of ALA (18:3n-3) could decrease the conversion of LNA (18:2n-6) to ARA (20:4n-6) (Coetzee and Hoffman 2003; He et al. 2009).
DHA is synthesized from DPA. In this study (Ta-ble 7), we observed that decreasing dietary 18:2n-6/ 18:3n-3 ratio (from 48.6 to 8.2) increased the en-richment proportion of DHA (22:6n-3), but further decreasing 18:2n-6/18:3n-3 ratio in diets could not increase the enrichment of DHA (22:6n-3). It indicated that DHA synthesis appeared to be tightly regulated by feedback inhibition as observed by Leitzmann et al. (2004). This also reflects that ALA conversion is severely constrained for DHA. It has been reported that increasing the availabil-ity of dietary ALA (18:3n-3) did not obligatorily enhance DHA synthesis and even might decrease tissue DHA concentrations (Leitzmann et al. 2004). This study showed that CL2 chickens had relatively high LC-PUFA content (especially DHA; Table 7) and breast muscle weight (Table 6). It seems that feeding diets containing equivalent corn oil and linseed oil would be a good choice for producing broiler chickens enriching with LC-PUFA.
PUFA including n-3 PUFA or its derivatives can directly act at the level of nucleus to influence the transcription activity of transcription factors and in turn the transcription of their target genes responding to diverse cellular processes including adipogenesis (Sampath and Ntambi 2005; Luo et al. 2009). So the expression levels of the genes involved in lipogenic metabolism were assessed in our study. We observed that increasing dietary n-3 PUFA increased the expression of chicken LPIN1
in abdominal fat, but further increasing n-3PUFA in diet could not up-regulate the mRNA level of chicken LPIN1. It indicated that the expression of chicken LPIN1 appeared to be tightly regulated by feedback inhibition in a tissue-specific manner. We also noticed that the mRNA level of LPIN1
in abdominal fat of CL2 chickens was the highest among treatments, suggesting a co-regulation of enriching n-3PUFA diet with genes involved in LC-PUFA and cholesterol synthesis.
Several studies indicated the expressions of
LPIN1, LPIN2, FADS2, and WDTC1 were under the regulation of fatty acids in other species. Lai et al. (2008)found that the effectofhuman WDTC1
variation on obesity had a strong interaction with MUFA intake. Martin et al. (2007) studied the expression of LPIN1, LPIN2, and FADS2 in the same population. They found that comparing with a saturated fatty acid diet, LPIN1 transcrip-tion in liver was negatively regulated by PUFA containing diets in wild-type mice whereas not in PPARα-/-mice, FADS2 was negatively regulated
by PUFA containing diets in both wild-type mice and PPARα-/-mice, while LPIN2 was negatively regulated by several types of PUFA diets. FADS2
was considered the rate-limiting enzyme in the formation of LC-PUFAs and could promote the conversion of ALA (18:3) to EPA (20:5) (Innis 2003; Nakamura and Nara 2004; Park et al. 2009; Glaser et al. 2010). Theil and Lauridsen (2007)found that the expression of hepatic FADS2 gene in porcine was influenced by the n-6 to n-3 PUFA ratio. In this study, we failed to detect the change of chicken LPIN2,
FADS2, and WDTC1, which may be related with that the expression changes of these genes induced by diet PUFAs may be tissue/genotype-specific, or oil type/dosage-dependent. More works need to be done for unveiling the molecular mechanism about the deposition of fatty acid.
CONCLUSION
Dietary 18:2n-6/18:3n-3 ratio did not affect the growth performances of broilers in 0–42 days. The deposition of desirable n-3 LC-PUFA, 18:2n-6/ 18:3n-3, and n-6/n-3 PUFA ratios in breast muscle were more favourable with a lower ratio of dietary 18:2n-6/18:3n-3, while comparing with LO diet, increasing the 18:2n-6/18:3n-3 ratio significantly increased the breast muscle weight of broilers. Our research helps offer a valid way to meet the demand of producer and consumer for meat that is nutritionally beneficial. The significant change of the expression of LPIN1 implied that LPIN1 may be involved in the regulation of PUFA content. A better study of LPIN1 would help understanding the mechanism underlying the deposition of PUFA in poultry meat.
REFERENCES
Benatmane F., Kouba M., Youyou A., Mourot J. (2011): Ef-fect of a linseed diet on lipogenesis, fatty acid composi-tion and stearoyl-CoA-desaturase in rabbits. Animal, 5, 1993–2000.
Bond J., Julian R., Squires E. (1997): Effect of dietary flax-seed on broiler growth, erythrocyte deformability, and fatty acid composition of erythrocyte membranes. Ca-nadian Journal of Animal Science, 77, 279–286. Brenna J.T., Salem Jr. N., Sinclair A.J., Cunnane S.C. (2009):
Brue R.N., Latshaw J.D. (1985): Energy utilization by the broiler chicken as affected by various fats and fat levels. Poultry Science, 64, 2119–2130.
Bustin S. (2002): Quantification of mRNA using real-time reverse transcription PCR (RT-PCR): trends and prob-lems. Journal of Molecular Endocrinology, 29, 23–29. Chen W., Guo Y.M., Huang Y.Q., Shi Y.H., Zhang C.X.,
Wang J.W. (2010): Effect of energy restriction on growth, slaughter performance, serum biochemical parameters and LPIN2/WDTC1 mRNA expression of broilers in the later phase. The Journal of Poultry Science, 49, 12–19. Coetzee G., Hoffman L. (2003): Effects of various dietary
n-3/n-6 fatty acid ratios on the performance and body composition of broilers. South African Journal of Animal Science, 32, 175–184.
Ferrini G., Manzanilla E.G., Menoyo D., Esteve-Garcia E., Baucells M.D., Barroeta A.C. (2010): Effects of dietary n-3 fatty acids in fat metabolism and thyroid hormone levels when compared to dietary saturated fatty acids in chickens. Livestock Science, 131, 287–291.
Folch J., Lees M., Sloane-Stanley G. (1957): A simple method for the isolation and purification of total lipids from animal tissues. Journal of Biological Chemistry, 226, 497–509.
Gangisetty O., Reddy D.S. (2009): The optimization of TaqMan real-time RT-PCR assay for transcriptional pro-filing of GABA-A receptor subunit plasticity. Journal of Neuroscience Methods, 181, 58–66.
Glaser C., Heinrich J., Koletzko B. (2010): Role of FADS1
and FADS2 polymorphisms in polyunsaturated fatty acid metabolism. Metabolism, 59, 993–999.
Hader T., Muller S., Aguilera M., Eulenberg K.G., Steuer-nagel A., Ciossek T., Kuhnlein R.P., Lemaire L., Fritsch R., Dohrmann C., Vetter I.R., Jackle H., Doane W.W., Bronner G. (2003): Control of triglyceride storage by a WD40/TPR-domain protein. EMBO Reports, 4, 511–516. Haug A., Eich-Greatorex S., Bernhoft A., Wold J.P., Hetland
H., Christophersen O.A., Sogn T. (2007): Effect of dietary selenium and omega-3 fatty acids on muscle composition and quality in broilers. Lipids in Health and Disease, 6, 1–9. He X.P., Xu X.W., Zhao S.H., Fan B., Yu M., Zhu M.J., Li
C.C., Peng Z.Z., Liu B. (2009): Investigation of LPIN1 as a candidate gene for fat deposition in pigs. Molecular Biology Reports, 36, 1175–1180.
Herdmann A., Nuernberg K., Martin J.,, Nuernberg G., Doran O. (2010): Effect of dietary fatty acids on expres-sion of lipogenic enzymes and fatty acid profile in tissues of bulls. Animal, 4, 755–762.
Indu M. (1992): n-3 fatty acids in Indian diets – compari-son of the effects of precursor (alpha-linolenic acid) vs product (long chain n-3 poly unsaturated fatty acids). Nutrition Research, 12, 569–582.
Innis S.M. (2003): Perinatal biochemistry and physiology of long-chain polyunsaturated fatty acids. The Journal of Pediatrics, 143, 1–8.
Jing M., Gakhar N., Gibson R.A., House J.D. (2013): Di-etary and ontogenic regulation of fatty acid desaturase and elongase expression in broiler chickens. Prostaglan-dins, Leukotrienes and Essential Fatty Acids (PLEFA), 89, 107–113.
Kim S.C., Adesogan A.T., Badinga L., Staples C.R. (2007): Effects of dietary n-6:n-3 fatty acid ratio on feed intake, digestibility, and fatty acid profiles of the ruminal con-tents, liver, and muscle of growing lambs. Journal of Animal Science, 85, 706–716.
Lai C.Q., Parnell L.D., Arnett D.K., Garcia-Bailo B., Tsai M.Y., Kabagambe E.K., Straka R.J., Province M.A., An P., Borecki I.B. (2008): WDTC1, the ortholog of Drosophila
adipose gene, associates with human obesity, modulated by MUFA intake. Obesity, 17, 593–600.
Leitzmann M.F., Stampfer M.J., Michaud D.S., Augustsson K., Colditz G.C., Willett W.C., Giovannucci E.L. (2004): Dietary intake of n-3 and n-6 fatty acids and the risk of prostate cancer. The American Journal of Clinical Nutri-tion, 80, 204–216.
Lkhagvadorj S., Qu L., Cai W.G., Couture O.P., Barb C.R., Hausman G.J., Nettleton D., Anderson L.L., Dekkers J.C.M., Tuggle C.K. (2010): Gene expression profiling of the short-term adaptive response to acute caloric restric-tion in liver and adipose tissues of pigs differing in feed efficiency. American Journal of Physiology – Regulatory, Integrative and Comparative Physiology, 298, R494–R507. Lopez-Ferrer S., Baucells M., Barroeta A., Grashorn M.
(1999): Influence of vegetable oil sources on quality pa-rameters of broiler meat. Archiv für Geflügelkunde, 63, 29–35.
Luo H.F., Wei H.K., Huang F.R., Zhou Z., Jiang S.W., Peng J. (2009): The effect of linseed on intramuscular fat content and adipogenesis related genes in skeletal muscle of pigs. Lipids, 44, 999–1010.
Martin P.G., Guillou H., Lasserre F., Dejean S., Lan A., Pas-cussi J.M., SanCristobal M., Legrand P., Besse P., Pineau T. (2007): Novel aspects of PPARα-mediated regulation of lipid and xenobiotic metabolism revealed through a nutrigenomic study. Hepatology, 45, 767–777.
Nakamura M.T., Nara T.Y. (2004): Structure, function, and dietary regulation of Δ6, Δ5, and Δ9 desaturases. Nutri-tion, 24, 345–376.
NCR (1994): Nutrient Requirements of Poultry. 9th Ed. The National Academies Press, Washington, USA.
Park W.J., Kothapalli K.S., Lawrence P., Tyburczy C., Brenna J.T. (2009): An alternate pathway to long-chain polyunsat-urates: the FADS2 gene product Δ8-desaturates 20: 2n-6 and 20: 3n-3. Journal of Lipid Research, 50, 1195–1202. Ponte P.I.P., Prates J.A.M., Crespo J.P., Crespo D.G., Mourao
J.L., Alves S.P., Bessa R.J.B., Chaveiro-Soares M.A., Fer-reira L.M.A., Fontes C.M.G.A. (2008): Improving the lipid nutritive value of poultry meat through the incorporation of a dehydrated leguminous-based forage in the diet for broiler chicks. Poultry Science, 87, 1587–1594.
Qi K.K., Chen J.L., Zhao G.P., Zheng M.Q., Wen J. (2010): Effect of dietary omega6/omega3 on growth performance, carcass traits, meat quality and fatty acid profiles of Bei- jing-you chicken. Journal of Animal Physiology and Ani-mal Nutrition, 94, 474–485.
Reue K., Zhang P. (2008): The lipin protein family: dual roles in lipid biosynthesis and gene expression. FEBS Letters, 582, 90–96.
Royan M., Meng G.Y., Othman F., Sazili A.Q., Navidshad B. (2011): Effects of conjugated linoleic acid, fish oil and soybean oil on PPARs (alpha & gamma) mRNA expres-sion in broiler chickens and their relation to body fat deposits. International Journal of Molecular Sciences, 12, 8581–8595.
Sampath H., Ntambi J.M. (2005): Polyunsaturated fatty acid regulation of genes of lipid metabolism. Annual Review of Nutrition, 25, 317–340.
Schmitz G., Ecker J. (2008): The opposing effects of n-3 and n-6 fatty acids. Progress in Lipid Research, 47, 147–155. Suh J.M., Zeve D., McKay R., Seo J., Salo Z., Li R., Wang M., Graff J.M. (2007): Adipose is a conserved dosage-sensitive antiobesity gene. Cell Metabolism, 6, 195–207.
Theil P.K., Lauridsen C. (2007): Interactions between di-etary fatty acids and hepatic gene expression in livers of pigs during the weaning period. Livestock Science, 108, 26–29.
Toshimitsu K., Matsuura B., Ohkubo I., Niiya T., Furukawa S., Hiasa Y., Kawamura M., Ebihara K., Onji M. (2007): Dietary habits and nutrient intake in non-alcoholic stea-tohepatitis. Nutrition, 23, 46–52.
Villaverde C., Baucells M.D., Cortinas L., Barroeta A.C. (2006): Effects of dietary concentration and degree of polyunsaturation of dietary fat on endogenous synthesis and deposition of fatty acids in chickens. British Poultry Science, 47, 173–179.
Wang X.K., Chen W., Huang Y.Q., Kang X.T, Wang J.P., Li G.X., Jiang R.R. (2012): Identification of the tran-script isoforms and expression characteristics for chicken
LPIN1. Animal, 6, 1897–1903.
Zhang B., Yang X., Guo Y., Long F. (2011): Effects of dietary lipids and Clostridium butyricum on serum lipids and lipid-related gene expression in broiler chickens. Animal, 5, 1909–1915.
Received: 2013–04–25 Accepted after corrections: 2014–03–03
Corresponding Author
Prof. YuMing Guo, Ph.D., China Agricultural University, College of Animal Science and Technology, Beijing, 100193, P.R. China