An Experimental and Numerical Study on the Modelling of Fluid Flow,
Heat Transfer and Solidification in a Copper Continuous Strip Casting Process
Jafar Mahmoudi
1;*, Michael Vynnycky
2, Patrik Sivesson
3and Hasse Fredriksson
11
Department of Materials Processing, Royal Institute of Technology, Stockholm, Sweden
2Faxe´n Laboratory, Royal Institute of Technology, Stockholm, Sweden 3Outokumpu Copper, R&D, Va¨steraas, Sweden
An experimental and numerical study was carried out to investigate the solidification process in a copper continuous strip casting process. Heat flow and solidification process has been experimentally studied. Cooling curves during solidification were registered using a thermocouple of type ‘‘K’’ connected to a data acquisition system. Temperature measurements in the mould and cooling water were also performed. The numerical model considers a generalized set of mass, momentum and heat equations that is valid for the solid, liquid and solidification interval in the cast. Ak"turbulence model, produced with the commercial program CFX, is used to analyse the solidification process of pure copper in the mould region of the caster. The fluid flow, temperature and heat flux distributions in the mould region of the caster were computed. The shape and location of the solidification front were also determined. The effects of the parameters such as heat transfer coefficient, casting speed, casting temperature, heat of fusion and specific heat on the shape and location of the solidification front and the heat transport at the mould-cast interface were investigated. The predicted temperature and heat flux distributions were compared with experimental measurements, and reasonable agreement was obtained.
(Received February 27, 2003; Accepted July 17, 2003)
Keywords: continuous strip casting, copper, solidification, heat transfer, fluid flow, numerical simulation, modelling
1. Introduction
In recent years, there has been increased interest in producing strips by continuous casting. During a continuous casting process, the superheated liquid metal is poured into the mould, which has an internal passage through which the cooling water is circulated. In the mould region, superheat and heat of fusion are removed from the liquid metal; heat is also removed from solid shell. Below the mould, in the secondary cooling zone, cooling water is jetted directly onto the casting surface.
In the continuous strip casting industry, knowledge of the locations of liquidus and solidus temperatures, the temper-ature of any point within the casting, the local cooling rate, the temperature gradient, etc. is of great importance. With this information the casting engineer can draw conclusions concerning the likelihood of the formation of defects, porosity, cracks, microsegregations and the microstructures. It will also be possible to adjust the design of the caster, cooling channels,etc.
In order to understand the movement of the solidification front during continuous casting, the study of the temperature fields in the solid and liquid regions is necessary. Theoretical prediction of the solidification front and the temperature field in strip is of the greatest practical importance. Over the past years, various numerical techniques have been applied for the computation of solidification problems during the solid-ification of metal casting.1–5)
The heat transfer during solidification in continuous casting processes strongly influences the product quality and the process productivity. Factors influencing heat trans-fer in the mould have been investigated experimentally by many authors.6–10) It is obvious that mould heat transfer
consists of many complex mechanisms, including conduc-tion, convection and phase change. In the liquid region of the strand, heat is transferred by conduction and convection. In the solid region heat transfer is due to both conduction and the solid body translation of the solidified strip. Heat flow to the mould is controlled by the nature of the gap that forms between the strand and the mould as solid shell forms. Moreover accurate measurement of the mould boundary conditions is difficult experimentally.
Mathematical models of continuous casting have been useful for describing heat transfer during solidification and in determining design variables. Among the available literature for solving the temperature field problem during continuous casting, a common approach is to employ a formulation based on the governing equation for enthalpy, with a source-based method being used to incorporate the release of latent heat.11–15) Reviews and examples can be found else-where.16–18)
The probability of formation of lattice defects such as vacancies during a casting process were studied earlier.19–21) It has been observed that the structure and properties of rapidly solidified alloys are influenced by the cooling rate during solidification. A supersaturation of vacancies can also form in a metal by quenching, mechanical deformation or energetic particle irradiation. These vacancies can migrate and collide to form microscopic clusters at temperatures where the vacancies are mobile. It has earlier been proposed22–24) that during a solidification process a large number of lattice defects such as vacancies are formed and then condensed. The thermodynamic properties of metals are changed by the lattice defects. The concentration of vacan-cies in the solid depends on the cooling conditions. When the alloy is rapidly quenched from a high temperature, there will be insufficient time for the new equilibrium concentration to be established and a high concentration of vacancies will be trapped. The increase in the concentration of vacancies will
*Present address: Outokumpu Copper, R&D, Va¨steraas, Sweden, [email protected]
have an influence on the solidification process.
The focus of this study is the development of a coupled flow model to quantitatively describe the strip casting process which is used in casting copper base alloys. Experiments have been made to study the heat flow and the solidification process in the strip caster. Results from these measurements have been used in numerical simulation for heat flow and solidification. The model is used to study the solidification behaviour under various operating conditions and with different casting velocities. The simulation results give important information for caster design optimisation. The results obtained can also be used for the prediction of the behaviour and characteristics of the cast material.
2. Model Description
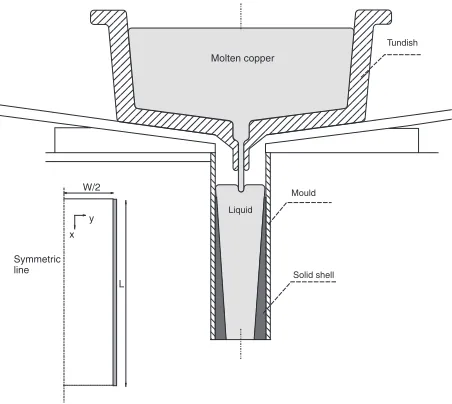
A schematic diagram of the mould is shown in Fig. 1; data relating to the geometry and operating conditions are given in Tables 1–3. Introducing Cartesian (x;y) coordinates, x¼0
marks the top of the mould, with the liney¼0as the mould’s axis of symmetry and the mould wall at y¼W=2. Super-heated liquid, at a uniform temperature Tcast>Tmelt, enters
the mould with a uniform feed velocity at x¼0,
0ydjet=2, and solid metal is withdrawn atx¼L. Under
steady operating conditions, the inlet melt velocity through the nozzle is related to the casting speed, as shown later.
The flow of molten copper from the tundish to the mould is affected by the nozzle diameter and the head of liquid copper in the tundish. The models were used to determine the effect of varying casting speeds on the solidification behaviour. The heat flux value at the top surface of the mould in the liquid region, presented in Table 2 and used as a cooling boundary condition, was obtained from the experimental data, and those reported earlier.25–28)
In the mould region, the molten material is cooled indirectly, e.g., by circulating cooling water through the channels in the mould walls. After the mould, the strip is further cooled in the caster by water sprays, the purpose of this being to provide continued and controlled cooling of the
strip. After this, the strip is cooled by air. The process has been described in detail elsewhere.25,26)
During continuous casting processes, thermal energy is transported by convection in the liquid pool. This convection is driven by the kinetic energy of the pouring stream as it enters the continuous casting mould. Complete modelling of this convective transport requires that the fluid-flow problem in the liquid region is solved concurrently with the heat flow in the solid.
3. Experimental Work
The heat extraction rate at the strip/mould interface is a critical input to the mathematical model used for the prediction of transport process during the solidification in
Solid shell
Tundish Molten copper
Liquid Mould
L W/2
y x
Symmetric line
Fig. 1 Schematic view of the mould, tundish and computational domain of the strip caster.
Table 1 Geometry data. Parameter Value [m]
djet 0.0052
L 0.39
[image:2.595.305.549.170.343.2]W 0.027
Table 3 Empirical constants used for numerical computations. Parameter Value
C 0.09
C1 1.44
C2 1.92
H 0.9
k 1.0
" 1.3
Dl 6:0105
A 106
cP1 0.002
cP2 0.3
a1 1953:1
a2 816.4
a3 394.8
b1 2087:6
b2 884.2
b3 113.8
Table 2 Physical data for copper. Parameter Unit Value
kgm1s1 0.007
l kgm3 8000
s kgm3 8900
Ks Wm1K1 334
Kl Wm1K1 165
Kmould Wm1K1 160
Cs
P Jkg1K1 485
Cl
P Jkg1K1 495
Uc ms1 0.010–0.0183 Hf Jkg1 205000
Qtop Wm2 1000
Tcast K 1397
[image:2.595.305.549.378.587.2] [image:2.595.56.282.556.758.2]the mould. Such data are important to develop realistic model, with a large predictive capability. The aims of the experimental measurements performed in this project were to obtain the data about the heat flux (or heat transfer coefficient) at the mould surface. The measurements pro-vided a quantitative understanding of the heat flow phenom-enon in the strip caster.
Experiments have been made at Outokumpu Copper R&D Va¨steraas, Sweden, to study the heat flow during the solid-ification process for pure copper. Strips are cast in a vertical oscillating mould. The temperature in the tundish was measured at the beginning of each experiment. An inconel-sheathed thermocouple of type ‘‘K’’ with a diameter of 1.5 mm was inserted in three different positions of the liquid pool width and allowed to follow the solidifying strip downwards in the caster. A number of experiments were performed for different tundish nozzle jets.
In order to investigate the heat flow through the mould wall during the solidification process, the temperature in the graphite mould wall was measured using nine thermocouples placed 2 mm from the mould surface, and compared with three additional measurements obtained from three thermo-couples placed 4 mm from the mould surface. Temperature measurements in the outlet cooling water were also per-formed. Measurements were made on both sides of the mould.
The thermocouples were connected to a data acquisition system that allowed the collection of temperature-time data with an interval of 10 milliseconds. The data were plotted as a cooling curve.
The amount of cooling water and average heat released through the mould was also measured during the experi-ments.
4. Modelling Considerations and Model Formulation
The molten copper is poured continuously into mould through a nozzle. The liquid velocity at the inlet was assumed to be constant and was calculated based on an inlet-outlet mass balance. Although the actual process is highly three-dimensional, we consider here a two-dimensional model, principally for the sake of computational cost. It has earlier27) been explained that, the fluid flow in the upper part of the liquid pool of the mould region is turbulent and that this dampened further down the caster. In the present study, the
k" turbulence model was employed to account for turbulence in the liquid region and during the solidification interval. The problem was assumed to be at steady state during solidification. An incompressible Newtonian fluid was also assumed and turbulence effects on the casting param-eters were studied.
Recent mathematical models of continuous casting proc-esses have centred on steel alloys, in which a mushy zone of sizable extent is an important part both of the solidification process and modelling considerations. For pure copper, however, these considerations are to a large extent absent. From a modelling perspective, possible choices are either to use and modify ideas already employed for steel, or to implement a model for distinct phase transfer; although suggestions for a route to the latter do exist in the literature,
we develop the former (e.g.[4]). The governing equations then are:
a) Continuity equation
r ð ~UUÞ ¼0; ð1Þ
whereis the mixture density andUU~is the average mixture velocity, which are given, respectively, by
¼ 1
fs
s þfl
l
;
~
U
U¼fsUU~sþflUU~l
where fl and fs are liquid and solid mass fractions,
respectively, with flþfs¼1 andUU~l andUU~s are the liquid
and solid velocities respectively.
b) Momentum equation
r ð ~UUUU~Þ ¼ rþ r ðeffrUU~Þ þ
l
Kp
ðUU~UU~cÞ þSS~U;
ð2Þ
where efffð¼lþTÞ includes the liquid molecular and
turbulent viscosities (l,T respectively).
In general terms, the fluid flow during solidification interval is modelled as a porous medium wherein the Darcy’s law can be applied. According to Darcy’s law, the phase interaction forces are proportional to the superficial liquid velocity relative to the velocity of the solid, as indicated in (2). The anisotropic permeability, KP, was calculated using
the Carman-Kozeny equation for permeability of porous media as
KP¼
f3
l
Dlð1flÞ2
:
In this expression,fl is the mass liquid fraction, which can
vary between 0 and 1, andDldepends on the morphology of
the porous media; we return to this later.
c) Conservation of energy
The energy transport equation can be written as follows:
r ð ~UUHÞ ¼ r ðeffrHÞ þSH; ð3Þ
where
eff¼
K
CP
þT
H
;
andHis the turbulent Prandtl number for enthalpy with.
Here, the mixture enthalpy,H, is given byH¼RTT refCPdT,
relative to a reference temperatureTref.
The source term,SH, in eq. (3), which embodies the latent
heat of fusion,Hf, can be derived to be
SH¼Hfr ðfsUU~sÞ: ð4Þ
fl
0 if T<Tmelt;
1 if TTmelt:
Here, however, we use the linear relation
fl
0 if TTsol;
TTsol
TliqTsol
if TsolT Tliq;
1 if TTliq; 8
> > < > > :
whereTsolandTliqcan be thought of as artificial solidus and
liquidus temperatures, respectively; these are taken so that
TliqTmelt¼TmeltTsol; in view of the earlier discussion,
the situation for copper is approached as (TliqTmelt) is
made smaller and smaller.
The accurate modelling of this process requires a validated description of the boundary conditions, which tend for continuous casting to be empirical in form. The required boundary conditions used for the solution are:
u¼ujet;v¼0;k¼cp1u2jet; "¼
ðcp1Þ3=2u3jet
cp2D
;
at x¼0;0ydjet=2;
whereujet¼WUc=djet, according to mass conservation, and
u¼@v
@x¼
@k
@x¼
@"
@x¼0; at x¼0;djet=2<yW=2;ð5Þ
wherecp1andcp2are empirical constants whose values given
in Table 3, andDis the hydraulic diameter,D¼4Ajet=Pjet,
wherePjetis the perimeter of the jet.
For eq. (3) we take, atx¼0,
T ¼Tcast; at x¼0;0ydjet=2; ð6Þ
and
Kl
@T
@x ¼Qtop; at x¼0;djet=2<yW=2; ð7Þ
where Tcast and Qtop denote the molten metal pouring
temperature and an assumed pool surface heat flux, respec-tively. For the outlet wherex¼L, we take zero conductive heat flux:
@T
@x ¼0: ð8Þ
For the symmetry plane aty¼0:
@u
@y¼
@k
@y¼
@" @y¼
@H
@y ¼v¼0; ð9Þ
and finally, for the mould wall,y¼W=2;
K@T
@y ¼hðTToÞ: ð10Þ
Hereh is the heat transfer coefficient between the mould surface and the solid shell, andTo is the temperature of the
mould. It has earlier28) been shown and discussed that the heat transfer coefficient is not constant and varies as a function of mould depth. In view of the experimental results (Section 6.1), the temperature calculation was carried out with assumed profiles forhandTo given by:
To¼a1y2þa2yþa3; ð11Þ
h¼b1y2þb2yþb3; ð12Þ
where a1, a2, a3, b1, b2 and b3 are empirical constants,
presented in Table 3, obtained from experimental data. The predicted curves were obtained via best curve fitting to the measured data points. This will be discussed in detail later.
5. Numerical Solution
A 2-d schematic of the computational domain considered for the simulation of a strip caster is illustrated in also given in Fig. 1. The governning mass, momentum and heat equations were solved by using the commercial program, CFX. The governing equations were discretised using a finite-volume formulation and solved using the SIMPLEC algorithm. Calculations were carried out for the grid size
18552 using a non-uniform mesh with most points clustered towards x¼0 and y¼W=2, in order to resolve region along the mould wall where solidification begins. During the computation, the liquid fraction was updated based on the previously computed nodal sensible heat and liquid fractions. It was found that in order to obtain convergence from a relatively simple initial guess (for example, T ¼Tcast, u¼ujet, v¼0, everywhere), a
solid-ification interval (TliqTsol) of around 6 K was required;
subsequently, this solution could be used as an initial guess to generate a converged solution for smaller values of (TliqTsol), and so on. Ultimately, it was found that, for
this grid size, this procedure could be used for (TliqTsol) as
low as 0.1 K; furthermore, a comparison of temperature contour plots for (TliqTsolÞ ¼6K and 0.1 K indicates in
general little or no substantial difference, so that, in view of computational cost, it was decided to carry out the majority of runs for 6 K.
In the computations carried out here with the value ofUc
given in Table 2, adequately converged solutions were obtained after about 15000 iterations of the SIMPLEC algorithm; such runs typically required around 30 hours of CPU time on a Cray J932 Supercomputer. Further procedural details can be found in the CFX manual.29)
6. Results
The experimental results are presented first. The numerical model predications were obtained by using the heat transfer coefficient from the experimental data. In order to verify the accuracy of the model, its predictions were compared with the new experiments. These are described following the presentation of the experimental results.
The temperature calculation, in this study, was carried out with an assumed heat-transfer coefficient,h, between the cast strip and mould wall given by:
dQ
dt ¼Kmould
@Tmould
@y ¼hðTsToÞ; ð13Þ
whereTsis the surface temperature of the strip,Tmouldis the
temperature distriburion in the mould and Kmould is the
6.1 Experimental results
In order to evaluate the mean heat flux from the cast strip to the cooling water, the following heat balance has been used:
dQ
dt ¼CpV
dT
dt þVðHfÞ
df
dt : ð14Þ
The heat entering the mould comes from heat of fusion of the solidifying metal as well as cooling the metal before and after solidification process. This is described by the first term on the right hand side of the eq. (14). The second term describes the rate of heat generated during the solidification process. It equals zero before the start, and after the end, of solidification. The rate of heat generated due to solidification corresponds to the latent heat of fusion.
Typical cooling curves along the centreline, obtained from the experimental work, are shown in Fig. 2. The cooling curves contain a plateau, where the temperature is almost constant. This temperature is called the solidification temper-ature. The end of the solidification process can be recognized from a sudden change in the slope of the curve. The temperature data, measured as a function of time, were transformed into a function of distance from the meniscus by a simple transformation using the casting velocity. The superheat temperatures, cooling rates, for both liquid and solid regions, solidification times and temperatures were evaluated from the cooling curves. As a result, the average heat released from the solidified strip to the mould surface was found to be in the order of 1.4–1.9 MWm2 depending on casting speed, with the lower value corresponding to a lower casting speed.
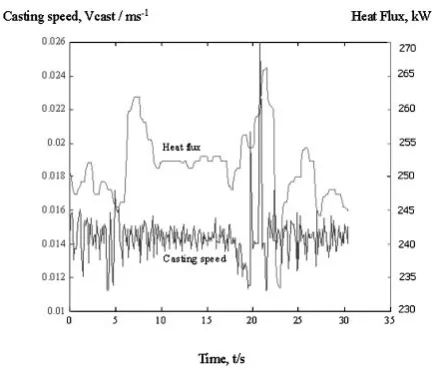
Furthermore, Fig. 3 shows a typical total heat flux, as a function of time, measured directly during a casting process. Although not evident from this figure, it was found that average heat flux values for the back side of the mould was slightly higher than that for the front side, which itself on average was about 200–250 kw/mould side. The correspond-ing castcorrespond-ing speed is also given in Fig. 3. Fluctuations were noticed in both curves during the casting experiments, and in general it was found to be difficult to maintain a steady casting speed.
The total mean flux from the mould was also estimated by
measuring the temperature difference and then using eq. (13). Typically, thermocouples or pairs of thermocouples are placed in the mould at various locations. Their response is primarily used to determine the temperature distribution along the mould length and secondly to compute the heat release from the mould.
The variation of measured mean mould temperature with time as a function of thermocouple position is shown in Fig. 4. Thermocouples were placed 2 mm from the mould surface at three different levels (distances) from the meniscus. The results can help to estimate the heat transfer coefficient by means of eq. (13). The results show that one side of the mould is warmer than the other. Here, also, fluctuations were noticed in the measurements, although we do not present the relevant figures here.
Figure 5 shows a typical temperature-distance profile close to the strip surface,Ts, during solidification. These
measure-ments can also be used to estimate the heat transfer coefficient. The results show that, for both casting speeds, the surface temperature decreases more slowly for depths at which liquid is still present at the centreline than at greater depths, where liquid is no longer present. The decrease in the surface temperature for the higher casting speed is more rapid than for the lower. Again, the temperature data, measured as a function of time, were transformed into a function of distance from the meniscus by a simple transformation using the casting velocity.
Fig. 2 Measured cooling curves for centreline jet obtained from the experimental work.
Fig. 3 Total heat flux and corresponding casting speed, as a function of time measured directly during a casting process.
Mould Mean Temperature Over Time
0 50 100 150 200 250
1 2 3 4 5 6 7 8 Position of TC
T
e
mperature
, T/C
00:08:40 00:13:12 00:19:42 00:26:24 00:39:30 00:46:12 00:52:16 00:59:24 01:06:00 01:12:20 01:18:12 01:24:16 01:33:12
[image:5.595.318.534.69.254.2] [image:5.595.310.548.311.422.2] [image:5.595.56.283.579.758.2]A third, and probably most accurate, method to measure the heat flux distribution along the mould depth can be described by:
dQ
dt ¼
waterCwater
P V
waterT water
Amould ; ð15Þ
wherewater andCwater
P and denote density and specific heat
capacity of the mould cooling water, Vwater and Twater
denote the velocity and temperature difference of incoming and outgoing cooling water for each cooling channel, and
Amould is the mould surface area. Here, the heat flux
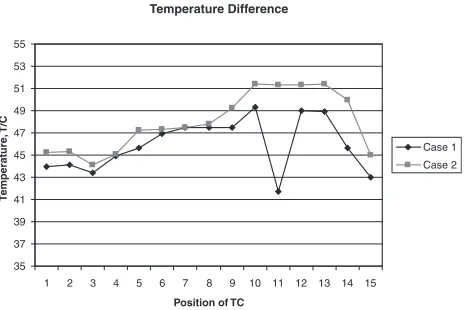
distribution along the mould depth can be computed, if the velocity and temperature of incoming cooling water are known. The variation of the measured temperature of the exiting cooling water, as a function of thermocouple position corresponding to different distance from the meniscus, are shown in Fig. 6.
Unfortunately, difficulties were encountered in measuring the velocity of cooling water in each channel, so that the data set that was obtained was incomplete. Those results, how-ever, will be discussed in a later publication.
Within the scope of these experimental results, and by means of the heat flux measurements, both the temperature distribution along the mould depth and the heat transfer coefficient at the mould surface can be determined.
A typical resulting temperature profile along the mould depth, used for the computation, is given in Fig. 7. The experimental data, marked by crosses, was fitted with a quadratic polynomial, as given by eq. (11). The heat transfer coefficient calculation was carried out with an assumed mould wall temperature, To. The experimental values of h
were also fitted with a second-order polynomial, as given by eq. (12); a typical resulting heat transfer coefficient along the mould depth, used for the computations, is also given in this figure.
The fluctuation in temperature-time curves often shows a variation over 40 K, which leads to an uncertainty in determining the mould wall temperature distribution when fitting data. Furthermore, technical difficulties in inserting thermocouples also lead to problems as regards data-fitting. Also, it is not easy to know beforehand how h, evaluated under one set of casting conditions, will change when these conditions, principally the casting speed, are altered.
However, to find reasonable range of profiles forhandTo,
a series of numerical computations with different mould temperature and heat transfer coefficient were performed.
6.2 Numerical results
Calculations were carried out for five different casting speeds. Superheated liquid at a uniform casting temperature
Tcast >Tmeltenters the mould at a uniform feed velocityUc.
The flow of melt through the nozzle was adjusted accordingly to satisfy mass continuity. In addition to the standard casting speed of 0.01830 ms1, the models were used to analyse the effect of varying casting speed from 0.01 to 0.01830 ms1on the solidification behaviour. Naturally, higher casting speeds are of particular interest from the industrial point of view, as this corresponds to increased productivity. The heat flux value at the top surface of the mould in the liquid region, is presented in Table 1 and used as cooling boundary conditions. The heat-transfer coefficient given by eq. (12) was also used as a cooling boundary condition between the cast strip and the mould surface (cooling water). Further-more, the comparison of numerical and experimental cooling curves for one or more of the central jets is seen to provide a
Fig. 5 Measured temperature-time profile for the strip surface.
Temperature Difference
35 37 39 41 43 45 47 49 51 53 55
1 2 3 4 5 6 7 8 9 10 11 12 13 14 15 Position of TC
T
e
mperature
, T/C
Case 1 Case 2
Fig. 6 Measured mould outgoing cooling water temperature as a function of thermocouple position.
[image:6.595.57.283.72.253.2] [image:6.595.309.539.73.260.2] [image:6.595.54.286.603.758.2]further indication of the magnitudes ofhandTo.
It was found, however, that by changing the heat transfer coefficient at the mould surface, it was possible to change the starting point of the solidification at the side wall of the mould. Therefore, simulations were run for different h -profiles (as a function of mould depth), and the results for these profiles were compared in order to determine quanti-tatively their effect upon the shape and location of the solidification front. Those results, however, will be discussed together with relevant experimental data in a later publica-tion.
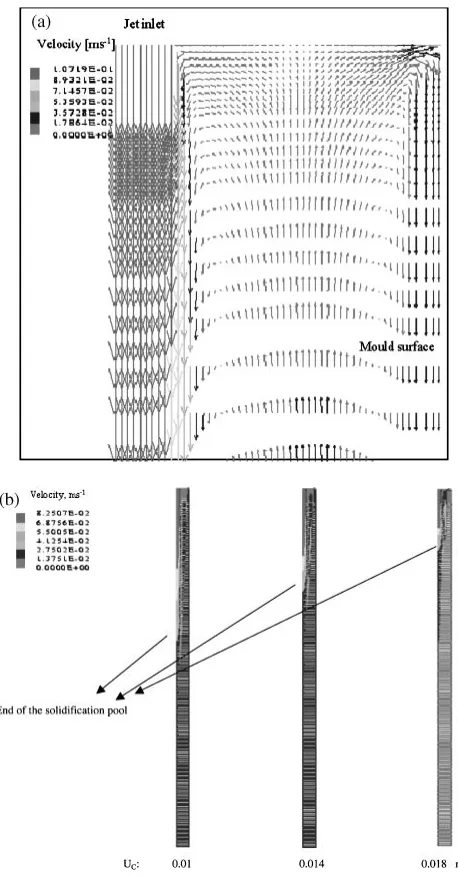
Typical computed velocity fields (in the upper region of a strip, Fig. 8(a) for different casting speed are shown in Fig. 8(b). It can be seen (Fig. 8(a)) that the velocity varies markedly in the upper region of the caster, both in direction and magnitude; a melt recirculation develops in this region due to mass and momentum entrainment of liquid. The depth of the recirculating zone depends on the casting speed. The
velocity vectors become parallel and oriented vertically downwards further down in the caster. Comparing the results for different casting velocities, from 0.01 up to 0.0183 ms1,
indicates that an increase of casting speed results in an increase in the length of the recirculation zone. It was also discussed28,30)that the temperature field depends on the inlet temperature, heat transfer coefficient and casting speed.
It was explained earlier that the location of the solid-ification fronts is significantly affected by a change in the casting speed. Lower casting speeds resulted in a shallower liquid pool, compared to a higher casting speed. Figure 9(a) shows the effect of casting speed on the location and shape of the solidification front, similar to those presented earlier.30) The solidification profiles were calculated based on the liquid fraction. As expected, it can be seen that with an increase of the casting speed, the solidification front moves downstream. The results indicate that for low Uc, the slope of the
solidification front is less steep. Note that for structural uniformity of the cast material, it is desired to have the solidification front slope as low as possible. It can further on be seen that with the increase of the casting speed, the local heat removal along the mould surface increases. For lower
Uc, less heat is being extracted from the mould surface (Fig.
Fig. 8 Typical computed velocity field for a) upper region of the mould and b) solidification pool depth for different casting speed ofUc¼0:0183,
Uc¼0:014ms1andUc¼0:010ms1.
[image:7.595.52.281.312.750.2] [image:7.595.314.540.376.749.2]9(b)). This is because with the increase ofUc, the amount of
molten metal flow increases.
Calculated centreline and surface temperature can be compared with experimental measurements for different Uc
andHf. Figures 10(a,b,c) shows the temperature
measure-ments along the centreline of the strip in the mould region. The computed temperature profiles along the centreline of the strip during the solidification process for different Uc and
Hf are also shown in Fig. 10. It can be noted that the
temperatures of the strip within the caster are higher for higher casting speeds, compared to a lower casting speed.
[image:8.595.314.538.193.768.2]The results in Figs. 11(a,b,c) show that the calculated surface temperature profiles are similar to the temperature measured in the plant experiments. For the numerical simulations, the maximum decrease in the surface temper-ature in the entire mould region varies between 100 and 300 K when the latent heat is decreased from to 205 to 120 kJ kg1. Further, the results show that the lower value of
Fig. 10 Simulated and measured temperature-distance curves for center-line of the strip.
[image:8.595.55.281.200.760.2]the heat of fusion gives better agreement between the computed and experimental results. The results also indicate that the experimental maximum decrease in the surface temperature in the upper mould region is approximately 80 K. It is evident from the results presented here (Figs. 10–11) that values for Hf lower than the tabulated ones lead to a
better agreement between the computed and experimental results; this agrees with earlier results,31–33) which indicate that the calculatedHf, obtained from the experiments, are
much lower than the tabulated equilibrium values. This will be discussed again in the next section in connection with the formation and condensation of lattice defects. The effect of the latent heat of fusion on the shape and location of the solidification front, the solidification time and heat flux at strip/mould interface has been discussed earlier.30) It was shown that as Hf increases, so the solidification time
increases. Lower Hf values result in a shallower liquid
pool, and less heat flux, compared to a higher latent heat of fusion. This will also be discussed in next section.
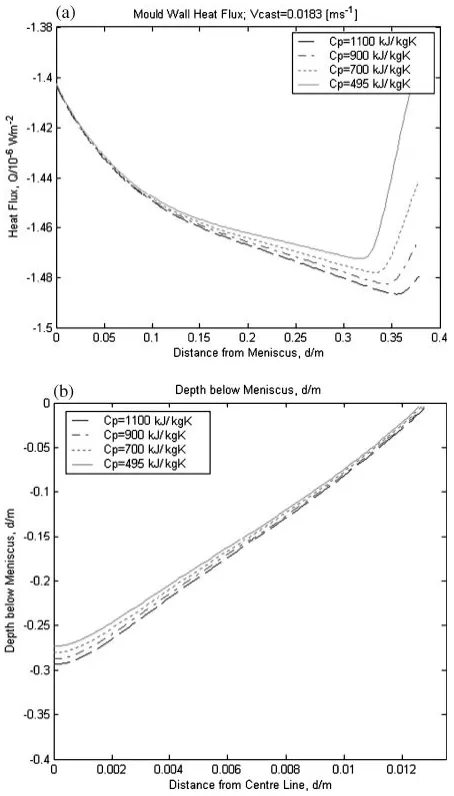
Figures 12(a,b) shows the effect of the specific heat capacity in the solid on the shape and location of solid-ification front and heat flux at strip/mould interface,
respectively. The calculations have been performed for
Uc¼0:0183ms1 and Tcast¼1397K. It can be seen that
an increase in theCs
Pvalue causes the solidification front to
move downstream. Lower Cs
P values result in a shallower
liquid pool, and lower heat flux. This will again be discussed in next section.
It was earlier30) explained that the casting speed had a significant effect on the outlet temperature profile of the cast material. In general it can be seen that with an increase of withdrawal speed, the outlet surface temperature of the cast material remains at a higher temperature. This is because of the fact that increased Uc constitutes higher amount of hot
molten metal that needs to be cooled per unit time. As such, the solidification front moves downstream, resulting in a higher cast-material temperature. This situation can be seen by comparing centreline temperature distributions of the cast material.
7. Discussion
Computational results show that the theoretical prediction of the location of the interface is in reasonable agreement with the experimentally measured ones.
The results are valuable for analysing the effects of different casting parameters, such as the mould wall temper-ature, the superheat of the molten material, the heat of fusion, the specific heat capacity and the casting speed, on a continuous casting process.
It was observed in this study that the casting speed has a significant effect on the solidification process. It controls the solidification front location and shape, which directly con-tribute to the microstructural quality of the cast material and determining of the mould design. It can be seen that with the increase of the casting speed, the solidification front moves downstream and the slope of the front become steeper. On the other hand, lower values of the casting speed decrease the productivity. Therefore, a cost-effective combination be-tween these parameters is very much desired. Thus, one should strictly control the casting conditions in order to improve the strip quality. An understanding of transport phenomena in the continuous casting system can help in optimizing a casting process.
As discussed before, the shape of the solidification front is very important for controlling the structural uniformity of the cast material. A steeper solidification front results in higher structural non-uniformity, while a flat interface is desirable to get better uniformity in the cast product. The shape and location of the solidification front may be controlled by varying the cooling condition in the mould or the casting speed. The results presented here are of interest and importance in obtaining a better control of existing continous casting processes leading to improved product quality and increased productivity.
The calculations showed that the location of the solid-ification front depends significantly on the heat of fusion during the solidification. LowerHf resulted in a shallower
liquid pool, compared to a higher latent heat value. This is because with the increase of the Hf, more heat is being
[image:9.595.56.283.361.759.2]extracted locally from the mould surface. Figure 13 shows calculated fraction of latent heat, Hmeas=Htab, versus
cooling rate produced in DTA experiments together with the results obtained earlier31–33)from mirror furnace equipment and levitation technique for higher cooling rates. The results show that the calculated values for heat of fusion are much lower than the tabulated ones. The figure also shows that an increase in the cooling rate will decrease the values forHf.
In the earlier works,31,32) it was discussed how large fractions of vacancies form and condense during rapid solidification processes in copper base alloys. The influence of such defects on the thermodynamic states and solid-ification behaviour of the alloys was also investigated. In particular, an increase in the concentration of vacancies will affect both solidification behaviour and thermodynamic properties, such as the latent heat of fusion and the specific heat. However, at very high cooling rates, when the fraction of vacancies (yv) exceeds the equilibrium value (yeqv ), an
unordered solid state is expected to form with a large supersaturation of vacancies preserved at room temperature. This is due to the fact that there is insufficient time for the vacancies to diffuse and create clusters, to form dislocations or move to grain boundaries. Penetration of these vacancies into the lattice increases the free energy (G) of the solid phase. Increasing G results in a decrease in the heat of fusion as well as a decrease in the melting point.
It was previously shown31,32) that the heat of fusion, undercooling temperature and specific heat capacity for pure Cu change by the fraction of excess vacancies (those exceeding the equilibrium number) as follow:
Hmeas¼Htab ðyvyeqv ÞHv;
TCu¼
RTTm yvln
yv
yeqv
þ ð1yvÞln
1yv
1yeqv
Htab
Cps ¼Ss,op þHV
dyV
dT ;
whereHVis enthalpy for formation of vacancies,TCu is
the undercooling temperature andCs
P,Cs,op is the calculated
and tabulated specific heat, respectively.
An increase in vacancy fraction will increase the free energy of the solid phase, which will result in a decrease in
the latent heat of fusion and the melting point. Consequently, the predicted values of Hf are much lower than the
tabulated ones, which will have implications for the shape and location of the solidification front, as well as leading to shorter solidification time. Note that the heat of fusion represents the energy required to melt a mass unit or a mole of substance;i.e.the total energy needed to break the bonds between the atoms in the crystal lattice. If vacancies are present, some bonds are missing, and thus, the total energy decreases with increasing vacancy concentration.
The results show that the heat flux at the mould/strip interface has a direct and significant effect on the location of the solidification front, the temperature profiles and hence the physical properties and microstructure of the solidified material. Although heat transfer fundamentals are well known, there has been considerable difficulty in applying them successfully to gain a better understanding of the strip casting process. A detailed analysis of the heat transfer between the strip and the mould, certainly would be very useful in order to understand not only the shell growth, but also the shape and location of the solidification front.
Despite the obvious limitation of two-dimensionality, which was adopted because a solution of the full three-dimensional Navier Stokes equations for the actual casting geometry involving multiple jets would have incurred a significantly greater computational cost, the results indicate that the model has useful practical application in the copper casting industry. Therefore, future investigation on these issues is warranted. Although much remains to be done, the information thus far generated should prove of considerable practical importance in the designing of mould cooling system.
In closing it should be added that there is clearly a need for more detailed experimental work to be performed using different alloys with different solidification behaviour; this should provide some interesting comparisons between experimental and simulated data at different casting con-ditions.
8. Conclusion
A 2-D, fully coupled model incorporating fluid flow, heat and mass transport was developed to analyse solidification in continuously cast strips. A modifiedk"turbulence model was developed and employed to investigate the effects of different casting conditions on the solidification behaviour. The following main conclusions can be drawn:
- the solidification front moves downstream and becomes steeper with the increase of the casting speed;
- the casting speed has a strong effect on temperature distribution throughout the cast material and the heat extraction rate;
- an increase of latent heat of fusion results in an increase of the solidification time; also, lower Hf values
resulted in a shallower liquid pool, compared to higher ones;
- lowerHfvalues leads to better agreement between the
computed and experimental results which agrees with earlier results;
- with the increase of specific heat, the solidification front
10-22 10-12 1002 1012 1022 1032 1042 1052 0.2
0.3 0.4 0.5 0.6 0.7 0.8
0.9 Pure CopperCu-2%Sn
Cu -4%Sn Cu -6%Sn Cu-12%Sn [%]
tab meas ∆H ∆H
] [K.s−1
[image:10.595.49.289.74.268.2]dt dT
moves downstream, and the local heat flux values removal from the mould surface increases with the increase of the amount of superheat;
- the model can predict the measured solidification curve with reasonable accuracy;
- a 3-D model is required to obtain results that are more comparable with experiments, although at the cost of greater computational time.
Acknowledgements
The authors are grateful to PhD C. M. Raihle and PhD. S. O¨ stlund for many fruitful discussions, ideas and help regarding the experimental work and to Prof. F. Bark for valuable discussions. We would like also to thank Outokumpu Copper Partner AB for financing this project. This work has been performed as a research project in the framework of the Faxe´n Laboratory.
REFERENCES
1) T. W. Clyne: Met. Sci.16(1982) 441–450.
2) B. G. Thomas, I. V. Samarasekera and J. K. Brimacombe: Metall. Trans.15B(1984) 307–318.
3) S. K. Das: Scan. J. of Metallurgy22(1993) 198–202.
4) M. R. Aboutalebi, M. Hasan and R. I. L. Guthrie: Metall. Trans.26B
(1995) 731–744.
5) J. E. Kelly, K. P. Michalek, T. G. O’Connor, B. G. Thomas and J. A. Dantzig: Metall. Trans.19A(1988) 2589–2602.
6) M. El-Bealy, N. Leskinen and H. Fredriksson: Ironmak. and Steelmak.
22(1995) 246–255.
7) N. Jacobsson, C. M. Raihle and N. Leskinen: Scand. J. Metall. 21
(1992) 172–180.
8) B. Lally, L. Biegler and H. Henrin: Metall. Trans.21B(1990) 761–770. 9) E. A. Mizikar: Iron Steel Eng.47(1970) 53–60.
10) B. Rogberg: Scand. J. Metall.12(1983) 13–21.
11) W. D. Rolph and K. J. Bathe: Int. J. Numer. Meth. Eng.18(1982) 119– 134.
12) J. Roose and O. Storrer: Int. J. Numer. Meth. Eng.20(1984) 217–225. 13) V. R. Voller and C. Prakash: Int. J. Heat Mass transfer30(1987) 1709–
1719.
14) M. Salcudean and Z. Abduallah: Int., J. Numer Meth. Eng.28(1988) 445–473.
15) A. D. Brent, V. R. Voller and K. J. Reid: Numer Heat Transfer13
(1988) 297–318.
16) B. G. Thomas, I. V. Samarasekara and J. K. Brimacombe: Metall. Trans.15B(1984) 307–318.
17) A. J. Dalhuijsen and Segal: Int. J. Numer. Meth. Eng.23(1986) 1807– 1829.
18) V. R. Voller, C. R. Swaminathan and B. G. Thomas: Int. J. Numer. Meth. Eng.30(1990) 875–898.
19) W. A. Tiller: J. Appl. Phys.29(1958) 611. 20) R. S. Wagner: J. Appl. Phys.29(1958) 1769.
21) P. E. Doherty and R. S. Davis: Acta Metall.7(1959) 118.
22) M. Haddad-Sabzevar and H. Fredriksson:Rapid Solidification of Cu-alloys, in PhD thesis, Stockholm (1994).
23) S. Berg, J. Dahlstro¨m and H. Fredriksson: ISIJ Int.35(1995) 876. 24) N. E. Mahallawy, M. Taha and H. Fredriksson: Mater. Sci. Eng.A179/
A180(1994) 587.
25) C. M. Raihle and S. O¨ stlund:Internal report of Outokumpu Copper, (1995) D-1340.
26) C. M. Raihle, H. Fredriksson and S. O¨ stlund:Modeling of Casting, Welding and Advanced Solidification Process VII, (London, UK, 1995) 817.
27) J. Mahmoudi and M. Vynnycky: J. Scand. J. Metall.30(2001) 21–29. 28) J. Mahmoudi and M. Vynnycky: J. Scand. J. Metall.30(2001) 30–40. 29) AEA Tech,CFX 4.2 Flow solver user guide, (1995), UK.
30) J. Mahmoudi, M. Vynnycky and H. Fredriksson: Scand. J. Metall.29
(2000) 30–40.
31) J. Mahmoudi and H. Fredriksson: Mater. Sci. Eng.A226–228(1997) 22.
32) J. Mahmoudi and H. Fredriksson: J. Mater. Sci.35(2000) 4977–4987. 33) J. Mahmoudi and H. Fredriksson: Mater. Trans., JIM41(2000) 1575–