Partially supported by Fundamental Research Funds for the Central Universities (XDJK2014C154). S.P. Wang and W.J. Wang contributed equally to this work.
Effects of dietary starch types on rumen fermentation
and blood profile in goats
S.P. Wang
1,2, W.J. Wang
1,2, Z.L. Tan
21Rongchang Campus of Southwest University, Chongqing, P.R. China
2Key Laboratory of Agro-ecological Processes in Subtropical Region, Institute of Subtropical Agriculture, Chinese Academy of Sciences, Changsha, P.R. China
ABSTRACT:The objective of the present study was to investigate how feeding a diet containing a type of puri-fied starch entirely produced from normal or high amylose maize grains would affect rumen fermentation and blood profile in goats. Twenty rumen-cannulated growing goats were assigned equally to one of two dietary treatments according to a randomized controlled trial design and fed two total mixed rations with similar ingredients and chemical composition except for the types of purified maize starch. One type was the high amylose starch (HAS), and the other was the normal amylose starch (NAS). Compared to goats fed the NAS diet, goats fed the HAS diet had significantly higher ruminal pH (P = 0.00), molar proportions of acetate (P = 0.00), butyrate (P = 0.01) and isobutyrate (P = 0.00), acetate to propionate ratio (P = 0.00), plasma concentra-tions of glucose (P = 0.02) and C-reactive protein (P = 0.03), and plasma levels of insulin (P = 0.03) and gastrin (P = 0.04), but had significantly lower ruminal concentrations of lactate (P = 0.04) and total volatile fatty acids (P = 0.04), propionate molar percentage (P = 0.00), whole blood ammonia concentration (P = 0.02), plasma concentrations of urea nitrogen (P = 0.00) and creatinine (P = 0.02), plasma levels of glucagon (P = 0.02) and motilin (P = 0.04), and plasma activities of glutamic-oxaloacetic transaminase (P = 0.02) and creatine kinase (P = 0.03). In addition, the HAS diet in comparison to the NAS diet tended to raise whole blood hematocrit (P = 0.08), plasma concentrations of albumin (P = 0.09), branched-chain amino acids (P = 0.09), valine (P = 0.09), phenylalanine (P = 0.08) and proline (P = 0.07), plasma levels of growth hormone (P = 0.06) and interleukin-2 (P = 0.07), and plasma α-amylase (P = 0.05) activity in goats. In conclusion, results showed that feeding goats the HAS diet instead of the NAS diet had multiple beneficial effects.
Keywords: high amylose starch; rumen environmental parameter; blood indicator; ruminat
INTRODUCTION
In well-managed and intensive systems, feeding high grain diets to ruminants prevails in order to optimize production because grains are cheaper relative to forages and augment the energetic den-sity of diet. Starch is the major energy component of grains. Thus, promotions in these intensive sys-tems will rely on meliorated conversion of starch to animal product. Various processing methods of grains, including mechanical, thermal or chemical
rumen pH due to the load of VFA. As a result, many attempts have been made to modify the nature and amount of starch available to rumen microbiota so as to shift part of starch digestion to the hindgut for the improvement of animal performance and feed efficiency as well as the absence of impairing animal health (Noziere et al. 2005).
The digestive anatomy and physiology of rumi-nants is markedly different from that of monogas-tric animals because there are three additional digestive organs at the anterior end of the tract, namely the rumen, reticulum, and omasum. A mixed population of microbes (including bacteria, ciliate protozoa, and anaerobic fungi) inhabits the reticulo-rumen and carries out the microbial fermentation of feedstuffs consumed by ruminants prior to gastric and intestinal digestion. Although there are some similarities in terms of microbial fermentation between the ruminant forestom-ach and the monogastric hindgut, there are a lot of differences, too. For example, the microbial ecosystem, the digesta passage kinetics and the diversity, absorption and utilization of fermenta-tion end-products in the rumen of ruminants are essentially unlike those in the large intestinal of monogastrics. Consequently, maybe the digestive and metabolic fate of resistant starch (RS) in rumi-nants is quite distinct from that in monogastrics. Significant variations in ruminal starch degrada-tion exist among cereal species, and also among cultivars within species as a result of considerable differences in genotype (Svihus et al. 2005). Cereal genotypes control grain starch characteristics, such as content, composition, structures, physical properties, and so on (Stevnebo et al. 2009). Starch granules are composed mainly of amylopectin and amylose. Amylopectin consists of a highly branched polymer of glucose units with α-1,6-linkages next to the α-1,4-linkages, while amylose is charac-terized by a linear polymer with α-1,4-linkages (Svihus et al. 2005). The proportion of amylose in normal maize starches usually varies from 200 to 300 g/kg. However, some maize starches from the waxy genotypes contain very little amylose, while other starches, called amylomaize, may consist of about 650–700 g amylose/kg (Svihus et al. 2005). Svihus et al. (2005) concluded from several in vitro studies that there is a negative relationship between the amylose/amylopectin ratio and starch digestion rate in cereal grains. However, it is not clear whether this effect arises from the starch
primary structure itself, or the changes in starch granule structure caused by the amylose/amylo-pectin ratio, or the interactions with processing conditions, starch granule size and organization (Svihus et al. 2005). Research with high amylose cereal grains in ruminants is scarce. Only several studies have focused on in vitro rumen fermenta-tion. Using an automated in vitro gas production system, Stevnebo et al. (2009) showed that milled grains and purified starches from barley cultivars with low amylose had a higher effective rate of digestion compared with cultivars with normal amylose and high amylose. Ali et al. (2014) sug-gested that in vitro starch degradation of the maize kernels in rumen fluid was inversely related to the amylose content.
The objective of this study was to investigate how feeding a diet containing a type of purified starch entirely produced from normal or high amylose maize grains would affect rumen fermentation and blood profile in goats.
MATERIAL AND METHODS
Animals and diets. Twenty ruminally
normal amylose starch (NAS), isolated from the grains of a native maize variety in southwestern China, was purchased from a local supermarket. The high amylose starch (HAS), extracted from the grains of a high amylose maize variety (Hi-maize® 1043), was purchased from the National Starch and Food Innovation, Bridgewater, USA. Both the NAS and the HAS were fine, white and free-flowing powders without odour or flavour. The experimental procedures were approved by and conformed to the requirements of the Animal Care and Use Committee of Southwest University, Chongqing, China. The veterinary supervision was provided to the animals throughout the experiment.
[image:3.595.63.289.125.450.2]Rumen fermentation.For estimating the rumen fermentation characteristics, pH and the concen-trations of ammonia nitrogen (N) and VFA in the rumen fluid were measured on day 11. At 0.5, 2, 4, 6, 8, 10, and 12 h after the morning feeding, about 20 ml of the rumen fluid was collected from sev-eral sites within the rumen (reticulum, dorsal and ventral sac) with a filter probe tube via the cannula. The pH was immediately determined (Sartorius Basic pH meter PB-20; Sartorius AG, Göttingen, Germany). Then the samples were instantly strained through four layers of cheese cloth with a mesh size of 250 μm. 8 ml of filtrate was centrifuged at 20 000 g for 15 min at 4°C (Himac CR22G2; Hitachi Koki Co., Ltd., Tokyo, Japan). Then 5 ml of deserved clear supernatant was added 1 ml of 20 g/l sulphuric acid and was stored at −20°C for the analysis of ammonia N concentration by a phenol-hypochlorite assay (Chaney and Marbach 1962). Another 8 ml of filtrate was centrifuged at 500 g for 10 min at 4°C (Rotanta 460 R; Hettich Zentrifugan, Tuttlingen, Germany). Then 5 ml of deserved clear supernatant was put into a plastic bottle containing 1 ml of 250 g/l meta-phosphoric acid and 1 ml of 6 g/l 2-ethyl butyric acid (internal
Table 1. Ingredients and chemical composition of the experimental diets1 (g/kg)
Items Amylose starch
normal high
Ingredients
Maize stover 400.0 400.0
Purified maize starch 248.5 258.0 Corn gluten meal 170.4 170.0
Paddy hull 143.2 143.2
Soybean oil 16.5 7.4
Sodium chloride 0.4 0.4
Calcium carbonate 0.7 0.7
Calcium hydrogen phosphate 8.3 8.3
Premix2 12.0 12.0
Chemical composition
Dry matter 927.8 929.9
Gross energy (MJ/kg) 18.3 18.6
Organic matter 904.4 905.8
Crude protein 154.3 157.7
Total starch 236.3 234.7
aNDFom 384.9 388.9
ADFom 244.5 261.5
Ether extract 28.6 22.1
Calcium 12.4 12.8
Phosphorus 8.3 8.7
aNDFom = amylase-treated ash-free neutral detergent fibre, ADFom = ash-free acid detergent fibre
1all values were expressed on a dry matter basis except for the dry matter on an air-dried matter basis
2premix provided per kg of dry matter: KI 0.26 g, FeSO 4·7H2O 7.65 g, CuSO4·5H2O 2.55 g, MnSO4·1H2O 10.20 g, ZnSO4·7H2O 9.18 g, Na2SeO3 0.05 g, CoCl2·2H2O 0.06 g, vitamin A 625 000 IU, vitamin D 65 500 IU, vitamin E 39 100 IU
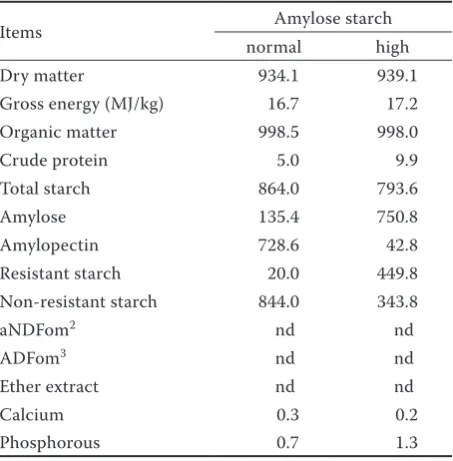
Table 2. Characterization of the experimental starches1 (g/kg)
Items Amylose starch
normal high
Dry matter 934.1 939.1
Gross energy (MJ/kg) 16.7 17.2
Organic matter 998.5 998.0
Crude protein 5.0 9.9
Total starch 864.0 793.6
Amylose 135.4 750.8
Amylopectin 728.6 42.8
Resistant starch 20.0 449.8
Non-resistant starch 844.0 343.8
aNDFom2 nd nd
ADFom3 nd nd
Ether extract nd nd
Calcium 0.3 0.2
Phosphorous 0.7 1.3
[image:3.595.305.532.126.357.2]standard), and further centrifuged at 20 000 g for 15 min at 4°C. The final supernatant was stored at −20°C for the determination of concentrations of lactate and individual VFA by gas chromatography (HP 5890; Hewlett-Packard Co., Palo Alto, USA) and the calculation of total VFA concentration in accordance with the procedure described by Jouany (1982). The HP 5890 gas chromatograph was fitted with an on-column injector, a 30 m × 0.530 mm HP-FFAP capillary column (1.0 μm thickness), and a flame ionization detector.
Blood profile. For evaluating the blood profile, blood samples were taken out from the jugular vein at 0.5, 4, 8, and 12 h after the morning feeding on day 15. Five ml of blood was pumped with a heparinized syringe. The syringe was chilled in an ice bath immediately. 2 ml of sample was instantly utilized to determine the pH (Sartorius Basic pH meter PB-20). Subsequently, the remaining 2 ml were divided into two equal parts to detect the ammonia concentration and the hematocrit in 10 min. The ammonia concentration was estimated with a colorimetric method according to the in-dophenol production (Huizenga et al. 1994). The hematocrit was measured by the Wintrobe method based on the centrifugation of heparinized blood in a capillary tube at 10 000 g for 5 min at 4°C (Pal and Pravati 2006). 12 ml of blood was drawn and injected carefully into a pre‐chilled and aseptic vacutainer tube containing heparin sodium. After being inverted gently a couple of times, the tube was kept in an ice box, then centrifuged at 3000 g
for 15 min at 4°C to harvest plasma. The aliquots of plasma were transferred into the storage tubes labelled with date and animal identification, then stored at −20°C until further analysis. The levels of hormones, entailing growth hormone (GH), insulin, glucagon, triiodothyronine, tetraiodothy-ronine, gastrin, motilin, leptin, and interleukin-2 (IL-2), were assayed by radioimmunoassay us-ing an automatic gamma counter (CliniGamma 1272-001; LKB Wallac, Turku, Finland), while the corresponding commercial kits were purchased from the Beijing North Institute of Biological Technology (Beijing, China). The concentrations of metabolites, including glucose, urea N, creati-nine, triglyceride, total cholesterol, lactate, total protein, albumin, and C-reactive protein (CRP), as well as the activities of enzymes, encompassing glutamate-pyruvate transaminase (GPT), glutamic-oxaloacetic transaminase (GOT), creatine kinase
(CK), lactate dehydrogenase (LDH), α-amylase, and lipase, were detected using an automatic biochem-istry analyzer (SYNCHRON CX5 PRO; Beckman Coulter, Fullerton, USA) by the appointed com-mercial kits from Beckman Coulter.
Chemical analysis. 1000 g of samples from the experimental diets and starches were randomly collected and then finely milled through a 1-mm screen for the further analysis. Gross energy was quantified by an isoperibol bomb calorimeter XRY-1C (Henghe Instrument Company, Changsha, China) with benzoic acid as a standard. Dry mat-ter, organic matmat-ter, crude protein, ether extract, calcium, and phosphorus were analyzed using the official methods (AOAC 2005). Amylase-treated ash-free neutral detergent fibre (aNDFom) and ash-free acid detergent fibre (ADFom) were de-termined as described by Van Soest et al. (1991). Sodium sulfite and heat-stable α-amylase were used in the aNDFom determination. Total starch (TS) and RS were detected with commercial kits (Megazyme International Ireland Ltd., Bray, Ire-land) according to instructions of manufacturers and protocols of the kits. Non-resistant starch (NRS) was calculated as the difference between TS and RS. Amylose and amylopectin were defined by a triple-wavelength colorimetry based on the principle of iodine binding as described by Wang et al. (2010).
Statistical analysis. Data were subject to one-way analysis of variance using the PROC GLM procedure of SAS (Statistical Analysis System, Version 9.1.3, 2005) with dietary treatment as the classification factor. Data were summarized by sampling time and then analyzed using the same mixed model but with time included as a repeated measure using compound symmetry. Results were expressed as mean ± standard deviation (M ± SD). Comparisons between average values for the two dietary groups were assessed by Duncan’s Multiple Range Test. The degree of statistical significance was set as follows: P > 0.10, no significance; 0.05 ≤
P < 0.10, tendency; P < 0.05, significance.
RESULTS
Rumen fermentation. Compared to goats fed
the NAS diet, goats fed the HAS diet had higher ruminal pH, molar proportions of acetate, butyrate, and isobutyrate, and acetate to propionate ratio (all
of lactate (P = 0.04) and total VFA (P = 0.04), and propionate molar percentage (P = 0.00) (Table 3).
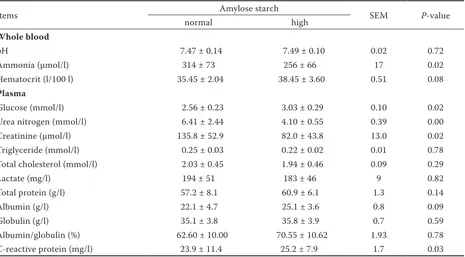
Blood biochemistry. For goats fed the HAS diet compared with the NAS diet, plasma concentra-tions of glucose (P = 0.02) and CRP (P = 0.03) were increased (P < 0.05), whereas concentrations of whole blood ammonia (P = 0.02), plasma urea N (P = 0.00), and plasma creatinine (P = 0.02) were
weaker (Table 4). In addition, there was tendency for whole blood hematocrit (P = 0.08) and plasma albumin concentration (P = 0.09) to be higher for goats fed the HAS diet compared with the NAS diet.
Plasma hormones and enzymes. Compared with
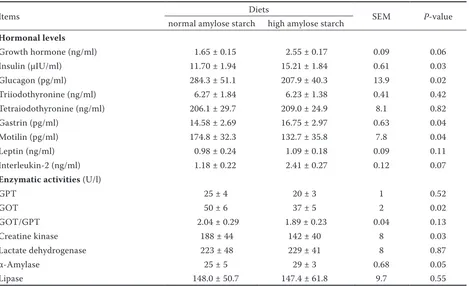
[image:5.595.70.532.112.313.2]the NAS diet, the HAS diet significantly increased insulin (P = 0.03) and gastrin (P = 0.04) levels in the plasma of goats, but significantly decreased
Table 3. Effects of dietary starch types on fermentation parameters in the rumen of goats
Items Amylose starch SEM P-value
normal high
pH 6.21 ± 0.39 6.41 ± 0.21 0.03 0.00
Ammonia nitrogen (mg/l) 277.5 ± 70.1 237.1 ± 67.6 7.5 0.82
Lactate (mg/l) 4.5 ± 1.3 3.2 ± 1.1 0.1 0.04
Total volatile fatty acids (mmol/l) 38.78 ± 11.56 27.53 ± 8.08 1.20 0.04
Volatile fatty acids (mol/100 mol)
Acetate 40.73 ± 9.47 42.65 ± 3.39 0.75 0.00
Propionate 48.06 ± 7.73 43.10 ± 3.58 0.68 0.00
Butyrate 12.59 ± 5.20 17.23 ± 2.31 0.49 0.01
Isobutyrate 2.76 ± 1.01 3.44 ± 0.69 0.10 0.00
Valerate 1.96 ± 0.78 2.41 ± 0.62 0.08 0.57
Isovalerate 3.34 ± 1.50 4.09 ± 1.18 0.15 0.10
Acetate/propionate 0.90 ± 0.38 1.00 ± 0.15 0.03 0.00
SEM = standard error of the mean
Table 4. Effects of dietary starch types on biochemical indices in the blood of goats
Items Amylose starch SEM P-value
normal high
Whole blood
pH 7.47 ± 0.14 7.49 ± 0.10 0.02 0.72
Ammonia (μmol/l) 314 ± 73 256 ± 66 17 0.02
Hematocrit (l/100 l) 35.45 ± 2.04 38.45 ± 3.60 0.51 0.08
Plasma
Glucose (mmol/l) 2.56 ± 0.23 3.03 ± 0.29 0.10 0.02
Urea nitrogen (mmol/l) 6.41 ± 2.44 4.10 ± 0.55 0.39 0.00
Creatinine (μmol/l) 135.8 ± 52.9 82.0 ± 43.8 13.0 0.02
Triglyceride (mmol/l) 0.25 ± 0.03 0.22 ± 0.02 0.01 0.78
Total cholesterol (mmol/l) 2.03 ± 0.45 1.94 ± 0.46 0.09 0.29
Lactate (mg/l) 194 ± 51 183 ± 46 9 0.82
Total protein (g/l) 57.2 ± 8.1 60.9 ± 6.1 1.3 0.14
Albumin (g/l) 22.1 ± 4.7 25.1 ± 3.6 0.8 0.09
Globulin (g/l) 35.1 ± 3.8 35.8 ± 3.9 0.7 0.59
Albumin/globulin (%) 62.60 ± 10.00 70.55 ± 10.62 1.93 0.78
C-reactive protein (mg/l) 23.9 ± 11.4 25.2 ± 7.9 1.7 0.03
[image:5.595.67.532.480.737.2]glucagon (P = 0.02) and motilin (P = 0.04) levels as well as GOT (P = 0.02) and CK (P = 0.03) activi-ties (Table 5). In addition, GH (P = 0.06) and IL-2 (P = 0.07) levels, along with α-amylase (P = 0.05) activity, had an upward tendency in the plasma of goats fed the HAS diet compared with those fed the NAS diet.
DISCUSSION
Effects of dietary starch types on rumen fer-mentation in goats. Directly available data on the HAS or the RS in ruminants are limited and inconsistent. Many researches, based on the in vitro
systems and the in situ technique, pointed out that there was a negative correlation between amylose proportion and starch degradation (Stevnebo et al. 2009). The crystalline structure of starch can reduce the accessibility for degrading enzymes, thus determine partly its degradability. Amylose exists in a crystalline form. Consequently, a part of the amylose cannot be degraded by α-amylase in the duodenum, known as RS. However, the mode of starch degradation in an in vitro system
with digestive enzymes or rumen fluid, as well as in an in situ incubation procedure, is significantly different from that in a complex in vivo process. This has been confirmed by numerous experiments which utilized the grains with some treatments or their purified starches from the waxy genotype cereals with high amylopectin and little amylose as research objects. Most in vitro and in situ studies presented an increased starch degradability with increased amylopectin. However, no difference in ruminal degradability in vitro for the purified starch of waxy vs normal sorghum and corn and in concentrations of VFA or ammonia N in vitro
[image:6.595.65.534.112.398.2]with the amylopectin content of barley varie-ties (Hristov et al., 2002), as well as a faster rate of hydrolysis for the purified starch of normal vs high-amylopectin barley in vitro (Tang et al. 2002), was reported. Simultaneously, several in vivo experiments displayed contradictory results. Thomas et al. (1976) found no differences among ruminal VFA concentrations for growing steers fed either conventional yellow dent corn or waxy corn diets that contained 77–81% (dry matter basis) corn grain. Schroeder et al. (1998) reported that
Table 5. Effects of dietary starch types on plasma hormones and enzymes in the blood of goats
Items Diets SEM P-value
normal amylose starch high amylose starch
Hormonal levels
Growth hormone (ng/ml) 1.65 ± 0.15 2.55 ± 0.17 0.09 0.06
Insulin (μIU/ml) 11.70 ± 1.94 15.21 ± 1.84 0.61 0.03
Glucagon (pg/ml) 284.3 ± 51.1 207.9 ± 40.3 13.9 0.02
Triiodothyronine (ng/ml) 6.27 ± 1.84 6.23 ± 1.38 0.41 0.42 Tetraiodothyronine (ng/ml) 206.1 ± 29.7 209.0 ± 24.9 8.1 0.82
Gastrin (pg/ml) 14.58 ± 2.69 16.75 ± 2.97 0.63 0.04
Motilin (pg/ml) 174.8 ± 32.3 132.7 ± 35.8 7.8 0.04
Leptin (ng/ml) 0.98 ± 0.24 1.09 ± 0.18 0.09 0.11
Interleukin-2 (ng/ml) 1.18 ± 0.22 2.41 ± 0.27 0.12 0.07
Enzymatic activities (U/l)
GPT 25 ± 4 20 ± 3 1 0.52
GOT 50 ± 6 37 ± 5 2 0.02
GOT/GPT 2.04 ± 0.29 1.89 ± 0.23 0.04 0.13
Creatine kinase 188 ± 44 142 ± 40 8 0.03
Lactate dehydrogenase 223 ± 48 229 ± 41 8 0.87
α-Amylase 25 ± 5 29 ± 3 0.68 0.05
Lipase 148.0 ± 50.7 147.4 ± 61.8 9.7 0.55
ruminal acetate, isobutyrate, isovalerate, and total VFA concentrations were significantly lower when waxy corn was added to the isonitrogenous diet of lactating dairy cows. Akay and Jackson (2001) observed lower ruminal pH, molar proportion of acetate and acetate to propionate ratio, together with the higher molar proportion of ruminal pro-pionate, for lactating dairy cows fed the waxy corn silage and grain diet than for those fed the conventional yellow dent corn silage and grain diet. Akay et al. (2002) indicated that higher ru-minal starch disappearance with the waxy corn diet compared to the conventional yellow dent corn diet in sheep induced higher molar propor-tions of propionate and lower molar proporpropor-tions of acetate and acetate to propionate ratio, but did not affect ruminal pH, fluid dilution rate, volume, ammonia N, and total VFA concentrations, as well as molar proportions of isobutyrate, butyrate, and valerate, and did not correspond to improvement in microbial N production or efficiency as well. Foley et al. (2006) found no significant differences in ruminal fermentation and microbial protein synthesis and flow between diets based on normal or waxy barley grain fed to lactating dairy cows, although waxy barley varieties might have a stimu-latory effect on ruminal ammonia utilization in vitro (Hristov et al. 2002). In the present study, significantly higher ruminal pH, molar propor-tions of acetate, butyrate, and isobutyrate, and acetate to propionate ratio, as well as significantly lower ruminal concentrations of lactate and total VFA, and propionate molar percentage, with the HAS diet compared to the NAS diet in goats, suggested that HAS decreased dietary supply of fermentable starch, which resulted in a reduced production of organic acids and a shift of rumen fermentation profile.
Ruminal pH is very important for the stability of the rumen microbial ecosystem. Maintaining rumen pH above 5.8 is helpful to prevent rumen disorders (Zebeli et al. 2008). The higher ruminal pH for goats fed the HAS diet might be mainly attributed to reductions in rumen VFA concentra-tion. However, rumen pH for goats fed the HAS or NAS diet was in the optimal range for rumen fermentation (Zebeli et al. 2008). In addition to the overall decrease in VFA concentrations in goats fed the HAS diet, there were also shifts in the VFA profiles. There were greater percentages of acetate, butyrate, and isobutyrate, and punier molar
pro-portions of propionate in goats fed the HAS diet. Higher ruminal pH is beneficial to maintain a bal-anced microbial population and has a positive effect on fibre degradation (Zebeli et al. 2008). Feeding goats the HAS diet changed rumen fermentation patterns to disfavour propionate, and resulted in an augment in the acetate to propionate ratio, although total VFA production dropped down. Lactate is an intermediate product during the rumen fermentation of non-structural carbohydrate. In general, lactate concentration is low in the rumen of normally functioning ruminants because of the existence of ruminal balance between lactate pro-ducers and utilizers. The depressed ruminal lactate concentration in goats fed the HAS diet indicated that the HAS diet contained less degradable starch than the NAS diet. Ammonia N provides most of the N required by the microbial protein synthesis in the rumen (Wang et al. 2012). Satter and Roffler (1975) suggested that higher ruminal ammonia N concentration represents more rapid deamination of proteins and/or less absorption via the rumen epithelial cells. According to the present results, HAS might not affect ruminal proteolysis of dietary protein, and might not modify N amounts supplied to rumen microbes.
Based on the present results, the HAS, compared with the NAS, provided goats with more ruminally undegradable starch, and hence shifted more starch digestion from the rumen to the small intestine. Deckardt et al. (2013) concluded that the enhance-ment of dietary bypass starch promoted more net glucose being transferred from the small intestine to the liver. In the present study, both a heightened insulin level and a diminished glucagon level in the plasma of goats fed the HAS diet in response to an increased glucose supply would accelerate glycogen-esis or force body cells to take up glucose from the blood, thus lessening blood glucose. A better energy supply means a better metabolic health status of the animals. The gonadotropin secretion and the follicle development were stimulated by increasing dietary starch reaching the duodenum and the subsequent promotion of glucose supply (Leroy et al. 2008). In response to the increase of rumen bypass starch in the diet of dairy cows, several plasma acute-phase proteins, such as haptoglobin and serum-amyloid A, were decreased, and several plasma variables indicat-ing the energy metabolism, such as glucose, insulin, and cholesterol, were increased, which was inter-preted as improvements of the immune and energy status of the animals (Iqbal et al. 2010). Based on the present results (hematocrit, albumin, CRP, GH, IL-2, GOT and CK, etc.), feeding goats the HAS diet rather than the NAS diet might bring about positive effects on the metabolic health status by potentially increasing starch flow to the small intestine.
In addition to effects on glucose supply, the transference of starch digestion site also impacts the absorption and metabolism of other nutrients and metabolites in ruminants (Reynolds 2006). The supplemental energy arising from postruminal starch digestion is beneficial to body adipose and protein retention (Reynolds 2006). The net portal-drained viscera release of ammonia was decreased with increasing duodenal starch flow (Noziere et al. 2005). The concentration of blood urea N is highly correlated with the urinary N excretion rate (Kohn et al. 2005). In the present study, the HAS ameliorated the status of N metabolism in goats due to the falls in the concentrations of whole blood ammonia, plasma urea N, and creatinine, but had no effect on the lipid metabolism owing to no modifications occurring in the triglyceride and total cholesterol concentrations, the leptin level, and the lipase activity in plasma. Thus, the HAS appeared to be intricately involved in the
overall metabolism of nutrients in goats. In addi-tion, the HAS represented a stimulatory effect on the digestive organs of goats because of ascending gastrin level and α-amylase activity, along with descending motilin level, in the plasma of goats fed the HAS diet compared with the NAS diet.
The proportions of RS in the HAS and the NAS were more than 50% and less than 3% of TS, re-spectively. The greatest difference for the destiny of RS in the alimentary tract of ruminants and monogastrics is that in ruminants the RS will be degraded by the microflora inhabiting the rumen as the first digestion process. According to the present results, the HAS, in comparison to the NAS, might supply goats more rumen bypass starch which certainly included RS and NRS. The diges-tion process of RS in the small intestine and the hindgut of ruminants should be similar with that of monogastrics. Therefore, the postruminal RS might exert some positive influences on animals, just like RS in monogastrics. Specially, for high-producing ruminants fed high amounts of cereal grains, a reasonable quantity of postruminal RS might protect animals from the hindgut acidosis. In the present study, feeding goats the HAS diet instead of the NAS diet might not only lower the amount of starch available for fermentation in the rumen, but also enhance the net hepatic glucose supply. However, future studies are needed to evaluate the degree and amount of RS fermenta-tion in the rumen, to clarify the duodenal diges-tion and absorpdiges-tion of the semi-product derived from the ruminal RS degradation, and to specify the optimal quantity of RS reaching the hindgut.
CONCLUSION
Feeding goats the HAS diet instead of the NAS diet positively affected the rumen fermentation patterns with a higher rumen pH and a better rumen VFA profile. Improvements were also observed in glucose supply, nutrient metabolism, and health status for goats fed the HAS diet in comparison to the NAS diet.
REFERENCES
Akay V., Jackson Jr. J.A., Harmon D.L. (2002): NutriDense and waxy corn hybrids: effects on site and extent of disap-pearance of nutrients in sheep. Journal of Animal Science, 80, 1335–1343.
Ali M., Cone J.W., Hendriks W.H., Struik P.C. (2014): Starch degradation in rumen fluid as influenced by genotype, climatic conditions and maturity stage of maize, grown under controlled conditions. Animal Feed Science and Technology, 193, 58–70.
AOAC (2005): Official Methods of Analysis. 18th Ed. Associa-tion of Official Analytical Chemists, Gaithersburg, USA. Chaney A.L., Marbach E.P. (1962): Modified reagents for
determination of urea and ammonia. Clinical Chemistry, 8, 130–132.
Deckardt K., Khol-Parisini A., Zebeli Q. (2013): Peculiarities of enhancing resistant starch in ruminants using chemi-cal methods: opportunities and challenge. Nutrients, 5, 1970–1988.
Foley A.E., Hristov A.N., Melgar A., Ropp J.K., Etter R.P., Zaman S., Hunt C.W., Huber K., Price W.J. (2006): Ef-fect of barley and its amylopectin content on ruminal fermentation and nitrogen utilization in lactating dairy cows. Journal of Dairy Science, 89, 4321–4335.
Hristov A.N., Ropp J.K., Hunt C.W. (2002): Effect of barley and its amylopectin content on ruminal fermentation and bacterial utilization of ammonia-N in vitro. Animal Feed Science and Technology, 99, 25–36.
Huizenga J.R., Tangerman A., Gips C.H. (1994): Determina-tion of ammonia in biological fluids. Annals of Clinical Biochemistry, 31, 529–543.
Huntington G.B. (1997): Starch utilization by ruminants: from basics to the bunk. Journal of Animal Science, 75, 852–867.
Huntington G.B., Harmon D.L., Richards C.J. (2006): Sites, rates, and limits of starch digestion and glucose me-tabolism in growing cattle. Journal of Animal Science, 84 (Suppl.), E14–E24.
Iqbal S., Zebeli Q., Mazzolari A., Dunn S.M., Ametaj B.N. (2010): Feeding rolled barley grain steeped in lactic acid modulated energy status and innate immunity in dairy cows. Journal of Dairy Science, 93, 5147–5156.
Jouany J.P. (1982): Volatile fatty acid and alcohol determina-tion in digestive contents, silage juices, bacterial cultures and anaerobic fermentor contents. Sciences des Aliments, 2, 131–144.
Kohn R.A., Dinneen M.M., Russek-Cohen E. (2005): Using blood urea nitrogen to predict nitrogen excretion and efficiency of nitrogen. Journal of Animal Science, 83, 879–889.
Leroy J.L.M.R., Opsomer G., Van Soom A., Goovaerts I.G.F., Bols P.E.J. (2008): Reduced fertility in high-yielding dairy
cows: Are the oocyte and embryo in danger? Part II: Mechanisms linking nutrition and reduced oocyte and embryo quality in high-yielding cows. Reproduction in Domestic Animals, 43, 623–632.
National Research Council (2007): Nutrient Requirements of Small Ruminants: Sheep, Goats, Cervids, and New World Camelids. The National Academies Press, Wash-ington, DC, USA.
Noziere P., Remond D., Lemosquet S., Chauveau B., Durand D., Poncet C. (2005): Effect of site of starch digestion on portal nutrient fluxes in steers. British Journal of Nutri-tion, 94, 182–191.
Pal G.K., Pravati P. (2006): Textbook of Practical Physiol-ogy for Dental Students. Orient BlackSwan/Universities Press, Andhra Pradesh, India.
Reynolds C.K. (2006): Production and metabolic effects of site of starch digestion in dairy cattle. Animal Feed Sci-ence and Technology, 130, 78–94.
Satter L.D., Roffler R.E. (1975): Nitrogen requirement and utilization in dairy cattle. Journal of Dairy Science, 58, 1219–1226.
Schroeder J.W., Marx G.D., Park C.S. (1998): Waxy corn as a replacement for dent corn for lactating dairy cows. Animal Feed Science and Technology, 72, 111–120. Stevnebo A., Seppala A., Harstad O.M., Huhtanen P. (2009):
Ruminal starch digestion characteristics in vitro of barley cultivars with varying amylose content. Animal Feed Sci-ence and Technology, 148, 167–182.
Svihus B., Uhlen A.K., Harstad O.M. (2005): Effect of starch granule structure, associated components and processing on nutritive value of cereal starch: a review. Animal Feed Science and Technology, 122, 303–320.
Tang H., Watanabe K., Mitsunaga T. (2002): Structure and functionality of large, medium and small granule starches in normal and waxy barley endosperm. Carbohydrate Polymers, 49, 217–224.
Thomas V.M., Glover D.V., Beeson W.M. (1976): Nitro-gen and energy utilization of new endosperm types of corn with growing steers. Journal of Animal Science, 42, 529–534.
Van Soest P.J., Robertson J.B., Lewis B.A. (1991): Methods for dietary fiber, neutral detergent fiber, and nonstarch polysaccharides in relation to animal nutrition. Journal of Dairy Science, 74, 3583–3597.
Wang J.P., Li Y., Tian Y.Q., Xu X.M., Ji X.X., Cao X., Jin Z.Y. (2010): A novel triple-wavelength colorimetric method for measuring amylose and amylopectin contents. Starch – Stärke, 62, 508–516.
Corresponding Author
Prof. Zhi Liang Tan, Key Laboratory of Agro-ecological Processes in Subtropical Region, Institute of Subtropical Agriculture, The Chinese Academy of Sciences, Changsha, Hunan 410125, P.R. China
Phone: +86 731 84 619 702, e-mail: zltan@isa.ac.cn
level on nitrogen metabolism in wethers. Small Ruminant Research, 108, 59–66.
Zebeli Q., Dijkstra J., Tafaj M., Steingass H., Ametaj B.N., Drochner W. (2008): Modeling the adequacy of dietary
fiber in dairy cow based on responses of ruminal pH and milk fat production to composition of the diet. Journal of Dairy Science, 91, 2046–2066.