wetting. Micro-droplets of distilled water deposited by post-wetting always occupied positions without or with little of this liquid, which might explain the obtained higher micro-than macro-wettability.
(Received December 13, 2002; Accepted January 16, 2003)
Keywords: distilled water, micro-wetting, macro-wetting, organic contaminants, wetting contact angle
1. Introduction
Recent studies1–3)on atmospheric corrosion of steels have been aimed at increasing their useful life. Corrosion occurs on metal surfaces1)when they are wetted by rain, moisture or dew because corrosive O2, SOx, NO2 or Cl can easily be
adsorbed on these surfaces. Particularly, the integrity or reliability of electronic information systems might be damaged2,3) even if slight corrosion occurred. It is very important to study the wetting behavior of water on materials to clarify such corrosion problems.5–12) The observation of micro-droplets of water is also important for the development of antirust-treatment-solutions and minus ion (water cluster/ mist) cleaning machines.4)
Although it is generally difficult to observe their three-dimensional shapes, the authors have succeeded in imaging micro-water and evaluating their wettabilities on several materials using the AC non-contact mode of atomic force microscope (AFM).8–12)The obtained results show that nano-size (micro-) water droplets are more stable and more wettable than milli-size (macro-) water droplets in ambient air. However, the reason for the lower contact angles by micro-droplets versus micro-droplets is not clear. Further-more, the wetting behavior is influenced by the specimen surface composition, but their relationship has not yet been clearly known.8–12)
In this work, the surface compositions of wet polished and air oxidized pure chromium specimens were analyzed with the X-ray photoelectron spectroscopy (XPS), and surface morphologies before and after micro-wetting by distilled water were observed using the atomic force microscope (AFM). The relationships are discussed.
2. Experimental Details
Commercially supplied pure chromium sheets (purity: 99.9%; size: 1 mm10 mm2 mm) were used as speci-mens. The specimens were wet polished with 1200#emery paper and 0.25mm alumina powder. Some polished speci-mens were further oxidized in air at 523 K for 3.6 ks. All specimens were ultrasonically cleaned in acetone and dried by warm blast, and then held in the desiccators (25–30%RH,
2933K) for use.
The specimen surface compositions were analyzed using X-ray photoelectron spectroscopy (XPS, Shimadzu Co.: AXIS ULTRA), changing the angles between the axis of the photoelectrons detector and the specimen surface (here-after called analysis angle ) from 15 to 90. The X-ray source was Mg Koperated at 15 kV, the anodic current was 10 mA, the operating pressure in the vacuum chamber was lower than 5107Pa and the analysis area was
2 mm1 mm.
The macro-and micro-wettabilities of water droplets on the specimen surfaces were measured as follows. For macro-wetting, a water droplet (about 20mL) was dropped onto the specimen surface and the shape was recorded with a digital microscope. The contact angle was obtained from the droplet shape. For micro-wetting, the specimen was ultrasonically held for 1.8 ks in distilled water, then blasted by air to produce micro-droplets of distilled water on the surface. Consequently, the surface morphology was observed with the AC non-contact mode of atomic force microscope (AFM, Shimadzu Co.: SFT-9800). The observation conditions and confirmation method of the micro-droplets were the same as our previous reports.8–12) The average diameter (2r) and height (h) were measured from cross-sectional profiles.11,12) All observations were carried out in ambient air with the relative humidity of 50–60%RH at2933K.
*1This Paper was Originally Published in the Journal of Japan Institute of Metals66(2002) 1135–1142.
*2Corresponding author: E-mail: [email protected]
3. Results and Discussion
3.1 Surface analysis by XPS
In the survey XPS spectrum of each specimen, the peaks for C 1s, O 1s and Cr 2p were present. The intensity of the carbon peak was greatly decreased after Arþ etching,
indicating that it originates from organic contaminants on the surface.
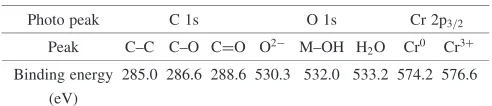
Figure1shows the curve resolution of C 1s, O 1s and Cr 2p photo peaks derived from pure chromium after wet polishing and oxidation. The analysis angle () between the specimen surface and the detection direction of photoelec-trons was set at 90. The binding energies for C 1s, O 1s and Cr 2p3=2are shown in Table1. Generally, the function group
of C–C and C–O were non-polar, showing more hydrophobic than the polar function group of C=O.13)Although the shapes of C 1s before and after oxidation were almost the same, more hydroxide than oxide was detected before air oxidation, while more oxide than hydroxide was detected after air oxidation. Almost no Cr0peak was detected after oxidation.
Figure2shows the spectra at different analysis angles () from 15 to 90 with increments of 15. Generally, the
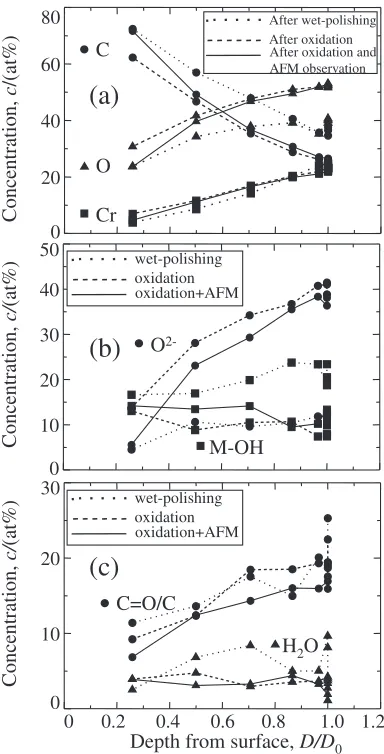
analysis depth in XPS is proportional to the value of sin. The average atomic concentrations of each composition with changing the analysis depth are shown in Fig.3. The atomic sensitive factors (ASF) used for quantitative determination are shown in Table2.D0shows the maximum analysis depth
in case of¼90. More carbons and fewer chromium oxide/
hydroxide were detected as the analysis angle decreased (Fig.
3(a)). More oxide and fewer hydroxides were detected on the specimen after oxidation than before oxidation (Fig. 3(b)). The ratio of hydrophilic C=O to the total carbons decreased with decreasing the analysis depth, indicating mainly arran-ging towards the metal substrate (Fig.3(c)). The solid line shows the result of a specimen after oxidation (same as the broken line), which was further observed with AFM (See Fig.6) in ambient air for 3.6 ks after being taken out of the vacuum of XPS, and again analyzed by XPS. No large difference was found compared to that before AFM observa-tion (the broken line).
A structure near the specimen surface in vacuum can be described as follows. The organic contaminants and a little of water exist on the specimen surface, under which is the layer of chromium oxide/hydroxide on the metal substrate.
3.2 Macro-wetting contact angle measurement
The wetting contact angles of macro-droplets (the hor-izontal radius: approx. 3 mm) of distilled water on the surfaces before and after oxidation, which are obtained from the cross-sectional (projection) morphologies (figures omit-ted), were about 82and 71, respectively. This result might
be attributed to the more contaminants on the surface after oxidation (See Fig.3), based on a report13)that the macro-contact angles became larger with more organic contami-nants adsorbed on the 18Cr–8Ni steel surfaces.
3.3 Micro-wetting morphologies
Figure4 shows surface morphologies of two specimens after being held in 25–30% RH air (desiccators) for 64.8 ks observed by the AC non-contact mode of AFM. Layer-like-domains were present on each surface. The thickness was about 2.2 nm for the wet polished specimen and about 1.7 nm
Fig. 1 Curve resolution of C 1s, O 1s and Cr 2p3=2photo peaks derived from pure chromium after wet polishing (a) and oxidation (b).
Table 1 XPS binding energies for C 1s, O 1s and Cr 2p3=2.
Photo peak C 1s O 1s Cr 2p3=2
Peak C–C C–O C=O O2 M–OH H
2O Cr0 Cr3þ Binding energy 285.0 286.6 288.6 530.3 532.0 533.2 574.2 576.6
(eV)
[image:2.595.104.497.70.328.2] [image:2.595.46.292.729.782.2]for the oxidized one.
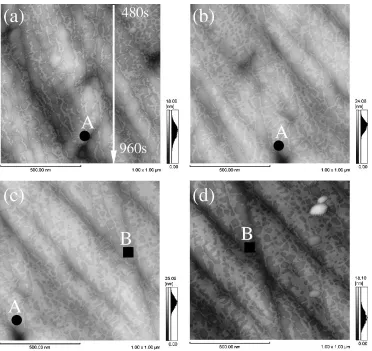
Several confirmations were carried out to investigate the properties of the layer-like-domains in the following. Figure
5(a) shows an immediate observation result (timet¼0ks) for the oxidized surface after XPS analysis (vacuum
<5107MPa). Many layer-like-domains were present on
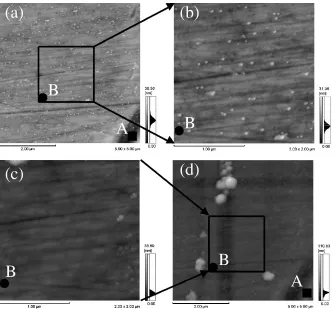
the surface, but they were much smaller than those in Fig. 4. Their amount gradually increased with continual observation in 50–60% R.H. air. The specimen surface chemistry was again analyzed by XPS after the observation (See Fig. 3). Almost no difference in surface compositions was found before and after the AFM observation, indicating that the gradually increasing domains disappeared in the vacuum chamber. The oxidized surface after being held at 50–60% R.H. air for 64.8 ks was scanned with the contact mode of AFM and then observed with the AC non-contact mode. The surfaces before and after the contact mode scanning are shown in Fig.6. The locations of these layer-like-domains changed and their amount decreased after the contact mode scanning. Their amount kept changing with continual observation. According to the above confirmation of the layer-like-domains, (1) the surface compositions almost did not change much before and after AFM observation in air (See Fig.3), (2) the layer-like-domains can be easily moved by the tip of the cantilever and (3) they can be evaporated or condensed in ambient air, this lead to the conclusion that the layer-like-domains are liquid condensed in ambient air.
The wet polished specimen surface after 64.8 ks in the
Fig. 2 The C 1s, O 1s and Cr 2p spectra for pure chromium after wet polishing (a) and oxidation (b) at different take-off angles of XPS.
0 20 40 60 80 0 10 20 30 40 50
0 0.2 0.4 0.6 0.8 1.0 1.2 0 10 20 30 wet-polishing oxidation oxidation+AFM Concentration, c/ (at%) Concentration, c /(at%) Concentration, c/ (at%)
Depth from surface, D/D0
wet-polishing oxidation oxidation+AFM
After wet-polishing After oxidation After oxidation and AFM observation
C=O/C
H2O Cr O C O 2-M-OH
(a)
(b)
(c)
[image:3.595.109.486.71.336.2]Fig. 3 Surface compositions obtained at different analysis angles of XPS (D0is the analysis depth when¼90).
Table 2 Atomic sensitivity factors.
Photo peak C 1s O 1s Cr 2p3=2
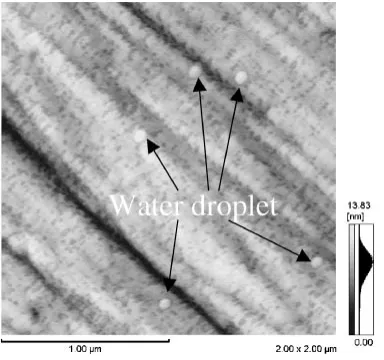
[image:3.595.73.265.379.756.2] [image:3.595.305.549.393.421.2]desiccators, 1.8 ks ultrasonically holding in distilled water then and blasted by air, was observed with the AC non-contact mode of AFM. The result is shown in Fig.7. Many protruding particles were present on the surface (Figs. 7(a) and (b)). They were confirmed to be liquid with the contact mode scanning8–12) (Figs. 7(c) and (d)). Since they are different from the liquid layers observed before, the protruding particles should be the post-wetted micro-droplets of distilled water. Their average height (h) and radius (r)
were about 5 nm and 30 nm, respectively. The obtained micro-wetting angle () was about 19, which was calculated
using the equation ¼tan1ðh=rÞ in our previous
re-ports.9–11)The oxidized surface morphology after processing similarly to that in Fig. 7, is shown in Fig.8. The average height, radius and contact angle of micro-droplets of distilled water wereh;3:5nm,r;40nm and;10, respectively.
The result of the micro-contact angles of micro-droplets of water on pure chromium surfaces much lower than those of
Fig. 4 Surface morphologies of wet polished (a) and oxidized (b) pure chromium after keeping in desiccators (25–30%RH,2933K) for 64.8 ks.
Fig. 5 The surface changes of oxidized specimen after XPS analysis ((a)t¼960s, (b) 2.0 ks, (c) 3.0 ks and (d) 3.6 ks).
[image:4.595.116.487.72.242.2] [image:4.595.114.486.290.641.2]Fig. 6 The surface changes on oxidized pure chromium ((a) after keeping in desiccators (25–30%RH,2933K) for 64.8 ks (t¼720s), (b) after contact mode scanning (1.2 ks), (c) after 10.8 ks and (d) after 13.8 ks).
[image:5.595.132.467.70.379.2] [image:5.595.133.468.447.759.2]macro-droplets, corresponded well to previous reports.8–12) Figure9 shows the magnified surface morphologies around the micro-droplets of distilled water. Liquid layers were present around the water droplet but were not combined with each other, indicating the surface composition of the liquid layers was not the same as the distilled water. Accordingly, the hydrophobic organic contaminants might exist on the top surface of the liquid layer. It is also clear that the liquid layers cannot be entirely removed even ultrasoni-cally cleaned in distilled water, and the micro-droplets of water always occupy places with little or no liquid layer. Therefore, these places occupied with water droplets should be more hydrophilic than the liquid layer surface.
Generally, the water vapor and organic contaminants in ambient air compete to be adsorbed on materials surfaces.14) As a result, they co-exist on the surface to form the liquid layers. If the structure of the liquid layer can be separated to two layers, its top layer should be the hydrophobic organic contaminants, and the inner layer should be the adsorbed
water. When the specimen with liquid layers was taken into the vacuum environment, most of the water (including small amount of organic contaminants) evaporated and only the organic contaminants remained. When the specimen was again taken out of the vacuum environment into the ambient air environment, the water vapor in the air was adsorbed on the specimen surface again and penetrated beneath the organic contaminants layer because the substrate surface was more hydrophilic than the organic contaminants layer sur-face. The above results corresponded well to the thickness (approx. 2 nm) of adsorbed water film measured with the ellipsometry method on the pure chromium surface in ambient air with relative humidity from 15%RH to 95%.14)
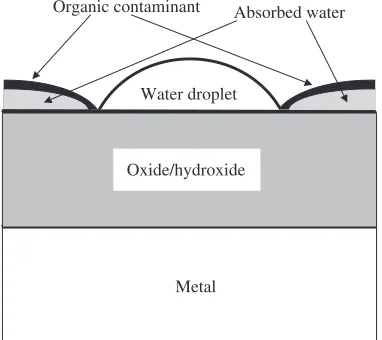
If the affinity between the water and the organic con-taminants is assumed to be lower than that between the water and the substrate surface (chromium oxide/hydroxide), the places with little or no liquid layers should be more hydrophilic than those with much liquid layers. Moreover, the liquid layer surface shows hydrophobic since the hydrophobic function groups of C–C and C–O were arranged towards the air. As a result, the post-wetted micro-droplets of distilled water always occupy places with little or no liquid layers. Compared to the macro-wetting contact angle, which is largely influenced by the existence of hydrophobic organic contaminants,13)the micro-wetting contact angle was direct-ly influenced by the hydrophilic chromium oxide/hydroxide. Of course, the obtained micro-wetting contact angles were much lower that the macro-droplets. The above explanations also indicated that the water wettability of the chromium oxide was higher than that of the chromium hydroxide by comparing micro-wetting contact angles. The schematic surface composition and wetting behavior of micro-droplets of distilled water are shown in Fig.10.
Fig. 8 Surface morphology of the oxidized specimen after ultrasonically keeping in distilled water.
Fig. 9 The enlarged water droplets on wet polished (a) and oxidized (b) specimen surfaces after ultrasonically keeping in distilled water.
[image:6.595.75.267.72.252.2] [image:6.595.116.487.564.733.2]4. Conclusions
The surface compositions of wet polished and air oxidized pure chromium and their wetting morphologies by micro-droplets of water, were investigated by X-ray photoelectron spectroscopy (XPS) and atomic force microscope (AFM). The obtained conclusions are as follows.
(1) An organic contaminants/water layer on the chromium oxide/hydroxide layer, was detected by XPS analysis for each surface. The oxide/hydroxide layer became thicker, and theoxide : hydroxideratio became large, after air oxidation.
1) I. Muto: Materia Japan38(1999) 791–797.
2) T. Ozaki and Y. Ishikawa: Corrosion Engineering49(2000) 641–648. 3) T. Handa and Y. Miyata: Corrosion Engineering49(2000) 649–654. 4) T. Yamauchi and N. Kawamura: Matsushita Electric Works Technical
Report Nov. (2000) 34–38.
5) H. Masuda: J. Japan Inst. Metals62(1998) 173–180. 6) H. Masuda: J. Japan Inst. Metals62(1998) 140–144.
7) J. Hu, X. D. Xiao and M. Salmeron: Appl. Phys. Lett.67(1995) 476– 478.
8) R. Wang, M. Takeda, K. Mukai and M. Kido: J. Japan Inst. Metals65
(2001) 1066–1074.
9) R. Wang, M. Takeda and M. Kido: Scr. Mater.46(2001) 83–87. 10) R. Wang, M. Takeda and M. Kido: Mater. Lett.54(2002) 140–144. 11) R. Wang, M. Takeda and M. Kido: J. Japan Inst. Metals66(2002) 506–
512.
12) R. Wang, N. Morihiro, T. Tokuda and M. Kido: J. Japan Inst. Metals66
(2002) 805–815.
13) M. Mantel and J. P. Wightman: Surface and Interface Analysis 21
(1994) 595–605.
[image:7.595.74.265.75.245.2]14) T. Doi, M. Yamashita and H. Nagano: J. Japan Inst. Metals62(1998) 64–70.