Soil hydraulic properties are needed as input data to describe and simulate the transport of water and solutes in the soil profile. Two main soil hydraulic properties, being commonly considered as soil’s fingerprints, are:
1. Soil-moisture retention curve (SMRC), which represents the amount of water remaining in the soil at equilibrium, expressed in terms of soil water content θ as a function of the soil water pressure head h (Hillel 1998, p. 155). The decadic logarithm of h, if h is expressed in centimeters,
is usually denoted as pF and the relation θ(pF) is referred to as a pF curve.
2. Saturated hydraulic conductivity K and the unsaturated hydraulic conductivity k as a func-tion of the soil water content or pressure head,
k(θ) or k(h).
The shape of SMRC is unique for each soil. It can be determined by direct measurements and is related to many other soil properties. The measure-ment procedures are time consuming and laborious and, quite often, SMRC is not a part of the standard
Pedotransfer function application for estimation
of soil hydrophysical properties using parametric methods
S. Matula, K. Špongrová
Faculty of Agrobiology, Food and Natural Resources, Czech University of Life Sciences
Prague, Czech Republic
ABSTRACT
Soil hydraulic properties are needed as input data to describe and simulate the transport of water and solutes in the soil profile. The most important characteristics are the soil moisture retention curve (SMRC)θ(h) and the hydraulic
conductivity function k(θ) or k(h), where θ is the soil moisture content, h is the pressure head and k is the
hydrau-lic conductivity. SMRC represents the amount of water remaining in the soil under equilibrium conditions and is unique for each soil. The measurement of SMRC is laborious and time-consuming and so there are not enough data available sometimes. Various SMRC estimation models have been proposed and used extensively to overcome this problem. Other more easily available soil properties, such as particle size distribution, organic matter content, soil structure and bulk density, were used for the estimation of SMRC. Bouma and van Lanen (1987) called these models “transfer functions”, and later on they were called “pedotransfer functions”. This study is based on European works by Wösten et al. (1998, 1999), and others. The pedotransfer functions derived by Wösten et al. (1998) were used in the first part of the study. In the second part, the authors derived their own pedotransfer functions for the sites where all necessary data were available. The methodology of data processing was similar to that used by Wös-ten et al. (1998) for continuous pedotransfer functions. The use of continuous pedotransfer functions was tested on data sets from several sites in the Czech Republic (Cerhovice, Černičí, Brozany, Ovesná Lhota, Tupadly, Džbánov, Podlesí and Žichlínek). Unfortunately, the available Czech data sets are not as large as the data sets used in Wösten’s work. Quite good new estimates of SMRC (expressed as pF curves) were found e.g. for the Cerhovice and Černičí sites; the estimates for a man-made soil profile in Brozany and for natural soils in Ovesná Lhota, Tupadly, Džbánov, Podlesí and Žichlínek were less successful, partly because of insufficient input data. The applications of continuous pedotransfer functions derived by Wösten et al. (1998) for the Czech data sets were not very successful, either. The quality and size of the input data sets are critical factors for a successful use of pedotransfer functions.
Keywords: soil moisture retention curve; pedotransfer function; multiple linear regressions; parametric method
soil survey. Hence, various models to estimate SMRC have been proposed and extensively used. Other, more easily determinable and available soil properties, such as the particle-size distribution, organic matter content, soil structure descriptors and soil bulk density, were used for this purpose. Bouma and van Lanen (1987) called these models pedotransfer functions (PTF’s).
Cornelis et al. (2001) divided PTF’s into three groups:
Group 1 – estimation of soil water contents at particular suction head values by multiple linear regression (Gupta and Larson 1979, Rawls and Brakensiek 1982, Saxton et al. 1986) and/or us-ing artificial neural networks (Pachepsky et al. 1996).
Group 2 – predicting the parameters of closed-form analytical equations, like those by Brooks and Corey (1964) (done by Rawls and Brakensiek 1985), or van Genuchten (1980). This is again achieved by multiple linear regression (Vereecken et al. 1989, Scheinost et al. 1997, Wösten et al. 1998, Minasny et al. 1999, Wösten et al. 1999) or artificial neural networks (Pachepsky et al. 1996, Schaap et al. 1998a, b, 1999, Minasny et al. 1999).
Group 3 – based on a physical-conceptual model of water retention phenomena (Arya and Paris 1981, Haverkamp and Parlange 1986) or on the use of fractal mathematics and scaled similarities (Tyler and Wheatcraft 1989, Comegna et al. 1998).
An evaluation of applicability and prediction accuracy of some most common PTF’s which use other soil properties, like particle size distribution (contents of clay, sand and silt), organic matter or organic carbon content and dry bulk density as estimators, was done by Cornelis et al. (2001).
Commonly, either the regression or the artificial neural networks have been used to find the pa-rameters of pedotransfer functions (PTF’s). These methods can be called parametric. In some new applications, nonparametric methods have been successfully used. These techniques do not use any predefined mathematical functions. They work with similarities instead of fitting equations to data. Nemes et al. (2006) introduced a relatively simple form of nonparametric lazy learning algorithm, called k-Nearest Neighbor algorithm (k-NN), to estimate soil hydraulic properties, and compared the results with a neural network model.
If the soil properties to be estimated (e.g. SMRC parameters) appear in PTF’s as continuous func-tions of the other soil properties, the PTF’s are referred to as continuous.
This preliminary study is focused on SMRC and the possibility of using parametric PTF’s belonging to group 2, especially those based on the works by Wösten et al. (1998), Wösten et al. (1999), and other European authors. The PTF technique is applied to selected soils from different regions of the Czech Republic. An attempt has been made to derive new pedotransfer functions for these soils and regions.
MATERIAL AND METHODS
Available data sets from several sites (Brozany, Černičí, Cerhovice, Ovesná Lhota, Tupadly, Džbánov, Podlesí and Žichlínek) were tested in this work. Basic information about these sites is summarized in Tables 1 and 2.
The continuous pedotransfer functions of Wösten et al. (1998) were used to determine the param-eters of the closed-form analytical van Genuchten equation:
h < 0 (1)
where:
θ(h) = soil water content as a function of pressure head h θr = residual soil water content – a parameter
θs = saturated soil water content – a parameter α, n = empirical parameters
In the parameterization procedure the residual soil water content θr was initially set to 0.01 and
than later changed if measured data suggested oth-erwise, following the line of Wösten et al. (1998). The existing regression equations for individual parameters of the van Genuchten equation (θs, α*, n*), as determined by Wösten et al. (1998), are
listed in Table 3. The R2 values in Table 3 refer to multiple correlation between the other soil prop-erties (independent variables) and the parameters
θs, α* and n* to be estimated. Let us note that the
lowest R2 was obtained for α*.
Firstly, the measured data points θ(h) for
indi-vidual retention curves were parameterized, using the RETC computer program (van Genuchten et al. 1991) to obtain the fitted parameters θs, α, and n.
Secondly, the continuous pedotransfer functions of Wösten et al. (1998), as given in Table 3, were used to estimate SMRC parameters for each site. Thirdly, our own continuous pedotransfer func-tions were derived, using the data from all sites. The technique of derivation was similar to that used by Wösten et al. (1998). The input data for
� �
�
�
� �
n n r s r hh 1 1
1� �
Table 1. Basic information about the sites and soils studied – part I
Site Nearest town altitude Mean (m a.s.l.)
Dominant soil types (FAO/ISRIC classification)
Organic matter content (%)
USDA textural triangle
Cerhovice Hořovice 425 Fluvi-eutric Gleysol 1.44 silty clay loam, silt loam, silty clay, clay loam
Tupadly Štětí (Mělník) 256 Orthic Luvisol 0.22–1.73 silty clay loam, silty clay, clay
Brozany Pardubice 217
Artificial soil profile, man-made, compacted and left for 3 years of consolidation,
Eutric Fluvisol
1.30–1.90 sandy loamsand,
Černičí Čechtice (Vlašim) 510 Dystric Cambisol 2.20 sandy loam
Ovesná
Lhota Světlá nad Sázavou (Havlíčkův Brod) 528 Stagnogleyic Cambisol na sandy loam, loam
Džbánov Ústí nad Orlicí 308 Orthic Luvisol na silt loam
Podlesí Ústí nad Orlicí 380 Stagnogleyic Luvisol na silt loam
Žichlínek Ústí nad Orlicí 390 Albo-gleyic Luvisol na silty clay loamsilt loam,
na = data not available
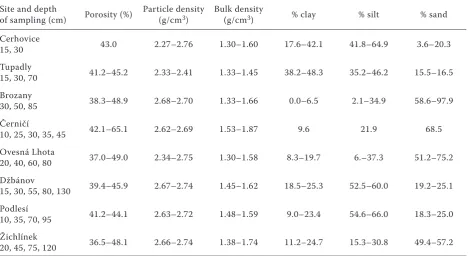
Table 2. Basic information about the sites and soils studied – part II
Site and depth
of sampling (cm) Porosity (%) Particle density (g/cm3) Bulk density (g/cm3) % clay % silt % sand
Cerhovice
15, 30 43.0 2.27–2.76 1.30–1.60 17.6–42.1 41.8–64.9 3.6–20.3
Tupadly
15, 30, 70 41.2–45.2 2.33–2.41 1.33–1.45 38.2–48.3 35.2–46.2 15.5–16.5 Brozany
30, 50, 85 38.3–48.9 2.68–2.70 1.33–1.66 0.0–6.5 2.1–34.9 58.6–97.9 Černičí
10, 25, 30, 35, 45 42.1–65.1 2.62–2.69 1.53–1.87 9.6 21.9 68.5 Ovesná Lhota
20, 40, 60, 80 37.0–49.0 2.34–2.75 1.30–1.58 8.3–19.7 6.–37.3 51.2–75.2 Džbánov
15, 30, 55, 80, 130 39.4–45.9 2.67–2.74 1.45–1.62 18.5–25.3 52.5–60.0 19.2–25.1 Podlesí
10, 35, 70, 95 41.2–44.1 2.63–2.72 1.48–1.59 9.0–23.4 54.6–66.0 18.3–25.0 Žichlínek
[image:3.595.65.537.506.762.2]our own pedotransfer functions were the particle-size distribution (percentage of sand, silt, and clay), organic matter content, dry bulk density and a qualitative parameter equal to 1 for topsoil and 0 for subsoil. The original particle-size dis-tribution data (expressed in terms of particle size categories currently used in the Czech Republic) were converted to the FAO/USDA categories. The coefficients of these functions were obtained by multiple regression (using the program Statistica CZ), relating these input data to the individually fitted parameters θs, α*, and n*. Fourthly, for the
sites where there were enough measured retention data (Brozany, Cerhovice, Černičí and Ovesná Lhota), particular pedotransfer functions were derived in the same manner.
The quality of newly estimated retention curves was evaluated using the R2 coefficient for correla-tion between the measured and the estimated soil
water content at several pF values, as in Wösten et al. (1998), and RMSD (Root of the Mean Squared Difference). Table 4 presents, for comparison, the RMSD values for large data sets published by Tietje and Tapkenhinrichs (1993). The R2 coef-ficients for correlation between the individually derived and the globally fitted parameters θs, α, and n were also calculated. In addition, all
pF curves were plotted into graphs for a visual comparison.
RESULTS AND DISCUSSION
The measured SMRC, expressed as pF curves, and their individually parameterized counterparts corresponded very well to one another, except for the Brozany site and for the points nearest to saturation. This is documented not only by high
R2 and low RMSD values in Table 6, but also by a visual comparison of the curves (an example for the Cerhovice site is given in Figure 1). Hence, the van Genuchten equation (1) is reasonably suitable for expressing the retention curves of many Czech soils and the RETC software used (van Genuchten et al. 1991) works well with these soils.
On the other hand, the application of pedotrans-fer functions by Wösten et al. (1998) to our data was not very successful. RMSD in more success-ful cases ranged between 0.0591 and 0.0790, but in other cases RMSD values between 0.1113 and 0.2391 were found (see Table 6, column “Obs. vs. Wösten” for RMSD).
The pedotransfer functions for θs, α* and n*,
newly derived from the data of all sites taken
to-Table 3. Continuous pedotransfer functions according to Wösten et al. (1998)
Equations for model parameters of van Genuchten’s equations R2 (%)
θs = 0.7919 + 0.001691 × C – 0.29619 × D – 0.000001491 × S2 + 0.0000821 × OM2
+ 0.02427 × C–1 + 0.01113 × S–1 + 0.01472 × ln(S) – 0.0000733 × OM × C
– 0.000619 × D × C – 0.001183 × D × OM – 0.0001664 × topsoil × S 76 α* = –14.96 + 0.03135 × C + 0.0351 × S + 0.646 × OM + 15.29 × D – 0.192 × topsoil
– 4.671 × D2 – 0.000781 × C2 – 0.00687 × OM2 + 0.0449 × OM–1 + 0.0663 × ln(S) + 0.1482 × ln(OM)
– 0.04546 × D × S – 0.4852 × D × OM + 0.00673 × topsoil × C 20
n* = –25.23 – 0.02195 × C + 0.0074 × S – 0.1940 × OM + 45.5 × D – 7.24 × D2 + 0.0003658 × C2 + 0.002885 × OM
– 12.81 × D–1 – 0.1524 × S–1 – 0.01958 × OM–1 – 0.2876 × ln(S) – 0.0709 × ln(OM) – 44.6 × ln(D)
– 0.02264 × D × C + 0.0896 × D × OM + 0.00718 × topsoil × C 54
θs = saturated soil water content – a parameter; α*, n* = transformed model parameters:α* = lna,n* = ln(n – 1);
C = % clay (0–2 µm); S = % silt (2–50 µm); OM = % organic matter; D = dry bulk density (= ρd) (Mg/m3 or g/cm3); topsoil = a qualitative parameter (1 for topsoil, 0 for subsoil); ln = natural logarithm
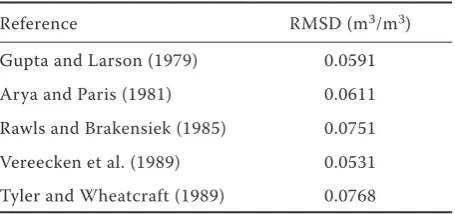
Table 4. Results of evaluation of different pedotransfer functions for SMRC estimation based on large data sets (Tietje and Tapkenhinrichs 1993)
Reference RMSD (m3/m3)
Gupta and Larson (1979) 0.0591 Arya and Paris (1981) 0.0611 Rawls and Brakensiek (1985) 0.0751 Vereecken et al. (1989) 0.0531 Tyler and Wheatcraft (1989) 0.0768
[image:4.595.64.292.610.717.2]gether (see Table 5), did not fit the observed curves very well. An acceptably good fit was obtained for Cerhovice, Džbánov, Podlesí and Žichlínek (RMSD ranged between 0.0591 and 0.0790), but the RMSD values for Brozany, Černičí, Ovesná Lhota and Tupadly lay between 0.1113 and 0.3143, which indicates a very poor agreement with the observed data. The R2 values in Table 5 refer to multiple correlation between the other soil proper-ties (independent variables) and the parameters θs, α* and n* to be estimated. In contrary to Table 3,
it is now mainly the saturated soil water content θs
for which the R2 value is extremely low, indicating a poor correlation.
Particular pedotransfer functions were derived for Brozany, Cerhovice, Černičí and Ovesná Lhota. The estimates for Cerhovice and Černičí were successful, RMSD being 0.0519 and 0.0451, re-spectively (see Table 6), which is less than the values obtained for large data sets by Tietje and Tapkenhinrichs (1993), with PTF’s according to Vereecken et al. (1989), Rawls and Brakensiek (1985), and other authors (Table 4). On the other hand, RMSD for Brozany and Ovesná Lhota were 0.3874 and 0.2149, respectively, which indicates that even the site-specific PTF’s do not explain the
data well enough. In the case of Brozany, we can even say that the van Genuchten equation per se does not fit the measured retention curves at all, as indicated by the high value of RMSD for the correlation between the measured and individually fitted soil water contents (0.3397). In this context, it has to be mentioned that Brozany soil profile is a man-made soil profile in a giant lysimeter, compacted and left for three years to consolidate before the sampling. In the case of Ovesná Lhota, a partial explanation of the failure may be that the available data set is rather old and incomplete.
To assess the quality of the estimated curves,
R2 coefficients for correlation between the param-eters θs, α and n derived for each soil sample from
site-specific PTF’s and those obtained by fitting each curve individually (using RETC) are given in Table 7. The very low values of R2 (except for Černičí) show that the fit was not very good.
[image:5.595.63.530.58.176.2]When judging various methods of quantify-ing the adequacy and accuracy of the estimated retention curves, RMSD for correlation between the measured and estimated soil water contents at several different pF values seems to be the best option. This opinion of the authors is supported by Kobayashi and Us Salam (2000), who prefer
Figure 1. Comparison of observed and fitted (using RETC software) pF curves (the measured points are indi-cated in both graphs)
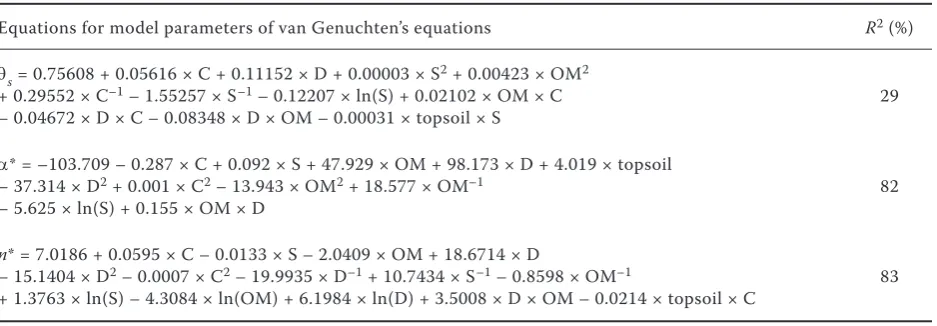
Table 5. Newly derived continuous pedotransfer functions (for all sites together)
Equations for model parameters of van Genuchten’s equations R2 (%)
θs = 0.75608 + 0.05616 × C + 0.11152 × D + 0.00003 × S2 + 0.00423 × OM2
+ 0.29552 × C–1 – 1.55257 × S–1 – 0.12207 × ln(S) + 0.02102 × OM × C
– 0.04672 × D × C – 0.08348 × D × OM – 0.00031 × topsoil × S 29
α* = –103.709 – 0.287 × C + 0.092 × S + 47.929 × OM + 98.173 × D + 4.019 × topsoil – 37.314 × D2 + 0.001 × C2 – 13.943 × OM2 + 18.577 × OM–1
– 5.625 × ln(S) + 0.155 × OM × D 82
n* = 7.0186 + 0.0595 × C – 0.0133 × S – 2.0409 × OM + 18.6714 × D
– 15.1404 × D2 – 0.0007 × C2 – 19.9935 × D–1 + 10.7434 × S–1 – 0.8598 × OM–1
+ 1.3763 × ln(S) – 4.3084 × ln(OM) + 6.1984 × ln(D) + 3.5008 × D × OM – 0.0214 × topsoil × C 83
0.0 0.1 0.2 0.3 0.4 0.5
0.0 0.5 1.0 1.5 2.0 2.5 3.0 3.5 4.0 4.5
0.0 0.1 0.2 0.3 0.4 0.5
0.0 0.5 1.0 1.5 2.0 2.5 3.0 3.5 4.0 4.5
log h
Cerhovice – pF curves (measured data) Cerhovice – pF curves (fitted data by RETC and measured points)
[image:5.595.65.534.602.765.2]the RMSD evaluation to the squared correlation coefficients (R2) for quantifying the accuracy of the estimated data.
For a visual comparison, graphs of concomitant pF curves were plotted. Examples for Cerhovice and Černičí are depicted in Figures 2 and 3. Each figure is composed of four graphs as follows: A) Individually fitted pF curves for particular soil
samples (output of RETC);
B) PTF-estimated pF curves using the equations by Wösten et al. (1998);
C) PTF-estimated pF curves using newly derived PTF’s for particular sites;
D) Comparison of pF curves A), B) and C) for a single selected soil sample.
The use of continuous parametric PTF’s was tested on data from eight different sites in the Czech Republic. Unfortunately, the data sets were not large enough for an extensive study similar to the work by Wösten et al. (1998). No large data sets are presently available for the Czech Republic, because the Comprehensive Soil Survey database does not include virtually any retention curves, and the other data sources are scarce and difficult to identify. Therefore, a preliminary study was under-taken at the beginning of a more systematic effort in order to acquire experience with the continuous PTF’s and their application to Czech data.
In general, the application of the original pedo-transfer functions by Wösten et al. (1998), was not very successful. The most favorable values of RMSD ranged between 0.0591 and 0.0790, which corresponds with the results by Tietje and Tapkenhinrichs (1993). In other cases, however, the values of RMSD were much higher (see Table 6, column “Obs. vs. Wösten” for RMSD).
The newly derived pedotransfer functions, based on the data from all sites taken together and provid-ing a rough estimate of the retention curve parame-ters θs, α* and n*, are presented in Table 5. Generally,
[image:6.595.63.537.79.282.2]theydid not fit the observed retention curves very well. For some sites (Cerhovice, Džbánov, Podlesí and Žichlínek), the estimated curves corresponded quite well to the measured ones (RMSD ranging
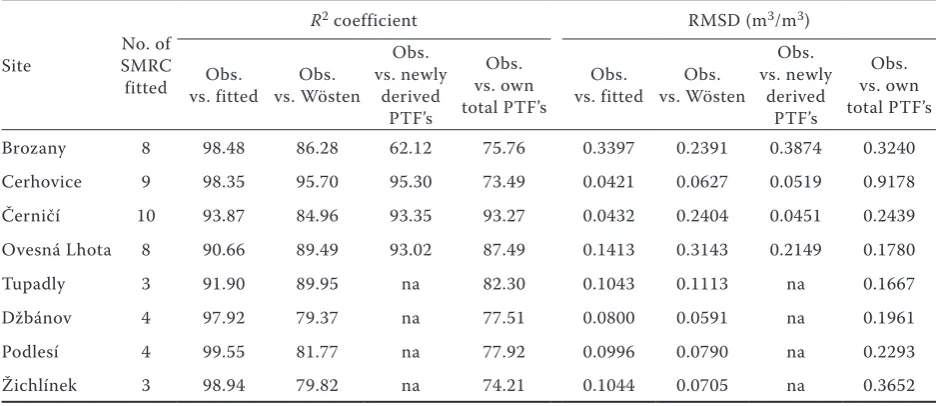
Table 6. Goodness-of-fit indicators (R2 and RMSD) for different cases
Site SMRC No. of fitted
R2 coefficient RMSD (m3/m3)
Obs.
vs. fitted vs. Wösten Obs.
Obs. vs. newly
derived PTF’s
Obs. vs. own total PTF’s
Obs.
vs. fitted vs. Wösten Obs.
Obs. vs. newly
derived PTF’s
Obs. vs. own total PTF’s
Brozany 8 98.48 86.28 62.12 75.76 0.3397 0.2391 0.3874 0.3240
Cerhovice 9 98.35 95.70 95.30 73.49 0.0421 0.0627 0.0519 0.9178
Černičí 10 93.87 84.96 93.35 93.27 0.0432 0.2404 0.0451 0.2439
Ovesná Lhota 8 90.66 89.49 93.02 87.49 0.1413 0.3143 0.2149 0.1780
Tupadly 3 91.90 89.95 na 82.30 0.1043 0.1113 na 0.1667
Džbánov 4 97.92 79.37 na 77.51 0.0800 0.0591 na 0.1961
Podlesí 4 99.55 81.77 na 77.92 0.0996 0.0790 na 0.2293
Žichlínek 3 98.94 79.82 na 74.21 0.1044 0.0705 na 0.3652
[image:6.595.63.291.538.762.2]na = not applicable due to the lack of input data
Table 7. R2 coefficients for the correlation between parameters θs, α, and n derived by multiple regressions
for particular sites and those obtained by fitting each curve individually
Site Parameter R2 coefficient (%)
Cerhovice
θs 22.80
α 14.60
n 16.17
Černičí
θs 70.85
α 30.77
n 70.35
Brozany
θs 7.20
α 7.64
n 1.72
Ovesná Lhota
θs 11.43
α 22.02
Figure 2. Cerhovice site – graphs of A) individually measured and fitted (using RETC) pF curves, B) pF curves derived from PTF’s according to Wösten et al. (1998), C) pF curves from newly derived site-specific PTF’s, D) comparison of A), B) and C) for a selected soil sample
log h
Fitted Wösten
log h θ
Curves from the top right side: ce33, ce263, ce573, ce540, ce18, ce509, ce532, ce25, ce270
θ
A) B)
Curves from the top right side: ce263, ce540, ce532, ce33, ce25, ce509, ce573, ce18, ce270
log h
log h
Own solution ce33 – comparison
Curves from the top right side: fitted, Wösten, own solution
θ θ
C) D)
Curves from the top right side: ce573, ce263, ce33, ce540, ce532, ce270, ce18, ce509, ce25
Figure 3. Černičí site – graphs of A) individually measured and fitted (using RETC) pF curves, B) pF curves derived from PTF’s according to Wösten et al. (1998), C) pF curves from newly derived site-specific PTF’s, D) comparison of A), B) and C) for a selected soil sample
Own solution c45bv4 – comparison
Curves from the top right side: own solution, fitted, Wösten log h
log h θ
θ C) θ D)
Curves from the top left side:
c45V1, c10AV4, c10BV4, c30AV4, c30BV4, c35V1, c45BV4, c45AV4, c25AV1, c25BV1
Fitted Wösten
log h
log h θ
A) B)
Curves from the top left side:
c45V1, c10BV4, c10AV4, c25AV1, c45BV4, c25BV1, c30AV4, c45AV4, c35V1, c30BV4 Curves from the top right side:
[image:7.595.66.534.426.703.2]between 0.0591 and 0.0790), but for the rest of the sites (Brozany, Černičí, Ovesná Lhota and Tupadly) the RMSD values were very high, which indicates poor agreement with the observed data.
For Brozany, Cerhovice, Černičí and Ovesná Lhota, site-specific pedotransfer functions were derived. The estimates for Cerhovice and Černičí were reasonably successful, RMSD being 0.0519 and 0.0451, respectively (Table 6), while for Brozany and Ovesná Lhota the RMSD values were very high. The Brozany soil, an artificial soil profile, is specific and its retention curves are difficult to reconcile with the van Genuchten’s equation (1).
In general, the pedotransfer functions can be a useful tool to estimate the SMRC, but at least some SMRC have to be precisely measured for each soil type in order to derive a reliable SMRC. The use of PTF’s in highly heterogeneous and man-made soils is disputable. The limiting and critical factors for deriving good PTF’s are the quality and size of the input data sets.
Acknowledgements
The authors would like to thank the following colleagues from the Research Institute for Soil and Water Conservation, Prague, for making their data sets available: Dr. H. Damašková (Tupadly, Džbánov, Podlesí, Žichlínek and Ovesná Lhota), Dr. M. Soukup (Cerhovice), Dr. Z. Kulhavý (Brozany and Černičí). Authors thank to the anonymous reviewer for his helpful comments and suggestions about the manuscript.
REFERENCES
Arya L.M., Paris J.F. (1981): A physico-empirical model to predict the soil moisture characteristic from par-ticle-size distribution and bulk density data. Soil Sci. Soc. Am. J., 45: 1023–1030.
Bouma J., van Lanen J.A.J. (1987): Transfer functions and threshold values: From soil characteristics to land qualities. In: Beek K.J., Burrough P.A., McCormack D.E. (eds.): Proc. Int. Workshop Guality land evalu-ation. ISSS and SSSA, Washington, DC, ITC Publ. No. 6. Enschede, The Netherlands.
Brooks R.H., Corey A.T. (1964): Hydraulic properties of porous media. Hydrol. Pap., 3, Colorado State University, Fort Collins, Co.
Comegna V., Damiani P., Somella A. (1998): Use of a fractal model for determining soil water retention curves. Geoderma, 85: 307–323.
Cornelis W.M., Ronsyn J., Van Meirvenne M., Hart-mann R. (2001): Evaluation of pedotransfer functions for predicting the soil moisture retention curve. Soil Sci. Soc. Am. J., 65: 638–648.
Gupta S.C., Larson W.E. (1979): Estimating soil water retention characteristics from particle size distribu-tion, organic matter percent and bulk density. Water Resour. Res., 15: 1633–1635.
Haverkamp R., Parlange J.Y. (1986): Predicting the soil water retention curve from particle-size distribution: 1. Sandy soils without organic matter. Soil Sci., 142: 325–339.
Hillel D. (1998): Environmental Soil Physics. Academic Press, London.
Kobayashi K., Us Salam M. (2000): Comparing simulated and measured values using mean squared deviation and its components. Agron. J., 92: 345–352.
Minasny B., McBratney A.B., Bristow K.L. (1999): Com-parison of different approaches to the development of pedotransfer functions for water retention curves. Geoderma, 93: 225–253.
Nemes A., Rawls W.J., Pachepsky Y.A. (2006): Use of the nonparametric nearest neighbor approach to es-timate soil hydraulic properties. Soil Sci. Soc. Am. J.,
70: 327–336.
Pachepsky Y.A., Timlin D., Varallyay G. (1996): Artifi-cial neural networks to estimate soil water retention from easily measurable data. Soil Sci. Soc. Am. J.,
60: 727–733.
Rawls W.J., Brakensiek D.L. (1982): Estimating soil water retention from soil properties. J. Irrig. Drain. Div. ASCE, 108: 166–171.
Rawls W.J., Brakensiek D.L. (1985): Prediction of soil water properties for hydrologic modelling. In: Jones E., Ward T.J. (eds.): Watershed Management in the Eighties. Proc. Symp. Irrig. Drain. Div. ASCE. Denver, CO. ASCE, New York.
Saxton K.E., Rawls W.J., Romberger J.S., Papendick R.I. (1986): Estimating generalized soil-water char-acteristics from texture. Soil Sci. Soc. Am. J., 50: 1031–1036.
Schaap M.G., Leij F.J., Van Genuchten M.Th. (1998a): Neural network analysis for hierarchical prediction of soil hydraulic properties. Soil Sci. Soc. Am. J., 62: 847–855.
Schaap M.G., Leij F.J., Van Genuchten M.Th. (1998b): Using neural networks to predict soil water reten-tion and soil hydraulic conductivity. Soil Till. Res.,
47: 37–452.
unsatu-rated porous media. Univ. California, Riverside, CA: 1237–1250.
Scheinost A.C., Sinowski W., Auerswald K. (1997): Re-gionalization of soil water retention curves in a highly variable soilscape: I. Developing a new pedotransfer function. Geoderma, 78: 1997, 129–143.
Tietje O., Tapkenhinrichs M. (1993): Evaluation of pedotransfer functions. Soil Sci. Soc. Am. J., 57: 1088–1095.
Tyler S.W., Wheatcraft S.W. (1989): Application of fractal mathematics to soil water retention estima-tion. Soil Sci. Soc. Am. J., 53: 987–996.
Van Genuchten M.Th. (1980): A closed – form equation for predicting the hydraulic conductivity of unsatu-rated soils. Soil Sci. Soc. Am. J., 44: 892–898.
Van Genuchten M.Th., Leij F.J., Yates S.R. (1991): The RETC code for quantifying the hydraulic functions of unsaturated soils. US Environ. Protec. Ag. Vereecken H., Maes J., Feyen J., Darius P. (1989):
Es-timating the soil moisture retention characteristic from texture, bulk density, and carbon content. Soil Sci., 148: 389–403.
Wösten J.H.M., Lilly A., Nemes A., Le Bas C. (1998): Using existing soil data to derive hydraulic param-eters for simulation models in environmental stud-ies and in land use planning, Final Rep. Eur. Un., Wageningen.
Wösten J.H.M., Lilly A., Nemes A., Le Bas C. (1999): Development and use of a database of hydraulic prop-erties of European soils. Geoderma, 90: 169–185.
Received on November 16, 2006
Corresponding author:
Prof. Ing. Svatopluk Matula, CSc., Česká zemědělská univerzita v Praze, Fakulta agrobiologie, potravinových a přírodních zdrojů, 165 21 Praha 6-Suchdol, Česká republika