RESEARCH SERIES NUMBER 12 OCTOBER 2009
B
UDGET
P
ERSPECTIVES
2010
Tim Callan (ed.)
Alan Barrett, Jean Goggin,
Paul K. Gorecki,
Claire Keane, Ide Kearney,
Alan Matthews,
John R. Walsh
Copies of this paper may be obtained from The Economic and Social Research Institute (Limited Company No. 18269).
Registered Office: Whitaker Square, Sir John Rogerson’s Quay, Dublin 2.
Tim Callan, Alan Barrett, Paul K. Gorecki are Research Professors, Ide Kearney is Associate Professor, John R. Walsh is Senior Research Analyst, Jean Goggin and Claire Keane are Research Assistants at the Economic and Social Research Institute (ESRI). Alan Matthews is Professor in the Department of Economics and Director of the Institute for International Integration Studies, Trinity College Dublin.
RESEARCH SERIES NUMBER 12 OCTOBER 2009
B
UDGET
P
ERSPECTIVES
2010
Tim Callan (ed.)
Alan Barrett, Jean Goggin,
Paul K. Gorecki,
Claire Keane, Ide Kearney,
Alan Matthews,
John R. Walsh
© THE ECONOMIC AND SOCIAL RESEARCH INSTITUTE DUBLIN, 2009
Thanks are due to the referees, from both inside and outside the ESRI, for comments which have helped to improve the papers included in this volume. Thanks are also due to Donal de Buitléir, Chair of the FFS Projects Committee, and to Frances Ruane, for their valuable inputs into the planning of the conference.
Conference organisation was handled with their customary skill and efficiency by Patricia Byrne and Mary Dowling. All authors, and particularly the editor, thank Mary Cleary, Regina Moore and Deirdre Whitaker for their excellent work in preparing the volume for publication under severe time constraints.
CONTENTS
Page
Acknowledgements iv
INTRODUCTION
Frances Ruane 1
Chapter
1. TAX REFORM: SELECTED ISSUES
Tim Callan, Claire Keane, John R. Walsh 3
2. THE RECESSION, BUDGETS, COMPETITION, AND REGULATION: SHOULD THE STATE SUPPLY BESPOKE PROTECTION?
Paul K. Gorecki 19
3. THE FUTURE OF THE EU BUDGET: IRISH PERSPECTIVES
I
NTRODUCTION
T
he 2010 Budget represents a futher step in the process of getting Irish fiscal policy back onto a sustainable path. This process started with the 2009 Budget published in October 2008, and continued, inter alia, with the Supplementary Budget in April this year. Over recent months, the global economy has begun to show some signs of recovery and there is growing evidence that the worst may be over in terms of the domestic downturn. The preparation of this year’s budget has to take into account the downward trend in tax revenue during 2009, the potential for public expenditure changes that can yield savings in the shortrun, and the signal created by the Budget itself to international markets where Ireland is borrowing to fund the shortfall in revenue given current expenditure commitments. The Budgetary preparation can also be informed by the recently published report of the Commission on Taxation, the report of theSpecial Group on Public Service Numbers and Expenditure Programmes (also referred to as An Bord Snip Nua or the McCarthy Report). In addition, ESRI researchers have responded to the crisis by producing several research papers during 2009 of particular relevance to budgetary policy. This year’s Budget Perspectives Conference, co-hosted by The Economic and Social Research Institute and the Foundation for Fiscal Studies, provides several inputs to inform macroeconomic decision making in these challenging times.
A key focus of this year’s conference is the work of the Commission on Taxation, with a research paper on selected issues and overall responses from a distinguished panel comprising Donal de Buitleir (FFS), Philip Lane (TCD) and Richard Tol (ESRI). Two other papers extend the bounds of the usual discourse at Budget time: one deals with Ireland’s approach to the EU budget, and the other with the pressures for protection via regulation, which become stronger during a downturn, and appear to have low or nil budgetary cost, but have high economic costs in the long term.
T
he short term issues facing the Irish economy are addressed in the opening presentation by Alan Barrett, Ide Kearney, and Jean Gogginbased on the ESRI’s Autumn Quarterly Economic Commentary which will be published on www.esri.ie. As this is to be published on the day of the conference, details are not available at the time of writing. The Commentary
and the presentation will give particular attention to the state of the public finances, and the appropriate stance for fiscal policy in 2010 given developments in the international and domestic economy.
I
n their paper, ESRI researchers, Tim Callan, Claire Keane and John Walsh explore, using the ESRI tax-benefit model, SWITCH, two of the key issues covered in the Report of the Commission on Taxation which point to the need to restructure the Irish tax system. They begin by considering in some detail the introduction of a tax on residential property. In particular, they examine how a scheme of income-related waivers and reductions could link property tax liability to ability to pay. They find that it would be possible to devise such a scheme that would retain most of the revenue from a simple property tax, but would not require payment from those in the lowest one-fifth to one-quarter of the income distribution. In addition, they look at the impact of including Child Benefit in taxable income and compare this with a revenue neutral reduction in Child Benefit. They find that the taxation of child benefit is preferable in terms of its distributional impact on child income support.Tax
Reform:
Selected
Issues
I
n the second paper, Alan Matthews (TCD) looks out to the medium term, exploring Ireland’s possible negotiating position after 2013, when the current framework expires. This will be the first time that Ireland will enter these discussions in the certainty that it will be a net contributor. The paper looks at how expenditure has changed over time, noting how the relative importance of the CAP has reduced with increasing shares of expenditure coming under the structural and cohesion headings. It also looks at changes in the composition of revenue sources and at Ireland’s net budgetary position. It provides a summary of the reform proposals in relation to both revenue and expenditure and possible options for dealing with what are seen as ‘unacceptable net balances’ across countries. It concludes with a discussion of Ireland’s position in relation to EU budgetary reform in the context of the changed domestic fiscal stance.Future of EU
Budgets:
Irish
Perspectives
T
he final paper by Paul Gorecki (ESRI) explores the pressures for bespoke protectionism that arise in an economic downturn when the government faces difficult budgetary conditions. The emphasis on bespoke protectionism arises from the fact that it can appear to solve problems by helping those facing difficulties without any apparent fiscal cost. The reality is that bespoke protectionism is very costly in terms of its distortionary effects on the economy, which are large and likely to persist long after economic recovery. In the context of public choice and economic welfare analysis, the paper provides examples of the distortionary effects of regulation, specifically in the taxi licence and energy markets. It also reviews cases where exemptions from the Competition Act have been successfully sought, namely, medical practitioners and voice-over actors, and the potential danger for precedents that these examples set. Welfare economics points to the need for transparent fiscal interventions, which implies that regulatory impact assessment is applied robustly to all regulations under consideration.T
AX
R
EFORM
:
S
ELECTED
I
SSUES
Tim Callan, Claire Keane and John R. Walsh
*T
he report of the Commission on Taxation (2009) documents an agenda for the reform of taxation at a time when the public finances are under very severe pressure. It would undoubtedly be easier to reform taxation at a time when the overall tax take could be reduced, rather than when gains and losses must balance out in a revenue-neutral fashion. It is still more difficult if reforms have to be introduced at a time when, for macroeconomic reasons, the overall tax take must rise.1 But even when facing the task ofincreasing revenues, there are choices to be made between increasing rates on the existing base, and broadening the base, without an increase in rates. As Poterba (2009) stated in this year’s Geary Lecture, a touchstone result in public finance is that …the distortionary cost of a tax system depends not on the level of tax rates but on the square of tax rates.2 This makes a strong argument for
base-broadening rather than rate increases, which informs much of the report of the Commission on Taxation.
1.
Introduction
In this paper, we address a selection of issues linked by the theme of base-broadening; and we consider some aspects of the income tax rate structure which were addressed by the Commission. The two areas of base-broadening we consider are:
• Introduction of a tax on residential property (Section 2); and • Inclusion of child benefit as part of taxable income (Section 3).
* The Economic and Social Research Institute, Whitaker Square, Sir John Rogerson’s Quay, Dublin 2. Email: [email protected]
We are grateful to referees for helpful comments; the usual disclaimer applies.
1 The February 2008 terms of reference for the Commission included keeping “the overall tax burden low” and implementation of a carbon tax on a revenue-neutral basis. The January 2009 Framework document agreed by the social partners included the following:
Additionally, given the urgency of the situation and the role that taxation will have to play in bringing stability back to the public finances, the Government is asking the Commission on Taxation to identify appropriate options to raise tax revenue and to complete its report by September 2009.
Each of these raises issues requiring close investigation, and we use
SWITCH, the ESRI tax-benefit model to examine the first-round implications of policy changes in these areas.3 The main findings are drawn
together in the final section.
C
ONTEXT2.
Property Tax
A
2008) summarised the main advantages of property as a base for taxation: recent OECD study on taxes and economic growth (Johansson et al.,• property is immobile,
• property taxes are hard to evade or avoid,
• property tax revenue can be used to reduce the burden of income taxation, and has fewer behavioural consequences than income taxes, • property taxes can offset distortions caused by favourable tax
treatments of owner occupation which tend to cause overinvestment in housing,
• property is a major component of wealth, • property is suitable as a local tax base.4
The property tax heading includes recurrent taxes on immovable property (paid by both households and businesses), taxes on net wealth (paid by both households and corporations), taxes on gifts and inheritance and taxes on financial and capital transactions. Johansson et al. (2008) summarise empirical work, based on a panel regression covering 21 OECD countries over the period 1970 to 2005, suggesting that …recurrent taxes on immovable property seem to have the least adverse effect on GDP per capita… They found that within the OECD, recurrent taxes on immovable property accounted for about half of total property taxes, with taxes on transactions accounting for about another quarter.
The balance of taxes within the property tax heading is quite different for Ireland. The Commission on Taxation points to Ireland’s heavy reliance on stamp duty and transactions taxes in the taxation of property. This imposes costs on mobility, including mobility between jobs requiring a change of residence. It distorts decisions as to whether to move to a more suitable property for changed needs (larger family, empty nest, or change in health status) or to adapt an existing property. It also means that stamp duties can be particularly sensitive to the state of the economic cycle. Stamp duties had been less than half of the “taxes on property” category in the 1990s, but rose to be over 70 per cent by 2006. However, the end of the housing boom has seen declines in property values and in transactions, which have greatly reduced revenue from this source in the recent past. Ireland has not had an annual tax based on domestic residential property values since the abolition of domestic rates in 1978. Both the Commission on Taxation and the OECD study point to a further advantage of an annual tax on immovable
3 A third area where they may be scope for base-broadening reform, the tax treatment of pensions, was also considered by the Commission. This is the subject of a separate study (Callan et al., 2009b).
TAX REFORM:SELECTED ISSUES 5
property: this tax base is more stable than one based on transactions. Indeed, Johansson et al. (2009) state that …tax revenue generated from this tax is .... more predictable than for revenues obtained from labour and corporate taxes, partly due to less cyclical fluctuation in property values (e.g. Joumard and Kongsrud, 2003).
R
ECOMMENDATIONS OF THEC
OMMISSION ONT
AXATIONOECD (2006) has stated that Ireland has some of the most generous tax provisions for owner-occupied housing, largely because it is the only OECD country that allows a tax deduction for mortgage interest payments at the same time as not taxing property values, capital gains or imputed rent. In this context, the Commission on Taxation has recommended the introduction of an annual tax on residential housing units, with liability falling on the owner of the property (whether owner occupier or landlord). There would be exceptions for social housing (including local authority rented housing)5 and some more limited exceptions such as
nursing homes and boarding schools. Stamp duty for purchasers of a principal private residence would be zero-rated; and the tax would replace the €200 charge on second homes recently introduced. Key design features of the Commission’s proposal for an annual property tax (APT) include:
• The tax liability be broadly proportionate to the value of the property, calculated as a fixed percentage of the midpoint of the valuation band into which the property falls.6
• The owner(s) of the property would be liable for the tax.
• The annual property tax should have regard to ability to pay. In particular, the Commission recommends that there should be a waiver scheme for those on low incomes, a 10 per cent reduction where the principal income earner has …a substantial and permanent disability; and a further provision that in some other cases the tax could be …deferred and recovered when the property is subsequently sold or transferred.
The link between property tax and ability to pay is a crucial one for the acceptability of such a tax. One of the main objections raised to an annual property tax is that it is “unfair” because it does not take account of the difficulties it would pose for low income individuals. The example often given is of a widow or pensioner living in a house with a value which would make for a large property tax bill and would be difficult or impossible to pay from a low income. The Commission makes a broad recommendation on this issue; we are able to explore what is involved in greater depth, as explained in the next sub-sections.
market, and greater uncertainty over house values, it is possible that an alternative might be preferred. Modern methods of valuation, using statistical models explaining house price variation based on the characteristics of the dwelling,7 and the portability of computing power,
mean that the process of valuation can be completed much more quickly than in the past. Experience from the Northern Ireland (Northern Ireland Department of Finance and Personnel, 2009) and elsewhere (McCluskey and Adair, 1997) suggest that development of a valuation database could be achieved within a relatively short time frame. Thus, in our view, the Commission’s recommendation of a property tax should not be seen as hinging on the use of self-assessment as a valuation mechanism; there are alternatives which could also be used to implement their design in a relatively short time frame.
A
NNUALP
ROPERTYT
AX:
A
NALYTICF
RAMEWORKIn order to examine the potential impact of an annual property tax with an income-related full or partial waiver, we need a suitable database. This must contain a nationally representative sample of households, with information on the value of the house or apartment, and detailed information on the incomes and family relationships of those living in the dwelling. The Central Statistics Office Survey on Income and Living Conditions8 provides such
information, and our analysis is based on the data from that survey for the year 2005.9 We have, however, made a number of adjustments to take
account of developments in income and in the housing market since that time. We also need to be able to simulate the rules of the property tax system, and of a waiver scheme related to income and/or other characteristics of the owner of the property. This is provided by an extension of SWITCH, the ESRI tax-benefit model, to include options for a tax on owner-occupied property, and for a full or partial waiver of that tax depending on income.
The property tax we analyse is very similar in structure to that recommended by the Commission on Taxation, but there are some differences. Chief among these is the fact that the property tax we analyse does not apply to rental property, but only to owner occupied property. This is because data on house values are only gathered for owner-occupiers in the survey. There are also issues around the appropriate treatment of the rental sector,10 but we are unable to explore these with the data currently available.
However, given the high rate of owner-occupation, and the fact that the Commission excludes both local authority tenants and the social housing sector from the remit of its Annual Property Tax, the analysis here comes close to capturing the main effects of a tax as proposed by the Commission.
7 These are know as “hedonic” pricing models, and are widely used. The permanent tsb/ESRI house price index is based on this approach.
8 The survey is known as EU SILC, as it is conducted in all EU countries with a view to providing comparable statistics on income and living conditions.
9 The estimated value of the housing stock is close to the product of the number of dwellings (Department of the Environment) and the standardised average house price (permanent tsb/ESRI series).
TAX REFORM:SELECTED ISSUES 7
A second difference is that the Commission proposes the use of banded house values, whereas our analysis looks at the use of discrete market values as reported by respondents to the survey. Compared with a discrete value system, the banded system can be seen as involving a higher payment for those with house values in the lower half of the band, and a lower payment for those in the top half of the house value band. The reason for adopting a banded system seems to be a practical one: that the introduction of a system based on discrete values would take longer to set up. Nevertheless, a banded system could be a stepping stone towards a discrete value system and the overall impact of the banded system proposed by the Commission can be expected to be broadly similar to that of the discrete system.
Full details of the methods and assumptions used in the analysis, and more detailed results on the potential impact of an annual property tax on households are available in a companion paper (Callan et al., 2009a). Here we concentrate on three main aspects:
• The relationship between a property tax and ability pay, under different forms of a low income exemption scheme.
• The regional distribution of the revenue raised by a property tax. • Transitional arrangements affecting those who have paid stamp duty
during recent years.
The next three subsections deal with each of these issues in turn.
P
ROPERTYT
AX ANDA
BILITY TOP
AYWe compare three forms of property tax. The first might be termed a simple property tax, with liability related only to the value of the property, and having no extra component related to ability to pay. This case is useful as a benchmark against which to measure the effectiveness of income exemption schemes in limiting the impact on lower income earners – it is not intended as a policy proposal. The other two variants have an income limit below which no property tax is paid (either €12,000 per annum, roughly the level of the State Contributory Pension, or €15,000 per annum), and a “rebate withdrawal rate”11 which sees property tax liability rise by 20 cent for every
euro of income above that limit. The income concept used in both of these variants is income adjusted to take account of the needs of families of different sizes and age compositions. The adjustment is done using an adult equivalence scale, with the first adult in the family counting as 1, and a second or subsequent adult as 0.66, to take account of economies of scale. Children are counted as having needs equivalent to 0.33 of those of the first adult. This is the national equivalence scale used by CSO in monitoring both the “at risk of poverty” measure and the “consistent poverty” target, and close to the scale implicit in the payment rates for social welfare schemes. In all cases, the rate of property tax assumed is 0.4 per cent of property value –
a figure chosen to arrive at a revenue of approximately €1,000 million per annum.12
Table 1: Revenue Impact of Alternative Waivers and Rebates for Property Tax
Income Exemption Limit (Annual Disposable
Income Per Adult Equivalent)
Rebate Withdrawal
Rate (%)
Revenue €Million Per
Annum
Simple property tax 0 n.a. 1,101
Property tax with income exemption limit and
marginal relief €12,000 20 973
Property tax with income exemption limit and
marginal relief €15,000 20 906
Note: A tax rate of 0.4 per cent is applied in all cases.
Table 1 summarises the main results in terms of the overall revenue that could be collected under each of these schemes. A simple property tax with no income exemption limit would raise about €1,100 million per annum. A tax with an income exemption limit of €12,000, and a rebate withdrawal rate of 20 per cent, would raise about €970 million. Extending the income limit further up the scale to €15,000 per annum would see the revenue fall to just over €900 million. Thus, the alternative schemes with income exemption limits would retain between 80 and 90 per cent of the maximum potential revenue.
How would the distributional impact of a property tax be affected by these different approaches? Table 2 summarises the impacts at different income levels, dividing the population into 10 equal sized groups from those with lowest to those with highest income (“deciles”). The income criterion used takes account of differences in family size and age composition in the manner described earlier (i.e., uses income per adult equivalent). A simple property tax with no income-related relief would see losses of between 1 and 2 per cent for those in the bottom 30 per cent of the income distribution. An income exemption limit of €12,000 per annum would eliminate losses for the bottom 10 per cent, limit them to 0.3 per cent for the next decile, and reduce them from almost 2 per cent to 1 per cent for the third decile. A higher income limit of €15,000 per annum could eliminate losses for the 20 per cent of households with lowest incomes, and limit losses to 0.2 per cent for the third decile.
Taken together, Tables 1 and 2 indicate that an income exemption limit, along with a gradual withdrawal of the full rebate, could be used to relate property tax liability to ability to pay, limiting the impact on those on the lowest incomes. At the same time, the property tax could raise between 80
[image:14.595.159.519.121.294.2]TAX REFORM:SELECTED ISSUES 9
and 90 per cent of the maximum revenue. In part, this reflects the fact that those with low incomes tend also to have lower valued property on average. The existence of a low income rebate or full waiver would, of course, imply an increase in the effective marginal tax rate on income of those benefiting from a rebate. However, it seems that the proportion affected in this way would be not dissimilar to those in Great Britain and in Northern Ireland.
Table 2: Distributional Impact of a Property Tax With and Without Income Exemptions
Decile
Adjusted Net Income Per
Week
% Change in Income for Income Group
More Than
Less Than
Simple Property
Tax
Income Exemption Limit of €12,000
Income Exemption
Limit of €15,000
Lowest 204 -1.0 0 0
2 204 263 -1.4 -0.3 0
3 263 325 -1.9 -1.0 -0.2
4 325 396 -1.2 -1.1 -1.0
5 396 449 -1.0 -1.0 -1.0
6 449 519 -1.3 -1.2 -1.2
7 519 605 -1.3 -1.2 -1.2
8 605 711 -1.6 -1.5 -1.5
9 711 889 -1.2 -1.2 -1.2
Highest 889 -1.1 -1.1 -1.1
Total -1.3 -1.1 -1.0
Note: Each decile contains 10 per cent of all households, from those with lowest incomes up to those with the highest incomes. A property tax rate of 0.4 per cent of owner-occupied property is assumed throughout. Where an income exemption limit applies, the rebate withdrawal rate is 20 per cent.
R
EGIONALD
ISTRIBUTION OFP
ROPERTYT
AXWhat about the regional distribution of revenue from property tax? A combination of factors led to the former Residential Property Tax raising close to three-quarters of its revenue from the Dublin area. How would a property tax of the type examined here compare? Table 3 shows how the share of revenue raised under a property tax (with a rate of 0.4 per cent and an income cut off of €12,000) varies across regions, and, for comparison, the shares of the regions in population and in disposable income.13
[image:15.595.162.525.184.423.2]Table 3: Regional Shares of Population, Income and Property Tax
Region Households Disposable Income
Property Tax Revenue
% % %
Border 9 7 6
Midland 5 4 3
West 8 6 6
Dublin 36 44 52
Mid-East 9 9 10
Mid-West 7 7 5
South-East 10 7 6
South-West 16 14 12
Total 100 100 100
T
RANSITIONALR
ELIEF [image:16.595.161.526.90.288.2]TAX REFORM:SELECTED ISSUES 11
C
hild benefit is currently paid in respect of all children under 16 years of age, and those aged 16 or 17 years in full time education.14 Currently childbenefit is not included in the definition of income for taxation purposes. The Commission advised that Child Benefit should be included in taxable income,15 but that this suggestion should be compared to the alternatives
(such as means testing). The Report of the Special Group on Public Service Numbers and Expenditure Programmes also suggests either making Child Benefit taxable, making it a means-tested benefit or reducing rates to arrive at a 20 per cent cut in expenditure. The Report advises that savings of over €500 million could be achieved by creating a standard rate of €136 a month. Currently, if a family has three or more children they receive a rate of €166 for the first two children and a higher rate of €203 for the third or subsequent children. The rationale for this approach was that larger families were found to be at greater risk of poverty, so that a policy offering greater support to larger families could help to reduce poverty risk in a targeted way.16
3.
Taxable
Child Benefit
There is extensive research on the structure of child income support which can be used to inform this choice. An increased, taxable child benefit was analysed by Callan (1991). Nolan (1993) reviewed the multiple objectives of child income support and proposed a reduction in child dependant additions, along with an increased, taxable child benefit. Callan et al. (2006) reviewed both taxable child benefit and a form of means-tested payment labelled “Child Benefit Supplement”, designed to replace the child additions payable with social welfare payments, and, at least partially, the Family Income Supplement Scheme17 Policy over the 1990s and the early
years of this decade did not follow any of these paths. Instead, child benefit was increased without making it taxable. The options now being considered, in the face of the fiscal crisis, are:
• A cut in payment rates. This could maintain the current higher rate for large families, or, as proposed by The Report of the Special Group on Public Service Numbers and Expenditure Programmes, move to a standardised payment rate.
• Move to means-testing of the payment.
• Include child benefit in taxable income, so that those on the lowest incomes would be protected, and those on the highest incomes would see the greatest reduction in “net” child benefit payments.
A means test on Child Benefit would involve a new “benefit withdrawal rate” which acts to increase effective marginal tax rates. Thus it could lead to a disimprovement in the balance between income in work and income out of work, and would certainly lead to higher marginal tax rates facing some of those in work. Making the payment taxable would also lead to some impact on marginal tax rates, as some of those with children would move to a
14 A half-rate payment is made in respect of 18 year olds at present, but Budget 2009 indicated that this would cease from January 2010.
15 “Taxation of child benefit” is sometimes taken to mean that the payment would itself be reduced. The “inclusion of child benefit in taxable income” or “making child benefit taxable” are more precise descriptions of the policy change envisaged. Child benefit is usually paid to the mother, and the amount paid in this way would be unchanged.
higher tax rate, or into the tax net – but the net impact on incentives would be lower. The least impact on financial work incentives would arise from the “rate-cutting” option, which would reduce income in work and in unemployment by the same amount, leaving the gap between the two unchanged.
What of the distributive effects of the alternatives? Here we focus on the taxable child benefit and rate cut options. The impact of the means-testing option depends crucially on the level of income at which withdrawal of benefit would begin, and on the rate of benefit withdrawal. There is no indication in official documents of how these parameters would be set.
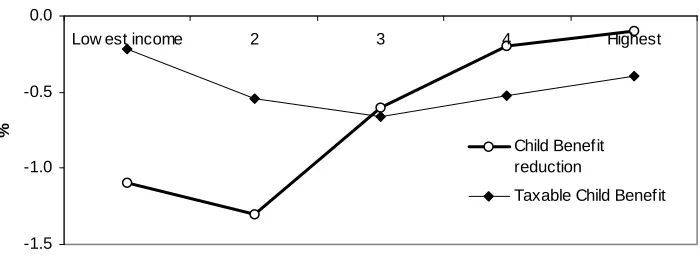
Using the ESRI tax benefit model, SWITCH, it is possible to examine the overall impact of reducing Child Benefit rates or, alternatively, including Child Benefit in taxable income. SWITCH is based on a large scale, nationally representative sample of households and allows analysis to be carried out at tax unit level. Along with providing an estimate of savings that can be made for the exchequer it also allows us to examine the numbers affected by the policy change, the effects across the income distribution and the effect on poverty risk. Our survey-based estimate indicates a saving of about €450 million can be made by reducing the Child Benefit rate to €136 per month. This represents about 88 per cent of the impact as estimated by the Special Group; but a key advantage of the microsimulation approach is that we can identify how this impact differs across the income distribution. The inclusion of Child Benefit in taxable income could result in an increase in tax revenue in the region of €370 million per year. The Commission proposed a a tax credit to offset the additional tax payable in respect of child benefit for those in the lower half of the income scale. It is not clear how this would be structured, but a tax credit which was only available to those in the lower half of the income distribution would have to be withdrawn gradually – making it more like a means-tested system. For both of these reasons, we do not attempt to simulate this here, and keep taxable child benefit, means-testing and rate-cutting as distinct options. The introduction of such a tax credit would reduce the Exchequer’s tax revenue but would lessen the negative impact on the income of those in lower income deciles.
TAX REFORM:SELECTED ISSUES 13
Figure 1: Percentage Change in Disposable Income for Alternative Child Benefit Policy Changes: Making Child Benefit Taxable Versus Reduction in Child Benefit Payment Rates
-1.5 -1.0 -0.5 0.0
Low est income 2 3 4 Highest
Decile of incom e per adult equivalent
%
Child Benefit reduction
Taxable Child Benefit
Finally, we can examine the impact on child poverty rates of the two alternatives compared to the current 2009 budget. We focus on one of the key measures used by the EU Commission, the “at risk of poverty” measure, based on an income poverty line at 60 per cent of median income per adult equivalent. Reducing the rate of Child Benefit to €136 is associated with an increase of 1.2 percentage points in the head count version of the “at risk of poverty” measure for children. The inclusion of Child Benefit in taxable income would lead to a smaller increase of 0.6 percentage points. When a “poverty gap” measure is used, taking account of the depth as well as the extent of income poverty, the taxation option leads to a 3 per cent increase whereas the reduction to a new standard payment leads to a 17 per cent increase.
In our view, the inclusion of Child Benefit in taxable income provides a better structure for child income support. It allows for the possibility of effecting reductions in aggregate Child Benefit expenditure while affording protection to those on the lowest incomes. It has been indicated that there are serious technical difficulties in implementing such a change within a year. If it would take longer to implement such a policy, this should still be the medium term goal. In current circumstances, one could envisage, for example, a commitment to move to this structure, with temporary cuts in Child Benefit payment rates to be restored when Child Benefit is made taxable.
T
his paper has looked at two main areas for broadening of the tax base: an annual tax on property and Child Benefit.4.
Conclusions
Key findings from our analysis include the following:
REFERENCES
AKERLOF, G., 1978. “The Economics of Tagging as Applied to the Optimal Income Tax and Other Things”, American Economic Review
(March).
AUERBACH, A. J. and J. Hines Jr., 2002. “Taxation and Economic Efficiency”, in A. J. Auerbach and M. Feldstein (eds.), Handbook of Public Economics, Edition 1, Volume 3, Chapter 21, pps. 1347-1421, Amsterdam: Elsevier.
CALLAN, T., 1991. Principles and Policy Options, Policy Research Series Paper No. 12, Dublin: The Economic and Social Research Institute,.
CALLAN, T., C. KEANE and J.R. WALSH, 2009a. “What Role for Property Taxes in Ireland?”, ESRI Working Paper No. 322, October. www.esri.ie.
CALLAN, T., C. KEANE and J.R. WALSH, 2009b, forthcoming. Pension Policy: New Evidence on Key Issues, Research Series, Dublin: The Economic and Social Research Institute.
CALLAN, T., K. COLEMAN, B. NOLAN, J.R. WALSH, 2006. “Child Poverty and Child Income Supports: Ireland in Comparative Perspective” in T. Callan and A. Doris (eds.), Budget Perspectives 2007, Dublin: The Economic and Social Research Institute.
CLARK, T., C. GILES and J. HALL, 1999. Does Council Tax Benefit Work?, London: Institute for Fiscal Studies.
COMMISSION ON TAXATION, 2009. Commission on Taxation Report 2009, Dublin: Stationery Office.
CONNIFFE, D. and D. DUFFY, 1999. “Irish House Price Indices: Methodological Issues”, The Economic and Social Review, Vol. 30, No. 4, October.
CENTRAL STATISTICS OFFICE, 2008. Survey on Income and Living Conditions (SILC) in Ireland, Cork: Central Statistics Office.
DEPARTMENT OF SOCIAL AND FAMILY AFFAIRS, 2007. Green Paper on Pensions, Dublin: Stationery Office.
DUFFY, D., 2009. “Measuring House Prices in Ireland” in A. Barrett, I. Kearney and J. Goggin, Quarterly Economic Commentary, Spring 2009, pp. 18-21.
FOSTER, J., J. GREER, E. THORBECKE, 1984. “A Class of Decomposable Poverty Measures”, Econmetrica, Vol. 52, No. 3, May, pp. 761-766.
HARBERGER, A.C., 1964. “The Measurement of Waste”. American Economic Review, Papers and Proceedings, Vol. 54, May, pp. 58-76 (a). HEADY, C., 2009. “Review of International Experience”, paper presented
to Foundation for Fiscal Studies Annual Conference on ‘The Fiscal Treatment of Property’, May.
HUGHES, G., 2005. “Pension Tax Reliefs and Equity” in J. Stewart (ed.),
For Richer, For Poorer: An Investigation of the Irish Pension System, Dublin: tasc/New Island Press.
HUGHES, G. and A. SINFIELD, 2004. “Financing Pensions by Stealth: The Anglo-American Model and the Cost and Distribution of Tax Benefits for Private Pensions” in G. Hughes and J. Stewart (eds.),
Reforming Pensions in Europe: Evolution of Pension Funding and Sources of Retirement Income, Cheltenham: Edward Elgar.
JOUMARD, I. and. P.M. KONGSRUD, 2003. “Fiscal Relations Across Government Levels”, OECD Economics Department, Working Paper No. 375.
McCLUSKEY, W.J. (ed.), 1999. Property Tax: An International Comparative Review, Aldershot: Ashgate Publishing Limited, pp. 1-458.
McCLUSKEY, W.J. and A. ADAIR, 1997. Computer Assisted Mass Appraisal Systems, Avebury, London: Gower.
McCLUSKEY, W.J., P. DAVIS and L.C. LIM, 2007. “Domestic Rate Reform in Northern Ireland: A Critical Review of Policy Options”,
Environment and Planning: Government and Policy, Vol. 25, pp. 131-149. McCLUSKEY, W.J., F. PLIMMER and O. CONNELLAN, 1998. “Ad
Valorem Property Tax: Issues of Fairness and Equity”, Assessment Journal, May, pp. 47-55.
NOLAN, B., 1993. Reforming Child Income Support, Dublin: Combat Poverty Agency.
NORTHERN IRELAND DEPARTMENT OF FINANCE AND PERSONNEL, 2002. Review of Rating Policy: A Consultation Paper, Bangor: Department of Finance and Personnel Rating Division.
NORTHERN IRELAND DEPARTMENT OF FINANCE AND PERSONNEL, 2004. Reform of the Domestic Rating System in Northern Ireland: Policy Paper – A Fairer Share, Bangor: Department of Finance and Personnel Rating Division.
NORTHERN IRELAND DEPARTMENT OF FINANCE AND PERSONNEL, 2007. Reform of the Domestic Rating System in Northern Ireland: A Consultation Report, Bangor: Department of Finance and Personnel Rating Division.
NORTHERN IRELAND DEPARTMENT OF FINANCE AND PERSONNEL, 2009. Review of Domestic Rating: A Consultation Report, Bangor: Department of Finance and Personnel Rating Division.
OECD, 2009. Pensions at a Glance, Paris: OECD.
OECD, 2006. OECD Economic Surveys: Ireland, Paris: OECD.
PENSIONS BOARD, 2005. National Pensions Review, Dublin: The Pensions Board.
PENSIONS POLICY INSTITUTE, 2005. A Commentary on the Pension Reform Debate, London: Pensions Policy Institute.
POTERBA, J., 2009, forthcoming. “The Challenge of Tax Reform and Expanding the Tax Base”, ESRI Geary Lecture, Dublin: The Economic and Social Research Institute.
A
PPENDIX
:
S
IMULATING
W
ELFARE AND
I
NCOME
T
AX
C
HANGES
(
SWITCH
)
W
hen considering the potential impact of tax changes, calculations are often undertaken for just a small number of illustrative families. This approach has severe limitations. For example, less than one family in 20 falls into the category of “one-earner couple with 2 children” which attracts so much attention at budget time. Furthermore families within this category differ in terms of income, housing tenure, and other characteristics that affect their tax-benefit position. More fundamentally, analysis of hypothetical families - no matter how well chosen - simply cannot give an overall picture of the impact of a policy change on incomes and work incentives. For this reason, in many countries policy changes are assessed using tax-benefit models which are based on large-scale nationally representative samples of households. This ensures that the models represent as fully as possible the great diversity of household circumstances relevant to tax and social welfare. Several countries including the UK and the US have models which are maintained and used by official departments or agencies, as well as models developed and used in the academic sector (e.g., the Institute for Fiscal Studies, the Tax Policy Center in Washington and the Microsimulation Unit at the University of Essex). In Ireland, the ESRI has developed a microsimulation model of the Irish tax and benefit systems, SWITCH (Simulating Welfareand Income Tax CHanges).The capabilities of the model include:
• Estimation of the net budgetary cost of packages of tax and welfare changes. Alternative reform packages with the same budgetary cost can therefore be constructed.
• Estimation of the pattern of gains and losses from a policy change. The numbers of families gaining and losing and the size of their gains and losses can be estimated, and the distribution of gains and losses across family types and income levels can be explored.
• Estimation of the impact of policy changes on effective marginal tax rates.
T
HE
R
ECESSION
,
B
UDGETS
,
C
OMPETITION
,
AND
R
EGULATION
:
S
HOULD
THE
S
TATE
S
UPPLY
B
ESPOKE
P
ROTECTION
?
Paul K. Gorecki
∗R
ecessions are harsh. Demand declines. Firms shed labour, reduce output or file for bankruptcy. Pressure mounts to reduce prices and increase productivity. Returns decline; margins are squeezed; dividends are suspended. Unemployment increases. Firms seek to delay payments to suppliers, while simultaneously demanding suppliers reduce input prices and extend credit. Carefully assembled workforce teams are broken up. New products and innovations are put on hold. Competition is characterised as cut-throat, destructive and excessive. Faith in markets begins to be questioned.1.
Introduction
As a result some producers, often with the support of organised labour, demand protection or shelter from market forces in a recession. The demand for what will be referred to as bespoke protection takes many forms from legislative to budgetary. The state is asked to provide free insurance against the impact of the recession, usually to well organised and articulate groups. Of course, the state already provides protection against the effects of the recession through universal programmes: for individuals, unemployment benefits, medical cards and, in exceptional cases, mortgage
∗ This paper has benefited from comments and suggestions made by ESRI colleagues at a
assistance; and, for firms, bankruptcy and limited liability laws. This paper focuses on bespoke protection, rather than universal programmes.
A superficially plausible case can be made for responding to these demands by providing bespoke protection. Unprecedented times demand, it is argued, radical solutions. Government, many believe, should preserve jobs to the maximum extent possible. The banking crisis and light touch regulation demonstrates liberal capitalism has failed. There is a need to tame the market. Too much competition, or what has been referred to as ‘overcompetition,’ leads to destructive and cut-throat competition driving firms, employees and their families into penury. The intervention need only be temporary. Thus, there will be no long-term adverse impact on growth and productivity. This paper considers the validity of such arguments.
There are three inter-related issues that need to be addressed by the state in considering the demand for bespoke protection:
• On what criteria or grounds should the state supply such free insurance to particular groups in recessionary times? In other words, why should the state intervene?
• How and in what form should the state provide the protection? The state has a number of instruments that it can use to supply the protection demanded, from budgetary to regulatory; and
• What are the consequences of providing bespoke protection, in terms, for example, of productivity and growth? What can be learnt from previous examples of protection provided in similar circumstances? Will bespoke protection impede the rapid recovery scenario from the current recession as set out in Bergin et al. (2009, Figure 2, p. 11)?
In answering these three questions two alternative approaches are used: public choice and welfare economics. Public choice is about explaining the actions of public representatives based on the assumption that politicians make choices that they think will get them re-elected. In contrast, welfare economics focuses on the overall welfare of society. It is more about what politicians should do and about working out the consequences of sub-optimal decisions by politicians.
THE RECESSION,BUDGETS,COMPETITION, AND REGULATION 21
mechanisms can be put in place that result in political decisions closer to those favoured by welfare economics.
I
NTRODUCTION2.
Some
Preliminary
Observations:
Instrument
and Public
Choice
The purpose of this section is to provide a thumbnail sketch of how the public choice mechanism can influence government intervention. Attention is also devoted to how the predictions derived from public choice with respect to instrument choice are reinforced by the current recession. A particular Irish twist that solves two of the problems inherent in public choice is discussed next. The section concludes with a brief discussion of whether or not welfare economics and public choice are likely to respond to demands for bespoke protection in a similar manner.
I
NSTRUMENTC
HOICEGovernments can intervene to supply relief from market forces. Governments have a rich menu of instruments of intervention from which to choose. These can be divided into three broad categories:1
• Budgetary, such as subsidies (e.g. overpayment for goods and services, award contracts on non-competitive basis, modernisation and R&D grants and so on) and tax expenditures (e.g. tax relief for investing in selected activities such as multi-storey car parks and holiday camps);
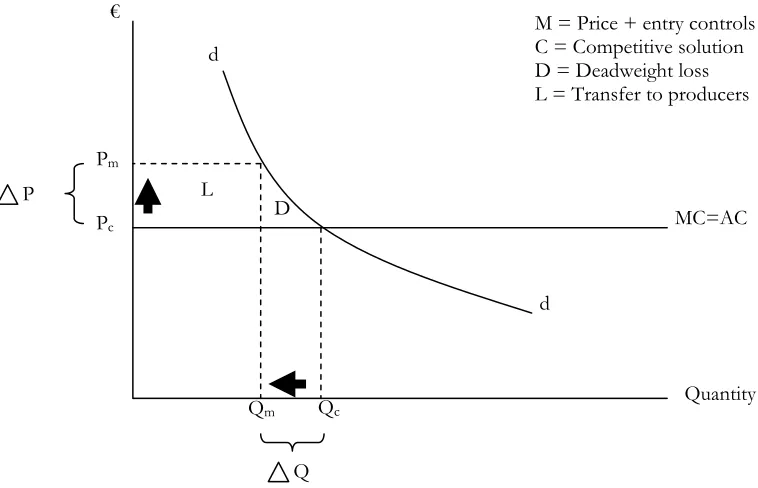
• Regulatory, such as restricting entry by placing a cap on the number of participants in a regulated activity and/or mandating price reductions in a regulated activity; and
• Competition, such as partial or complete exemption of certain markets or professions or other groups from competition law and/or budget reductions/reorganisations of the competition agency that lessen operational effectiveness.
These instruments are substitutes in many policy contexts in that each can be used to achieve the same policy objective.
An example illustrates the point. After the decline in the value of sterling at the end of 2008 due to the UK recession, Irish shoppers increasingly turned to Northern Ireland for their groceries.2 Retailers in Ireland
eventually reacted by reducing some prices, evidenced by Tesco’s announcement on 5 May 2009 (Tesco, 2009). This in turn put pressure on food processor margins and farm gate prices. Demands for bespoke protection from the impact of these pressures could be met in various ways:
1 There are, of course, other instruments that the state could employ. For example, Trebilcock et al. (1982) consider public inquiries and public enterprise, but do not consider competition policy. In part this reflects the different contexts within which choice of instrument is considered. In this paper the context is the recession, while for Trebilcock et al. (1982) the context was part of a larger study of regulation.
• Budgetary assistance through a tax on food which would be redistributed to food processors and farmers, and/or grants to enhance productivity of processors and farmers and/or provision of an export credit scheme with a state-backed guarantee;3
• Regulatory assistance through the creation of a Retail Ombudsman to make sure that processors and farmers are paid sufficiently to ensure “equity and fairness in the food supply chain” and/or government instructions to the independent regulator, the Commission for Energy Regulation (CER), to reduce electricity prices,4 and,
• Competition assistance through the exemption of food processors and farmers in dealing with retailers from the Competition Act 2002 (the Competition Act), so that producers can combine to offset the alleged buyer power of the supermarkets.
Of course, it is possible that these instruments can be used in a complementary manner, with one reinforcing the other.
If the state is to intervene to provide bespoke protection, the issue arises of what form the intervention might take. In other words, which of the three instruments are likely to be selected? In an era of budgetary restraint in Ireland consequent on the worldwide recession, exacerbated considerably by domestic policy failures, there are severe constraints on the extent to which these demands for protection can be met through increased budgetary measures.5 Instead the relative attractiveness of the two off-budget balance
sheet instruments identified above – regulation and competition policy – is likely to increase. These off-budget instruments have minimal public expenditure implications, while delivering the desired benefits to the group demanding protection. Vigorous competition policy and independent regulation designed to promote entry and competition for the benefit of consumers thus may be seen as unaffordable luxuries in a period of economic crisis, if the state decides to supply protection demanded by particular groups.
It should be noted that budgetary measures may be used to complement restrictive regulation and competition policies in times of recession if they involve a reduction, rather than an increase, in public expenditure. For example, the effectiveness of regulatory and competition agencies can be weakened through budgetary reductions and/or reorganisations. This weakening will lead to less vigorous enforcement of competition law, with the result that private arrangements to mitigate the impact of the recession,
3 Apart from the tax on food, this response was favoured by food processors. For details see FDII (2009a; 2009b). In this connection it might be noted that the government announced in 2006 a €50 million investment grant package to beef and sheepmeat processors. For details see Department of Agriculture and Food (2006).
4 The Retail Ombudsman is favoured by the farmers (IFA, 2009a) and FDII (2009a; 2009b), while the FDII also called for lower electricity prices in meeting the challenge posed by Tesco’s price cuts. The quotation in the text is from IFA (2009a).
THE RECESSION,BUDGETS,COMPETITION, AND REGULATION 23
such as a cartel, are less likely to be detected and prosecuted. This, therefore, facilitates private, albeit illegal, market restrictions.6
P
UBLICC
HOICEPublic choice is about explaining choices made by politicians.7 A number of
different assumptions have been made as to what politicians are maximising, what they are trying to achieve, what motivates and guides their selection of policies or other actions as public representatives. Trebilcock et al. (1982, p.11), for example, assume that proximate aim of politicians is …maximizing the likelihood of their election or re-election. In this respect politicians are competing for the marginal voters, since these voters are most likely to switch compared to infra-marginal voters. Friedman (1990, p. 546), in contrast, assumes that the …politician is seeking to maximize his long-run income (plus non pecuniary benefits, one of which maybe ‘national welfare’)… subject only to the constraint that they need to get re-elected.
Public choice theory sees politicians as operating in a market in which they supply (say) bespoke protection during a recession, in return for actions which contribute positively towards their aim or objective such as re-election. These actions might, for example, include campaign and other contributions to party coffers. Certain propositions have been developed using this framework which can assist in predicting the conditions under which politicians supply bespoke protection and the likely characteristics of the instrument selected.
A number of propositions have been developed in the public choice literature, which are particularly relevant in respect of instrument choice. Two are considered here, following the terminology adopted in Friedman (1990, pp. 545-548): 8
• protection will favour concentrated not dispersed groups; and
• politicians will prefer transfers for which the information cost of determining what is going on is as high as possible for the victims –
6 There is some evidence that cartels are more likely to occur in a recession. For example, Stephan (2009) finds, contrary to expectations, that many of the cartel infringements in the past 10 years …indicate that many collusive agreements may be formed as a consequence of an economic downturn. (p. 5). In Ireland the formation of a beef cartel was encouraged by the government in order to reduce overcapacity. The Competition Authority took a case under the Competition Act. Although the Competition Authority lost at the High Court, the case was appealed and aspects of the case were referred to the European Court of Justice (“ECJ”) by the Supreme Court. The ECJ ruled that the beef capacity reduction arrangements were an infringement of competition law. The Supreme Court has still to decide whether despite being an illegal agreement there are offsetting advantages, which would mean that on balance the arrangements were consistent with competition law. The Supreme Court held the hearing on 25-26 May 2009. Judgment is awaited.
7 It is, of course, the case that the discussion could be extended, as the literature shows, to include other important actors such as public servants. However, it could be argued in a country such as Ireland with a much smaller public sector – in absolute size – and thus a smaller span of control within a government department, compared to many other larger countries, that politicians are able to exert an unusually high degree of influence over decisions and hence it is appropriate to concentrate attention on politicians in this paper. See Trebilcock et al. (1982) for consideration of other actors besides politicians.
consumers and taxpayers – and as low as possible for the beneficiaries – small well organised groups.
The prediction that protection will typically be awarded to small concentrated groups rather than larger dispersed groups reflects a number of factors. First, there is a greater incentive to belong to a concentrated group than a dispersed group. This reflects the differing pay-offs or benefits. Let us assume that the bespoke protection is equivalent to €20 million that benefits 20 firms €1 million each per year, while the cost is borne by consumers through a small increase in price, equivalent €10 per household per year. The firm has a much greater incentive to belong to a group since the pay-off is substantial whereas for the household the cost is trivial. Second, there is an information problem. Members of a concentrated group are much more likely to be aware of the value of the benefit afforded by the protection and have an incentive – given its expected size – to estimate its magnitude. In contrast, a dispersed group is much less likely to be aware of the cost to them of the restriction and may not be in a position to estimate its magnitude. Furthermore, even if they were, given that the likely magnitude is small they may decide to remain what Friedman (1990, p. 547) and others call “rationally ignorant.”9
Third, it is easier to overcome the free-rider problem for a concentrated than a dispersed group. Each group – whether it is the concentrated or dispersed – is providing a benefit that takes on the characteristics of a public good.10 In other words, if the concentrated group is successful in securing
protection (or the dispersed group successful in preventing the protection), then a firm (or member of the dispersed group) is likely to benefit irrespective of whether or not it contributed to funding, organising and participating in the group. Hence, if the firm (or member of a dispersed group) does not contribute to the group it still benefits and thus is referred to as a free rider. If there are too many free riders the group will not be formed, since insufficient subscriptions will be collected to fund the lobbying effort. Overcoming the free rider problem is much easier for the concentrated group since moral persuasion and social sanctions can be applied, which are much more difficult to apply to a dispersed group. There is, of course, the added problem of identifying members of the group, which is likely to be more difficult for the dispersed group. Thus, it is easier to free ride in the dispersed than the concentrated group. Fourth, the transaction costs of running a concentrated group are much more likely to be small compared to a dispersed group, especially given the above factors.
The second prediction is that politicians will prefer transfers for which the information cost of figuring out what is going on is as high as possible for the victims – consumers and taxpayers – and as low as possible for the beneficiaries – small well organised groups. This point is fairly obvious. Politicians have no desire for consumers and taxpayers to become aware that each of them is paying a small increase in price in order that income can be
9 See Peltzman (1989, p.6).
THE RECESSION,BUDGETS,COMPETITION, AND REGULATION 25
transferred to a concentrated group, particularly if that group is perceived to be well off and in some sense privileged. Hence, the provision of bespoke regulation is likely to be justified on grounds other than a transfer or quasi tax on a large group to benefit a small group. In the example cited above concerning assistance to food processors and farmers the bespoke regulation could be justified, for example, on grounds of ensuring equity and fairness in the food chain.11
It might, of course, be argued in some sense that the various special interest groups would cancel each other out. In other words, there would be some sort of balance that would neutralise the impact of these special interest groups.12 However, there can be no assurance that this will occur in
the context of this paper, in examining whether or not bespoke protection should be offered in a recession. Indeed, it is unlikely to be the case. It is often the case that these special interest groups combine to argue for protection, rather than oppose one another.13
There are a number of criticisms that could be made of the public choice explanation of when bespoke protection will be provided.14 These criticisms
are not so much that the discussion above is incorrect, but rather that it needs to be extended. It is not clear, from a public choice perspective, when the state will say ‘yes’ and when it will say ‘no’ to demands for bespoke protection.15 There appear to be no bright lines that can be used to exclude
demands from certain groups or activities, but not others. Equally, there are
11 On 11 August 2009, the Minister for Enterprise, Trade and Employment issued a consultation document on proposals to establish an Ombudsman to enforce a code of practice for grocery good undertakings (Department of Enterprise, Trade and Employment, 2009). The consultation document referred to …the need to achieve balance in the relationships between grocery undertakings, taking into account the need for a fair return to both suppliers and retailers, the need to enhance consumer welfare…(p. 2). The proposals were welcomed by food processors (IBEC, 2009c) and farmers (IFA, 2009b), while retailers have, as yet, to take a position. In their initial reaction retailers talked about the necessity of ensuring, …that no obstacles are put in the way of retailers securing the best value from their suppliers and, in turn, delivering the most competitive price to consumers (IBEC, 2009b).
12 There are instances where the interests of differing groups might to some extent offset each other. For example, in international trade negotiations there may be groups opposed to further liberalisation such as farmers and other groups such as exporters that are in favour of greater liberalisation and openness.
13 A good example is the Voluntary Restraint Agreements (“VRAs”) that between 1981 and 1985 artificially restrained the volume of car exports from Japan to the US. These were in reaction to the file jointly submitted by the Ford Motor Company and the United Auto Workers to the US International Trade Commission for relief from imports. Although it was unsuccessful it led to the VRAs. It has been estimated that in 1984-1985 the VRAs imposed the equivalent of an 11 per cent tariff on cars, with a benefit to producers of $2.6 billion, about a quarter of industry profits, but of course, there was also a positive impact on employment and wages. For details see Hufbauer (1991, pp. 121-125).
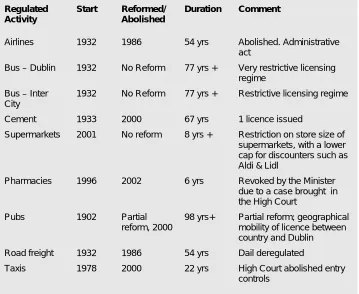
14 There are, of course, more fundamental criticisms of the public choice approach. Trebilcock (2005, pp. 436-438), for example, points out how the move towards deregulation and vigorous competition policy are examples of policies that by and large benefit dispersed rather than concentrated groups. However, in Ireland these policies have not been followed with the same degree of vigour as in other countries. Attempts to reform the regulation in urban buses was a failure, while several of the examples of deregulation in Ireland – taxis and pharmacies – have come about because of judicial intervention, rather than public policy. Furthermore, as reported below, recent policy action by the state appears to signal a downgrading of competition policy.
many well informed groups demanding bespoke protection. Hence, while there may be information asymmetries between the concentrated group that receives such protection and the dispersed group that pays the cost, such asymmetries may not obtain with other concentrated groups, particularly in adjacent areas of economic activity. This poses a problem for the politician in that in giving bespoke protection to one concentrated group but not another it may alienate the latter group. In the discussion of social partnership below one possible method of resolving this is presented.
I
MPLICATIONS FORI
NSTRUMENTC
HOICEThe second prediction has an implication for instrument choice. Restrictive regulation and relaxing competition policy are much more opaque methods of providing bespoke regulation than budgetary measures such as a tax increase. In the example cited earlier concerning the impact of price reductions on food processors and farmers, the government could impose a tax on groceries and then redistribute the revenue to the processors and farmers or it could set up a Retail Ombudsman to make sure that processors and farmers are paid sufficient to ensure “equity and fairness in the food supply chain.” Both instruments of intervention have the same outcome in terms of redistributing income to farmers and processors, but in the latter case the transfer is cloaked in language designed to justify higher consumer prices that may well be acceptable, while a tax on food would probably result in howls of outrage, especially given that poor consumers spend a disproportionate percentage of their income on food. Perhaps it is for this reason that an ombudsman has recently been proposed by government.16
A
NI
RISHT
WIST:
S
OCIALP
ARTNERSHIP17While these predictions are general, in the case of Ireland, a specific institutional structure, social partnership, has been put in place that is conducive to facilitating the introduction of bespoke protection. Although partnership is primarily concerned with pay bargaining, since its inception in 1987 its remit has gradually been extended so that now it …is difficult to think of a policy issue that is not now the subject of some social partnership working group or another… (Hardiman, 2006, p. 362). Social partnership is a corporatist arrangement whereby, primarily, representatives of organised labour and business, together with the government taking the role of chairman, reach multi-year agreements on important aspects of economic and social policy. For example, the partnership framework for 2006 to 2015 is 140 pages in length – not including a separate 11 page document on agriculture – and covers everything from the Irish abroad to better regulation.18
Partnership is essentially an interest or pressure group model of decision making. As noted above, it is typically the well organised groups representing labour and business which do a deal, with the blessing of
16 See footnote 11 above for details.
17 For a further discussion of partnership see for example, Boyle et al. (2004), Hardiman (2000, 2006), Roche (2009) and references cited below.
THE RECESSION,BUDGETS,COMPETITION, AND REGULATION 27
government.19 There are no groups representing consumers. The advantages
of any partnership agreement reached, even if it contains bespoke protection, is likely to be stressed by the parties to the agreement. It is very difficult for the outsider to unpick the deal, as the negotiating process and the various trade-offs reached are conducted in secret, with very little involvement of the legislature.
Social partnership helps resolve the co-ordination problems identified above with respect to the public choice approach as to when bespoke protection will be provided. The partnership process involves many if not all of the concentrated groups that are likely to demand bespoke protection. It thus provides a forum in which these groups can reach an accommodation as to which demands should be met.
This is not to deny that there may be benefits flowing from social partnership (Hardiman, 2000; 2006). The process may lead, for example, to a shared understanding of the problems facing the Irish economy and thus make resolution easier to formulate and implement. However, these benefits should not be exaggerated. For example, the OECD (2001, p. 26), based on Fitz Gerald (1999), questions whether partnership led to an outcome for wages that was any different from what market forces would have led to. As Fitz Gerald (1999, p. 162) states, While helping to bring about a more orderly labour market, with fewer industrial disputes than in the 1970s, the partnership approach served more to validate the results which market forces had made inevitable.
In view of subsequent developments in social partnership this conclusion arguably needs to be modified, perhaps even rejected. In particular, public sector pay rises awarded in 2003 and thereafter were based on a comparison of equivalent positions in the private sector (Kelly et al., 2009, p. 342). The outcome of this benchmarking process was that the public sector pay differential with the private sector …increased from less than 10 per cent in 2003 to almost 22 per cent in 2006, controlling for human capital and other relevant pay determining characteristics… (Kelly et al., 2009, p. 364).20 In other words, it does not appear
that there were any objective economic grounds for the increase in public sector pay compared to the private sector.21,22 Such significant widening of
the public/private sector pay differential is likely to have adverse macro-economic effects: competitiveness will suffer due to wage inflation in the private sector, the tax burden is increased and any downward adjustment in public sector wages in the current recession is likely to be difficult, raising the possibility of strikes and other forms of industrial action.
19 While it is true that a third pillar, the community and voluntary sector, was added in 1997 (Hardiman, 2000, p. 293), …the core economic actors – unions and employers – inevitably have a privileged status over the community and voluntary sector (Hardiman, 2006, p. 348).
20 This is likely to understate the differential since no account is taken of the fact that public servants have defined benefit, rather than defined contribution, pension schemes, that there is greater pension coverage in the public sector and there is much greater job security in the public compared to the private sector. Kelly et al (2009, p. 365) estimate that the impact of the greater pension coverage in the public sector is to raise the pay differentail in 2003 from 9.7 per cent to 12.9 per cent.
E
CONOMICE
FFICIENCY,
I
NSTRUMENTC
HOICE ANDI
NTERVENTIONThe rationale for intervention and the instrument selected using the public choice approach is unlikely to coincide with that provided by welfare economics, as illustrated in Table 1. Typically in the welfare economics approach the first question to be asked is: What is the rationale for intervention? In terms of the grounds for intervention, the relevant question is whether or not there is a market failure that merits intervention. The market failure might be a misallocation of resources due to the existence of a monopoly, the presence of negative externalities due to environmental pollution and so on. Given that there is a sound rationale for intervention, the next question is: What is the most appropriate instrument? The instrument selected is designed to be the most cost effective, with a preference for transparent instruments that increase accountability. There can be no guarantee that it will be off-budget rather than budgetary. Furthermore, before deciding whether to actually intervene there is a need to compare the cost of intervention with the benefits. The third set of issues is the economic and other consequences of intervention guided by welfare economics and p