Further Reading
Charlesworth JM (1978) Evaporative analyzer as a mass detector for liquid chromatography. Ana-lytical Chemistry50: 1414.
Kerker M (1969)The Scattering of Light and other Electromagnetic Radiation. New York: Academic Press.
MacRae R and Dick J (1981) Analysis of carbohy-drates using the mass detector.Journal of Chrom-atography210: 138}145.
Mourey TH and Oppenheimer LE (1984) Principles of operation of an evaporative light-scattering
detector for liquid chromatography. Analytical Chemistry56: 2427}2434.
Oppenheimer LE and Mourey TH (1985) Exam-ination of the concentration response of evapor-ative light-scattering mass detectors. Journal of Chromatography323: 297}304.
Stolyhwo A, Martin M and Guiochon G (1987) Analysis of liquid classes by HPLC with the evap-orative light scattering detector.Journal of Liquid Chromatography1243}1253.
Detectors: Fluorescence Detection
R. P. W. Scott, Avon, CT, USA
Copyright^ 2000 Academic Press
The process whereby molecules are excited by elec-tromagnetic radiation to produce luminescence is termed photoluminescence. If the release of energy is delayed, or persists after the removal of the exciting radiation, then the substance is said to be phosphores-cent. Signal persistence (even with a short but signiR -cant lifetime) limits the use of phosphorescence for liquid chromatography (LC) detection, because signal continuance will produce apparent peak broadening and consequent loss of resolution. If the release of electromagnetic energy is immediate, or stops on the removal of the excitation radiation, the substance is said to be Uuorescent. In contrast to phosphores-cence, Suorescence has been shown to be extremely useful for LC detection, and has provided some of the highest sensitivities available.
When light is absorbed by a molecule, a transition to a higher electronic state takes place and this pro-cess is highly speciRc for each substance. This is because radiation of a particular wavelength, or en-ergy, will be absorbed by speciRc molecular struc-tures. If electrons are raised, due to absorption of light energy, to an upper excited singlet state, and the excess energy is not dissipated rapidly by collision with other molecules or by other means, the electron will return to the ground state with the emission of light at a lower frequency. Under such circumstances the substance is said to Suoresce. In reality, some energy is always lost before emission occurs and thus, in contrast to Raman scattering, the wavelength of theSuorescent light emitted is always greater than the incident light. For further information on the theory
ofSuorescence the reviews by Guilbault, Undenfriend and Rhys-Williams are recommended (see Further Reading section).
With the exception of certain electrochemical de-tectors and the mass spectrometer, the Suorescence detector affords greater sensitivity to sample concen-tration than other devices. In addition, the S uores-cence sensor is less sensitive to changes in ambient conditions, e.g. temperature and pressure. The high sensitivity that is achieved is also partly due to the very low background light level and the consequent low noise level. The low noise level of theSuorescent detector is in contrast to those detectors that involve light absorption measurements, where the signal is superimposed on a strong background signal with a high noise level. The major disadvantage ofS uores-cence detection is that relatively few compoundsS u-oresce in a practical range of wavelengths. However, the scope ofSuorescence detection can be extended by forming derivatives. For example, the reagents Suoropa (o-phthalaldehyde) and Suorescamine (4-phenyl-spiro(furan-2-(3H),1-phthalan)-3,3-dione) are both commercially available derivatizing reagents that can react with primary amines to produceS uor-escent derivatives. One other minor disadvantage is the effect of molecular oxygen which, if present in the mobile phase, can cause signiRcant Suorescent quenching. It is essential, therefore, for maximum and constant response, to degas the solvents by he-lium sparging before use.
Figure 1 The single wavelength fluorescent detector.
a virtually black background and hence provides the maximum signal-to-noise ratio. If necessary, the background signal can be further reduced by the use of an appropriateRlter to remove any stray scattered excitation light that might be received by the sensor.
TheSuorescence signal (If) is given by
If"Io(1!e\Ccl)
whereis the quantum yields (the ratio of the num-ber of photons emitted and the numnum-ber of photons absorbed),Iois the intensity of the incident light,cis
the concentration of the solute,is the molar absorb-ence andl is the path length of the cell.
It is clear that the solute concentration is a some-what complex function of the intensity of the emitted Suorescent light. As a consequence, the signal from the photocell must be electronically modiRed to pro-duce an output that is linearly related to solute con-centration.
Fluorescence detectors vary widely in complexity. The simplest consists of a single wavelength excita-tion source in conjuncexcita-tion with a sensor that responds to light at all wavelengths (UV and visible). For cer-tain applications, this simple form of Suorescence detector can be very sensitive and inexpensive. How-ever, by restricting the excitation light to a single wavelength, and with no means of selecting the emission wavelength, the system has limited versatil-ity. At the other extreme is theSuorescence spectrom-eter that has beenRtted with a sensor cell of appropri-ate dimensions. This comprehensive Suorescence monitoring system is highly complex and versatile and allows both the excitation and emission
wave-lengths to be chosen. Furthermore, excitation spectra can be obtained at anyRxed emission wavelength, or an emission spectrum can be obtained for anyRxed excitation wavelength.
The Fluorescence Detectors
The Single Wavelength Excitation Fluorescence Detector
With the exception of the electrochemical detector, the single wavelength excitationSuorescence detector is probably the most sensitive detector generally available to LC but, as already stated, it is so at the cost of limited versatility. A simple form of theS u-orescence detector excited by light from a single wavelength UV source is shown inFigure 1.
The UV excitation source is usually a low pressure mercury lamp which is comparatively inexpensive and provides relatively high intensity UV light at 253.7 nm. Many substances that Suoresce will, to a lesser or greater extent, be excited by light at this wavelength. The excitation light is focused by a quartz lens, through the cell. Another lens situated normal to the incident light focuses the Suorescent light through a circular mask on to a photocell. Typi-cally, a Rxed wavelength Suorescence detector will have a minimum detectable concentration at an excita-tion wavelength of 254 nm ofc. 1;10\9g mL\1and
a linear dynamic range of 1;10\9}5;10\6g mL\1.
One of the disadvantages of theSuorescence detector is this rather limited linear dynamic range.
Figure 2 The seperation of some amino acids by monitoring their o-phthalaldehyde derivatives with a fluorescence detector. Column: Supelcosil LC-18, 5 cm;4.6 mm, 5m particles. Mobile phase: methanol}tetrahydrofuran}0.02 mol L\1sodium acetate
(pH 5.9 with acetic acid) A, 22.5 : 2.5 : 77.5, B, 80 : 2.5 : 17.5. 2 min at 100%(A) to 100%(B) in 20 min. Flow rate: 2 mL min\1. Sample:
50}100 pmol of each derivative in solvent A. Peak identification: 1, Aspartic acid; 2, glutamic acid; 3, asparagine; 4, serine; 5, glutamine; 6, glycine; 7, threonine; 8, arginine; 9, alanine; 10, tyrosine; 11, methionine; 12, valine, 13, phenylalanine; 14, isoleucine; 15, leucine; 16, lysine. (Courtesy of Supelco Inc.)
the Rxed wavelength detector. A typical example of this compromise is theSuorescence detector that util-izes the monochromator of a dispersive UV spectrom-eter in conjuction with lightRlters. It consists of a UV dispersion spectrometerRtted with a special absorp-tion cell having reduced dimensions.
The small sensor cell ensures that the narrow peaks produced by high efRciency LC columns can be monitored without loss of chromatographic resolu-tion. The wavelength of the excitation light is selected by the monochromator which will be within the nor-mal UV range of the spectrometer (c. 200}360 nm). The excitation light passes through the cell and the Suorescent light, emitted at right angles to the path of the excitation light, is focused on to a photocell. Up to this point, the sensor system is very similar to that of theRxed wavelengthSuorescence.
In most of these types of compromise detectors, appropriate light Rlters can be inserted between the sensor cell and the lens that focuses the emitted Suorescent light on to the photocell. In this way, the wavelength of the light monitored by the sensor can be selected by the choice of an appropriateRlter. This, in fact, is a rather primitive way of selecting the emission wavelength. Nevertheless, the arrange-ment can be quite effective, and certainly eliminates
the need for a second monochromator and the added cost. The use of this type of detector in monitoring the separation of the o-phthalaldehyde derivatives of some amino acids is shown in Figure 2. It is seen that a very high sensitivity is realized and the integrity of the chromatographic resolution is well maintained.
The Multi-wavelength Fluorescence
Detector
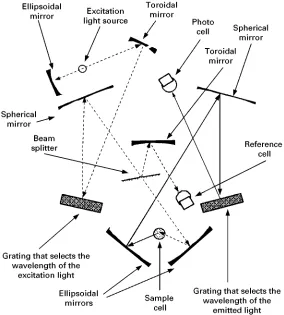
One form of multi-wavelengthSuorescence detector consists of two monochromators: theRrst selects the wavelength of the excitation light, and the second disperses theSuorescent light, and provides aS uores-cence spectrum, or allows the separation to be monitored at a selectedSuorescence wavelength. The multi-wavelength Suorescence detector is shown in
Figure 3 The fluorescence spectrometer detector. - -, excitation light;&&, fluorescent light.
comprises an excitation light system andSuorescent light system.
The excitation source (emitting light over a wide wavelength range, such as a deuterium lamp) is situ-ated at the focal point of an ellipsoidal mirror, shown at the top left-hand corner of the diagram. The paral-lel beam of light is collimated to fall on to a toroidal mirror, which then focuses it on to the grating, shown on the left-hand side of the diagram. This grating is used to select the wavelength of the excitation light or it can be used to scan the complete range of excitation wavelengths and provide a corresponding excitation spectrum that is monitored at a speciRc Suorescent wavelength. The selected wavelength then passes to a spherical mirror and then to a ellipsoidal mirror, shown at the base of the diagram, which focuses it on to the sample. The excitation light path is mostly depicted on the left-hand side of the diagram.
In the centre of the diagram, between the spherical mirror and the ellipsoidal mirror, is a beam splitter that diverts a portion of the incident light on to another toroidal mirror. This mirror focuses the light on to the reference photo cell. The reference photo cell provides an output that is proportional to the intensity of the excitation light. The path of theS
uor-escent light is depicted on the right-hand side of the diagram. Fluorescent light, emitted from the cell, is focused by an ellipsoidal mirror on to a spherical mirror at the top right-hand side of the diagram. This mirror focuses the light on to a grating which is situated at about centre right of the diagram. This grating selects a speciRc wavelength of theS uor-escent light to monitor, or can scan the Suorescent light produced by excitation light of a given and selected wavelength, and provide aSuorescent spec-trum. Fluorescent light from the grating passes to a photoelectric cell which monitors the intensity. The instrument is complex and relatively expensive; however, for measuringSuorescence, it is extremely versatile.
Figure 4 Detection of neomycin OPA derivative at an excitation wavelength of 365 nm and an emission wavelength of 418 nm. Column: Supelcosil LC-8, 15 cm;4.6 mm, 5m particles. Mobile phase: tetrahydrofuran: 0.0056 mol L\1 sodium sulfate}
0.007 mol L\1acetic acid}0.01 mol L\1pentanesulfonate, 3 : 97.
Flow rate: 1.75 mL min\1. Post-column reagent: 1 L 0.4 mol L\1
boric acid}0.38 mol L\1 potassium hydroxide containing 6 mL
40% Brij-35, 4 mL mercaptoethanol, 0.8 g o-phthalaldehyde. Flow rate 0.4 mL min\1. Mixer 5 cm;4.6 mm column packed
with glass beads. Reactor 10 ft;0.5 mm knitted Teflon capillary tubing. Reaction temperature 403C. Sample: 20 mL of a mobile-phase extract of a commercial sample. Excitation wavelength 365 nm; emission wavelength 418 nm. (Courtesy of Supelco Inc.)
Figure 5 Separation of a series of priority pollutants with programmed fluorescence detection. 1, Naphthalene; 2, acenaphthene; 3, fluorene; 4, phenanthrene; 5, anthracene; 6, fluoranthene; 7, pyrene; 8, benz(a)anthracene; 9, chrysene; 10, benzo(b)fluoranthene; 11, benzo(k)fluoranthene; 12, benzo(a)pyrene; 13, dibenz(a,h)anthracene; 14, benzo(ghi )perylene; 15, indeno(123-cd )pyrene. (Cour-tesy of the Perkin Elmer Corporation.)
The principle of optimizing excitation and emis-sion light wavelengths to obtain maximum sensitivity for a multi-component mixture can be quite complex, as shown by the separation of some priority pollu-tants depicted inFigure 5. The separation was carried out on a column which was 25 cm long, 4.6 mm in diameter and packed with a C18 reversed phase.
The mobile phase was programmed from 93 : 7 acetonitrile}water to 99 : 1 acetonitrile}water over a period of 30 min. The gradient was linear and the Sow rate was 1.3 mL min\1. All the solutes were
separated and the compounds, numbered from the left, are given inTable 1. The separation illustrates the clever use of wavelength programming to obtain the maximum sensitivity. The programme used is shown in Table 1.
The wavelength of the excitation light and that of the emission light was changed during chromato-graphic development to provide optimumSuorescent conditions, and thus maximum sensitivity, for each solute. This ensured that each solute, as it was eluted, was excited at the most energetic wavelength and then monitored at the strongest Suorescent wavelength.
[image:5.568.138.437.439.669.2]Table 1 Fluorescence detector programme
Time (s) Wavelength of excitation light (nm)
Wavelength of emitted light (nm)
0 280 340
220 290 320
340 250 385
510 260 420
720 265 380
1050 290 430
1620 300 500
Figure 6 The laser system for fluorescence detection in capillary electrochromatography.
same technique as that used to provide UV spectra with the variable wavelength UV detector.) In this way, it is possible to obtain excitation spectra at any chosenSuorescent wavelength, orSuorescent spectra at any chosen excitation wavelength. Consequently, even with relatively poor spectroscopic resolution, many hundreds of spectra can be produced, any or all of which (despite many spectra being very similar) can be used to help conRrm the identity of a com-pound.
The above spectrometric arrangement can be con-siderably simpliRed and much of the mechanical sys-tems eliminated by employing a diode array sensing device for the Suorescent light. This allows the S u-orescence spectrum to be recorded continuously throughout the development of the chromatogram. A speciRc excitation wavelength must be selected and this is achieved by employing the usual mechanical monochromator. Excitation spectra still need to be obtained by stopping the mobile-phase Sow and scanning the excitation light.
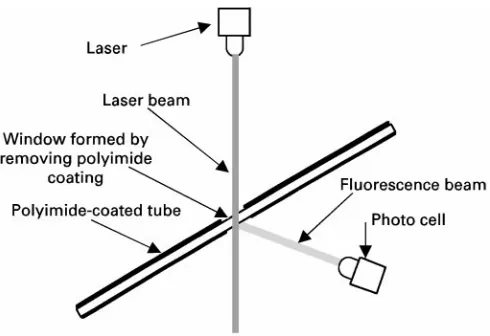
Due to the high sensitivities achieved by S uores-cence detection, the technique has proved very useful as a detection system in capillary
electrochromatog-raphy and capillary electrophoresis. High sensitivity is achieved by employing a high energy excitation source such as a laser, emitting light at an appropriate wavelength. A typical optical system forSuorescent detection in capillary electrophoresis and capillary electrochromatography is shown inFigure 6. A win-dow is opened in the quartz capillary tube, by remov-ing the polyimide coatremov-ing from about a millimetre length of capillary tube. The laser beam is arranged to pass through the window and the Suorescent light, emitted normal to the laser beam and the capillary tube, is focused on to a photoelectric cell or photo-diode array. ARlter can be interposed between the capillary window and the sensor measuring theS uor-escent light, to eliminate scattered incident light. The signal from the photo cell is electronically modiRed in the same way as the normal LCSuorescence detector. Unfortunately, lasers which have suitable wave-lengths for this purpose are somewhat limited. How-ever, lasers of various types are continuously being developed and this offers great promise for the future development of this type of detector.
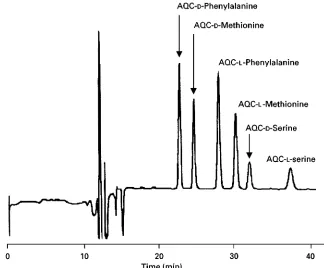
An example of the use ofSuorescence to monitor an electrophoretic separation of the AQCSuorescent derivatives of phenylalanine, methionine and serine are show inFigure 7. In this separation vancomycin was used as the chiral additive. The separation was carried out on a 30.5 cm fused silica capillary, 50m i.d., containing 0.1 mol L\1 phosphate buffer and
5 mmol L\1 vancomycin. The pH of the buffer was
7.0 and the electrophoretic voltage 5 kV.
[image:6.568.163.408.527.695.2]Figure 7 The separation of the enantiomers of the AQC fluorescent derivatives phenylalanine, methionine and serine. Courtesy of LC/GC. (T. L. Bereufer,LC-GC, Vol. 12 No. 10 (1994) 748).
Conclusion
Although relatively few substances are inherentlyS u-orescent, most can be made to formSuorescent deriv-atives by relatively simple derivatization procedures. In addition, with the aid of a suitable laser, the natu-ral high sensitivity of the device can be greatly en-hanced. The main disadvantage of the Suorescence detector is its limited linear dynamic range but since in most LC analyses high sensitivity is usually required for trace analysis, in practice this limitation is not found to be so important.
See Colour Plate 22.
Further Reading
Guilbault GG (1973)Practical Fluorescence. New York: Marcel Dekker.
Kok WTh (1998) Principles of detection. In: Katz E (ed.) Handbook of HPLC, p. 143. Chichester: John Wiley.
Rhys-Williams AT (1980)Fluorescence Detection in Liquid Chromatography. BeaconsReld: Perkin Elmer.
Scott RPW (1996)Chromatography Detectors. New York: Marcel Dekker.
Udenfriend S (1962) Fluorescence Assay in Biology and Medicine. New York: Academic Press.
Detectors: Infrared
R. P. W. Scott, Avon, CT, USA
Copyright^ 2000 Academic Press
Introduction
Infrared (IR) light is the term given to electromagnetic radiation having a wavelength lying between 1 and 15 micron. In contrast to UV light, which is adsorbed when the light energy at a particular wavelength is equal to speciRc electronic transitions in the mol-ecule, IR light is adsorbed when its energy is equal to