Abstract— Recently, dairy farming has been transformed into an industrialized system. As a result, dairy industry has been endeavoring to develop their operations through the adopting of several improvement methods and techniques. The current paper aims at evaluating existing operations and processes at a Dairy Factory in the state of Palestine, and to improve the efficiency of its operations and thus obtain maximum productivity. The scope of work in this paper is to apply the very modern improvement methods including process flow chart and Quality Function Deployment QFD.
Index Terms— Diary factory, QFD, Quality management tools, Engineering Management, Productivity and
Benchmarking.
I. INTRODUCTION A. Introduction to The Dairy Factory
airy factory is one of the major productive charitable projects in the state of Palestine. It produces dairy products such as, Ultra heat temperature (UHT), Choco, cheese, condense milk, sour milk, sour milk up, yogurt, Shemaint and juice. At 2001, the factory started Ultra heat temperature milk production. This project was extracted to implementation site in order to help Palestinian farmers to utilize their farms and sell their own milk, also to provide dairy products to the Palestinian national economy. At the beginning, Tetra Park Company provided the factory with machines, prepare design, equipment and training to the technical cadres according to the latest Quality System.
B. Introduction to The Analysis
Methods engineering is a technique used by progressive management to improve productivity and reduce costs in both direct and indirect operations of manufacturing and non-manufacturing business organizations. It can be defined as the systematic procedure for subjecting all direct and indirect operations to close scrutiny in order to introduce improvements that will make work easier to perform and will allow work to be done smoother in less time, and with less energy, effort, and fatigue, with less investment per unit. We used engineering methods to draw the process flow chart which is “a type of diagram that represents an algorithm, workflow or process, showing the steps as boxes of various
Manuscript received June 04, 2018; revised June 14, 2018.
K. T. Master student at the collage of mechanical engineering, Harbin Engineering University, Harbin, 150001 China. (phone: 13030066027; e-mail: [email protected]).
S. D. is with the collage of mechanical engineering Harbin Engineering University, Harbin, 150001 China. (e-mail: [email protected]).
kinds, and their order by connecting them with arrows, in this chart we draw each operation step for each manufacturing process, in order to analyze the steps and try to eliminate combine or improve it.
TQM is a management philosophy that seeks to integrate all organizational functions (marketing, finance, design, engineering, and production, customer service, etc.) to focus on meeting customer needs and organizational objectives. TQM views an organization as a collection of processes. It maintains that organizations must strive to continuously improve these processes by incorporating the knowledge and experiences of workers. The simple objective of TQM is “Do the right things, right the first time, every time.” TQM principles will be specifically used to identify possible improvements on dairy products. Adopting seven management tools and quality function deployment QFD to give an indicator for the factory about their quality level from the customer perspective. Quality function deployment (QFD) a “method wily to transform qualitative user demands into quantitative parameters, to deploy the functions forming quality, and to deploy methods for achieving the design quality into subsystems and component parts, and ultimately to specific elements of the manufacturing process.”
II. METHODOLOGY
A. Ultra-High temperature milk process flow chart
We have followed the flow chart principles: by defining each process in order to be diagrammed, discussing and deciding on the boundaries of each process: Where or when does, the process start, also where or when does it end, discussing and deciding the level of the details to be included in the diagram. Brainstorm the activities that take place, determining the process sequence, and arranging the activities in proper sequence.
B. Seven Management Tools
For the purpose of data collection; focus groups have been conducted with both, company representatives and customers. In addition, a questionnaire has been conducted to assess the level of quality from customer perspective. Several important questions have been included in the questionnaire in order to use it as an input for the seven management tools which have been used to analyze the data, so in this paper we will deal with six tools: Affinity Diagram; Tree Diagram; Process Decision Program Chart (PDPC); Matrix Diagram; Interrelationship Diagraph; and Prioritiza-tion Matrix.
Dairy Factory Assessment Using Total Quality
Management Tools
Khaled M. Toffaha, Shi Dongyan
C. Quality Function Deployment (QFD)
QFD helps transform customer needs (the voice of the customer [VOC]) into engineering characteristics (and appropriate test methods) for a product or service, prioritizing each product or service characteristic while simultaneously setting development targets for product or service. So we used the output of the seven management tools as an input to build the QFD.
III. RESULTS
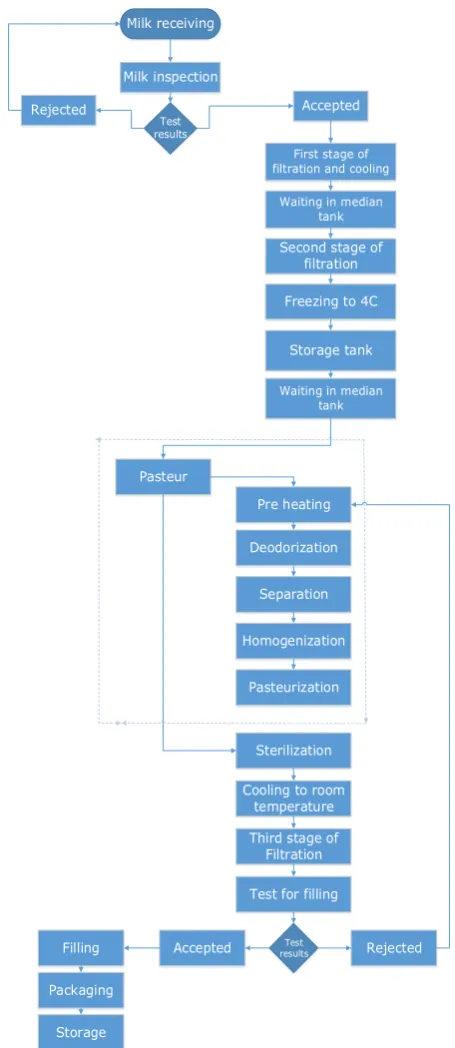
A. Ultra-High Temperature Milk Process Flow Chart
Milk receiving
Milk inspection
Test results
Accepted Rejected
First stage of
filtration and cooling
Waiting in median
tank
Second stage of filtration
Freezing to 4C
Storage tank
Waiting in median
tank
Pasteur
Pre heating
Deodorization
Separation
Homogenization
Pasteurization
Cooling to room temperature
Third stage of Filtration
Test for filling Sterilization
Test results
Accepted Rejected
Filling
Packaging
[image:2.595.306.545.158.333.2]Storage
Fig. 1. Ultra-High Temperature Milk Process Flow Chart
B. Seven Management Tools and “QFD
1) Affinity Diagram
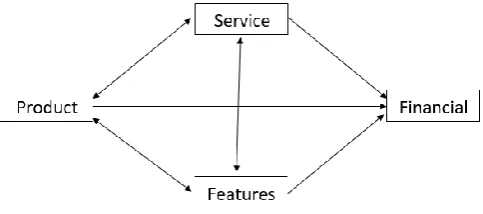
Affinity Diagram has been used to organize the ideas into categories. In this case, four distinct categories have been defined, Product, Features, Financial and Service, the previous ideas were classified into one of these categories. The following figure shows affinity diagram for the factory milk product.
Fig. 2. Affinity Diagram
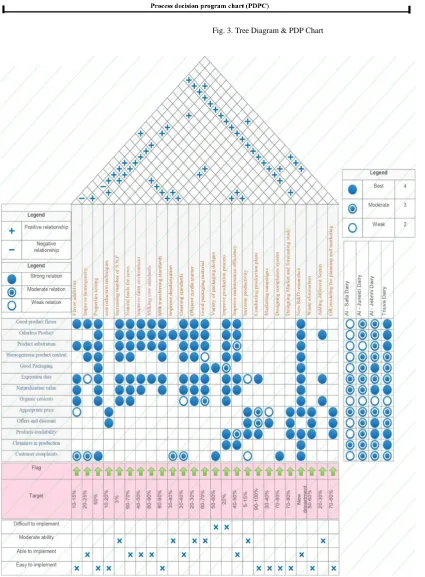
2) Tree Diagram
Tree diagram allows the planning of the actions necessary to implement each idea in the affinity diagram; a specific strategy has been identified for each objective in order to reach the desired goal. The next figure shows Tree diagram for the factory milk.“see Figure 3”.
3) Process Decision Program Chart (PDPC)
It provides a framework for developing contingency plans for preventing unexpected or dealing with it. Possible negative outcomes are considered for each strategy and contingency plans are listed. The following figure shows PDPC for the factory milk case. “see Figure 3”.
4) Matrix Diagram
[image:2.595.56.284.209.734.2]It depicts the relationship between objectives and actions necessary for each category. Matrix diagram has been drawn for each category to identify the possible relationship between objectives and actions. The matrix diagram is illustrated in the following tables.
TABLE I
PRODUCT MATRIX DIAGRAM Objective Action
product flavor
Odorless Product
Product substratum Flavor milk additives
Improve homogeneity Good testing of Bactria in Milk
Making sure of cleaning the lines
Testing flavor in each production unit
Increase number of Solid not fat in milk
Providing natural feeds for cows Providing good environment in farm
Following standards in cow milking
Key: Strong relationship
Moderate relationship
[image:2.595.300.556.600.794.2]Objective Action product flavor Odorless Product Product substratum Following standards in Milk
transferring
Improve deodorization unit Following standards of cleaning and isolating milking
Making sure of curdle starter
quantity and effectiveness
Making sure of incubator temperature effectiveness and the time needed in it
[image:3.595.30.564.51.603.2]Testing the product after finishing from incubator
TABLE II
FEATURE MATRIX DIAGRAM Objective Actions Good Packaging Expiration date Naturalization value Good and attractive
packaging material
Variety of packaging methods
Improve production process
[image:3.595.38.300.105.586.2]Using good material to preserve product Vitamins and other S.N.F additives Using Natural feeds for caw
TABLE III
FINANCIAL MATRIX DIAGRAM Objective
Action
Low price Offers and discount
Waste elimination
Improve operations and increase productivity
Have good planning leads to
better utilization
Marketing campaigns
TABLE IV
SERVICE MATRIX DIAGRAM
Objective Action Customer complaints Products availability in market
Designing complaints system
Market study
Good planning and forecasting
5) Prioritization Matrix
[image:3.595.306.548.355.462.2]It allows the comparison between the competitors in relative to the own product. The factory milk has been compared with another three main rivals. The results are explained in the following table.
TABLE V PRIOTORIZATION MATRIX
6) Interrelationship Diagraph
It describes the relationships between the categories from an affinity diagram. The following figure shows interrelationship diagraph for diary milk, it can be noted that each category affects two categories; therefore, they are equally affecting each other’s.
Fig. 4. Interrelationship Diagraph
7) Quality Function Deployment QFD
The following figure shows the quality function deployment for The Dairy Milk factory, it illustrates the main Customer needs for the product, the general design requirements, as well as the relations between needs and design requirements. Besides, a brief benchmarking for the product competitors has been conducted. “see Figure 5”
IV. CONCLUSION
After long search, we found that the factory fulfill our improvement aims due to its pitfalls that need a lot of improvements, so that we can conclude them as follows. Firstly, the factory has lower market share compared with the big competitors in the market. The main causes of this situation are the poor marketing efforts which resulting from the planning strategies. Secondly, the factory depends on the market demand in its production so they don’t implement the forecasting or inventory principles as safety stock to cover unanticipated demand. Thirdly, the factory doesn’t apply neither the lean manufacturing nor the supply chain principles, so the ability of stopping the production due to the low raw material or packaging supplies. Finally, there is a deficiency in the commitment of the workers Category Weight Dairy
Raw Score Dairy Wtd. Score Factory1 Raw Score Factory1 Wtd Score Diff. Wtd. Score
Product 0.25 5 1.25 7 1.75 -0.50 Features 0.25 4 1.00 5 1.25 -0.25 Financial 0.30 5 1.50 6 1.80 -0.30 Service 0.20 3 0.60 6 1.20 -0.60
Total 1.00 4.35 6.00 -1.65
Category Weight Dairy Raw Score Dairy Wtd. Score Factory 2 Raw Score Factory 2 Wtd. Score Diff. Wtd. Score Product 0.25 3 1.25 9 2.25 -1.00 Features 0.25 4 1.00 8 2.00 -1.00 Financial 0.30 5 1.50 8 2.40 -0.90 Service 0.20 3 0.60 8 1.60 -1.00
Total 1.00 4.35 8.25 -3.90 Category Weight Dairy
Raw Score Dairy Wtd. Score Factory 3 Raw Score Factory 3 Wtd. Score Diff. Wtd. Score Product 0.25 3 1.25 8 2.00 -0.75 Features 0.25 4 1.00 7 1.75 -0.75 Financial 0.30 5 1.50 7 2.10 -0.60 Service 0.20 3 0.60 9 1.80 -1.20
Total 1.00 4.35 7.65 -3.30
[image:3.595.45.297.681.784.2]Fig. 3. Tree Diagram & PDP Chart
.
ACKNOWLEDGMENT
This paper is funded by the International Exchange Program of Harbin Engineering University for Innovation-oriented Talents Cultivation.
REFERENCES
[1] Freivalds,A., & Niebel,B. (2013). Methods, Standard, & Work Desing. 13th. America, USA: McGraw-Hill.
[2] Sower,E. V. (2011). Essentials of Quality. 4th. New York: Jon Wiley & sons, cop.
[3] Streiner, D. (1995). Quality in Health Care. Oxford University Press Journals,15, 261-266.
[4] Tague, R. N. (2004). The Quality Toolbox. 2nd. ASQ Quality Press. 255-257.
[5] Gisele de Magalhães, José Benício and Viviane Gomes, (2005). “The implantation of QFD methodology in a small dairy company” [6] Stuart, F.I. &Tax, S.S. (1996). Planning for service quality: an
integrative approach, International Journal of Service Industry Management.7. 58-77.