Perceptual Grouping of Crack Patterns using Proximity and
Characteristic Rules
Fazly S. Abas
Department of Electronics and Computer Science University of Southampton
Hampshire, S017 1BJ United Kingdom email: [email protected]
Kirk Martinez
Department of Electronics and Computer Science University of Southampton
Hampshire, S017 1BJ United Kingdom email: [email protected]
ABSTRACT
In this paper, we present a 2-stage approach to con-nected curve grouping. The algorithm is experimented and demonstrated on crack-detected images of paintings. Some features are left undetected and this tends to produce dis-connected curves. In order to extract high-level features for content-based application, these supposedly connected curves have to be grouped together. It is one of the many steps needed to produce a content-based platform for dig-ital analysis of crack patterns in paintings particularly for classification purpose. The prime objective of the grouping algorithm is to segment or partition areas of an image to produce reliable representations of content. The first stage of the algorithm utilizes the Minimum Bounding Rectangle (MBR) of a crack network as means of finding overlapping features. We demonstrate the use of the both the rotated and the un-rotated MBR. In the second stage, curve char-acteristics represented by the rotated MBR such as the
di-mension ratio, the axis of minimum inertia, object centroid
and node density are used as features for an N-dimensional clustering.
KEY WORDS
Pattern Analysis and Recognition, Machine Vision, Crack analysis, Clustering
1
Introduction
Image processing techniques have now been implemented for analysis, preservation and restoration of artwork. We have been witnessing significant growth in the number of research done on image processing related to arts ranging from quality evaluation of art images, image processing tool for art analysis, virtual enhancement as well as restora-tion, image retrieval and as an aid for conservation.
Craquelure in paintings is a very important element in judging authenticity, use of material or environmental and physical impact because these can lead to different craque-lure patterns [3]. Although most conservation of fine art-work relies on manual inspection of deterioration signs, the ability to screen the whole collection semi-automatically is believed to be a useful contribution to preservation. Crack
formations are influenced by factors including aging and physical impacts which also relate to the wooden frame-work of the paintings. It is hoped that the mass screening of craquelure patterns will help to establish a better plat-form for conservators to identify the cause of damage.
In [1] and [2] we present steps taken to implement a content-based analysis of crack pattern in paintings. Cracks are first detected using a morphological top-hat operator and grid-based automatic thresholding. From a 1-pixel wide representation of crack pattern, we generate a statis-tical structure of global and local features from a chain-code based representation. A well structured model of the crack patterns allows post-processing to be performed such as pruning and high-level feature extraction. At this point each crack network represents a single content as far as content-based analysis is concern. We call this represen-tation a sub-content. Figure 1 shows sample of an image containing cracks and its crack-detected version.
[image:1.612.326.555.415.497.2](a) original image (b) crack-detected image
Figure 1. Example of crack-detected image
Kelly et al [7] performed grouping of straight line-segments which are his objects of interest using eigenclus-tering. In our work, the object of interest may range from a straight line, a curve, combination of connected straight lines, combination of curves and up to the worst possible case which is a mixture of straight lines and curves.
The Minimum Bounding Rectangle (MBR) or in some literature known as the Minimum Enclosing Rectangle has been used extensively for various applications such as Computer Graphics [10] and Spatial Database Systems [5, 11]. In our work we consider 2 rectangle-shaped ap-proximation which are the Minimum Bounding
gle (MBR) and the Rotated Minimum Bounding Rectan-gle (RMBR). The scope of our work considers having
vari-able number of sub-content in a single image. Perceptu-ally, these sub-content might possibly be fragments of a bigger entity of which we call a content or an object. On the other hand, they can also be a content or an object inde-pendently. The main aim of this paper is to investigate the use of these conservative approximations [6] not only as means of crack network approximation, but also to provide reliable features for pattern description.
In this paper, we show how crack patterns are grouped using a 2-stage process. The first stage uses the MBR or the RMBR as means of finding sub-content overlap and the second stage utilizes the features related to the RMBR as meaningful features used for clustering. Theoretical and experimental analysis are provided to show the effective-ness of the algorithm.
2
Conservative Shape Approximation
If reliable image segmentation is available, a popular ap-proach to object classification is based on analyzing the boundaries of the extracted regions which offers 2 main benefits. Firstly, it allows simple and efficient computa-tion of descriptors while secondly it offers a wide choice of techniques for classification based on a vector of properties [6].
Another approach for shape representation is to de-fine a set of standard shapes such as rectangles, circles or ellipses against which input regions are compared. These representations are known as conservative approximations [5]. An approximation is considered conservative if an only if each point inside the contour of the original object is also in the conservative approximations. Several known conser-vative representations are the minimum bounding rectangle (MBR), the rotated minimum bounding rectangle (RMBR), the convex hull (CH), the minimum bounding m-corner (MBMC), the minimum bounding circle (MBC) and the
minimum bounding ellipse (MBE) [5, 4]. These
approx-imations differ in terms of their accuracy, area they cover and number of required parameters. Table 1 compares them in terms of the number of required parameters.
This approach allows a more general characterization of descriptors since detail information about a shape has been translated into a more simplified representation.
De-spite reduction in shape information, it serves well in high-volume applications where the spatial objects show a very complex structure. Computation of spatial operators is very time-intensive, therefore a simplified shape representation will allow faster computation.
conservative approx. MBR RMBR CH
no. of parameters 4 5 var
conservative approx. MBMC MBC MBE
[image:2.612.331.559.379.448.2]no. of parameters 2 3 5
Table 1. Number of parameters for conservative approxi-mation.
* Explain the nature of the images used...several ob-jects in an image...yStart, xStart, yDim, xDim...show math-ematically.
2.1
Minimum Bounding Rectangle (MBR)
Computation of the MBR is simple and straightforward. We begin by enclosing an object which is in our scope of work named a crack network in a rectangle with sides parallel to the and axes of a cartesian coordinate
sys-tem. The crack network is represented in chain form, =
where
are octal-valued chain links computed over =
. Parameters for the MBR are computed
as,
"!$#%
&
' )(
*
+-,. /! 021
&
' 3(
*
(1)
4
56!7#%
&
' 3(
.
4
,. 6! 021
&
' 8(
.
(2)
where
(
.
and
(
*
are the and components of the
vector denoted by
(
.
(
*
and
(
.
are both .
and
4
-,.
are the minimum and maximum pixel coordinates of the object along the y-axis while4
and4 -,.
are the minimum and maximum pixel coordinates of the object along the x-axis. The MBR is constructed by lines = 9
, = -,.
, =
4
and =
4
-,.
.
2.2
Rotated Minimum Bounding Rectangle
(RMBR)
The computation of RMBR benefits from the concept of moments [8]. A moment of order (: +; ) is dependent on
scaling, translation and rotation and in a digital image< , it
is given as
5=?>@BA CEDF
&
'
K
CHDLF
&
'
K
CMGJI
N
=
>
<8O
N
where and are pixel coordinates. Since we are
working with binary images, </ST , . The first step
in-volves computing the centre of mass or centroid of a crack network denoted by (U ,U ) and calculated as
U
V VW
U
XY VW
(4)
Translation invariance is achieved with central mo-ments,
Z
= >
ACHDLF
&
' ACMGI
K
CHDF
&
'
K
CHGJI
O
NE[
U
\Q
=
O
[
U]Q
>
<8O
N
^\Q
(5)
A parameter which is crucially important in our work is the direction or axis of minimum inertia []_ computed as
_
`ba 0c%]d
fe
`
ZEW Z
[
Z Wg
(6)
The axis of minimum inertia _ is a property which
makes more sense for elongated objects, however towards computing the RMBR it is a prerequisite. The sides of the RMBR,
h
and4
h
can be calculated as
h
"!70i1kj ]OmlmQon
#%
_qprEOmlmQos?tno_u
[
!7#%fj vOmlmQon
#%
_qprEOmlmQos?tno_ouw (7)
4
h
/! 021bj
vOxlmQstn_
[
EOmlmQon #%
_ou
[
!7#%fj
vOmlmQos?tno_
[
EOxl^Qon #%
_ou
(8)
Let y be the number of non-zero pixel in the crack
network, bOmlmQ and zO^lmQ are coordinates of and for |{}l~{}y . Figure 2 shows example of a crack network
bounded by its MBR and RMBR.
3
First Stage of Grouping Algorithm
Once the shape approximations have been computed, a measure of homogeneity has to be established in order to group objects together.
In doing this, several criterium or characteristics can be taken into consideration. Prior knowledge as to how crack network should be grouped does in a way contribute towards deciding which criterium to employ. For instance, at this stage, we can not assume that RMBRs with simi-lar orientation should be grouped together and at the same time we can not rule out the possibility that they should not be. It depends on how we expect the end result to be like. If we expect the end result to be a unidirectional crack, it is highly desirable to group them. On the other hand, it is less desirable if we expect a different pattern. This dilemma makes pattern characteristic less effective as a grouping rule at this stage of the process.
A criteria based on proximity and object location is expected to produce visually better results compared to a
(a) MBR
(b) RMBR
Figure 2. Conservative approximation of a crack network
characteristic criteria. By refering to Figure 3(a), is more
likely to be grouped with compared to although
and are closer in resemblance. From observation, it is
more appropriate at this point to assume for merging that 2 RMBRs be evaluated in terms of their distance rather than their appearance.
3.1
RMBR Merging
We present two merging approaches which benefits from a structured representation of crack network.
Let fr =
W
\
be a list of crack network
where is the total number of network in the list. We
present two approaches for RMBR merging.
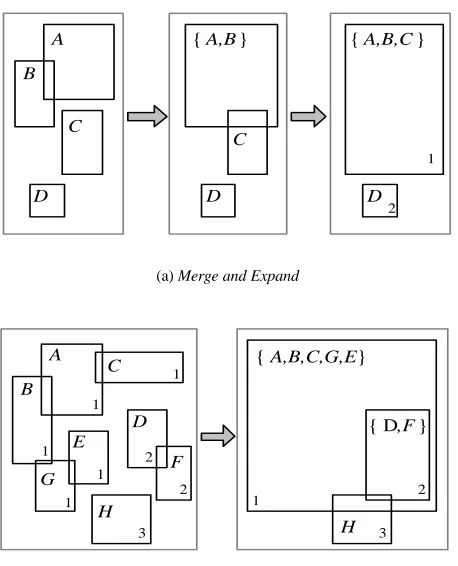
The first algorithm which we call Merge and Expand (M&E) is an iterative technique. ForN
=c
`
-1,
is compared with
. If a merge rule is satisfied, statisti-cal values associated with
and
are combined and a new RMBR is computed. At this instance the total num-ber of network becomes -1,f| =
Wc
d
and
N
=cW
L -1. If
and
does not satisfy the merge rule,
is compared with and so on until
N
= -1. The
pro-cess iteration is performed until no remaining RMBR pair satisfy the merge rule.
The second approach is different from the M&E in the sense that it labels every ‘connected’ RMBR at a first run and merge their properties later at a second run. We name this approach the Label and Merge (L&M) technique. For
N
=c
`
-1,
is compared with
,
,...,
d
any of the RMBR pair satisfy a merge rule, label them with the same label.
Figure 3 illustrates these two algorithms.
A
B
C
D
{ A,B }
C
D
{ A,B,C }
D 1
2
(a) Merge and Expand
A
B
C
{ D,F } { A,B,C,G,E }
G E D F H H 1 1 1 1 1 2 2 3 1 2 3
[image:4.612.57.286.58.341.2](b) Label and Merge
Figure 3. Content merging approaches
4
Merge Rule: Overlap Test
In our scope of work, proximity can be defined several ways. To decide whether two approximations should be merged, there are several decision rules that can be consid-ered . The first being a measure of distance between two approximations and the second being an assessment of log-ical operations between two approximations.
Two approximations should be merged only if the distance between them is below a threshold. Computing distance between two approximations is a straightforward task. The only tricky part of this is to decide on which two points (or more) of the approximations to be used as representative points. The simplest option is the centroid. However, in global terms, finding the right solution is not as simple because with variable number of crack network in an image, it is not as straightforward to determine the optimum distance (threshold) between approximations.
The second technique uses logical operations to de-cide on merging. Two approximations will only be merged if they overlap or intersect. In mathematical terms, refering to Figure ??, we can decide to merge A and B only if A
B 6
.
Why opt for this test? Speed? Simplicity for real-time.
4.1
MBR Overlap Test
Let P,
and P be two sets of corner points for A and B
respectively where: P, =j D 4 D -,. D 4 -,. D u and
P =
j 9 c 4 -,. 4 ,. u .
A and B is merged if one or more of the following condi-tions are met:
c { + D { ,. |4 { 4 9 D { 4 -,. { -,. D { -,. |4 R { 4 ,. D { 4 -,. D { + { ,. D |4 D { 4 { 4 -,. D D { -,. { -,. D |4 D { 4 -,. { 4 -,. D
4.2
RMBR Overlap Test
Let R,
and R be two sets of required parameters of an
RMBR where R, =j _ , U , iU , , 4 , u ,
R =
j
_iU?iU
?
4
?u ,
with _ , U, U ,
and 4
being the axis of minimum
inertia, -centroid, -centroid, RMBR height and RMBR
width respectively. Line intersections and corner points can be calculated from the five parameters using trigono-metric computation. From the 10 parameters of the two RMBRs, 8 corner points and 16 possible line intersections are computed. Let C,
and C be two sets of corner
coordi-nate points for A and B respectively, where
C, =j O , ,? Q O , , Q Ox , , Qu ,
C =
j Ox ] QO Q O L Qu .
Similarly, let I be a set of all possible intersection co-ordinate points between A and B, where
r =j O R Q O R Q O o Y Qu . Using C ,
, C and I we can determine whether A
in-tersects with B by underlining some logical rules.
We conduct tests on an image containing crack pat-terns (as shown in Figure 4) by using the algorithms de-scribed in Section 3 while employing merging rules as ex-plained in Sections 4.1 and 4.2. The results are as shown in Figure 6.
Figure 4. Crack detected image.
(a) MBR MBR (b) RMBR
Figure 5. sub-content before merging approximated by the MBR and the RMBR
other images. As can be seen from Figure ??(a), the small RMBRs are supposed to be merged. They, if grouped will form a unidirectional pattern. However, since their RMBR do not intersect, they are not grouped at this point. The next section explains an approach taken to deal with this situation.
5
Second Stage of Grouping Algorithm
RMBR pairs which are in close proximity with one another have been merged. However, a second stage is still needed in order to group RMBRs which does not conform to the merging rule but still posses great level of similarity with their neighbours.
Based on early experiments, we identify several fea-tures as potentially good descriptors for further grouping. They are the absolute value of the axis of minimum inertia
_
, the dimension ratio , the node density , the y-centroid
U
and the x-centroid U . Assuming that in a crack network,
there are number of nodes or junctions, the node
den-sity = /O h
x4
h
Q while the dimension ratio is the ratio
between the height h
and the width4
h
of an RMBR ex-pressed as =
h
4
h
. These features are arranged as a feature vector, = (U ,U ,
_
, , ) = (
,
,i ,2 ,c ).
5.1
Feature Clustering
Experimentally, every image tested have variable number of RMBRs. The number of feature vectors associated with
(a) M&E MBR (b) M&E RMBR
[image:5.612.58.287.154.255.2](c) L&M MBR (d) L&M RMBR
Figure 6. Results of merging using M&E, L&M ap-proaches with MBR, RMBR merging rules.
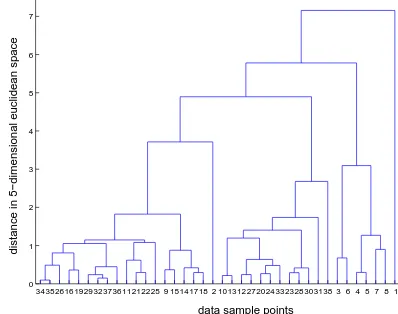
each image depends on the number of RMBR. To demon-strate the effectiveness of the features, we perform a 5-dimensional hierarchical clustering using a variable num-ber of feature vector . The features are first normalized
over all RMBR to produce a mean of zero and standard deviation of zero for each feature element.
Using the euclidean distance as a distance measure we perform hierarchical clustering on the feature points us-ing the complete-link algorithm [12, 13].
A dendrogram corresponding to the hierarchically clustered feature points for the image in Figure 6(a) is as graphically shown in Figure 7.
34352616192932373611212225 9 15141718 2 101312272024332328303138 3 6 4 5 7 8 1 0
1 2 3 4 5 6 7
data sample points
distance in 5−dimensional euclidean space
Figure 7. The dendrogram of the clustered data.
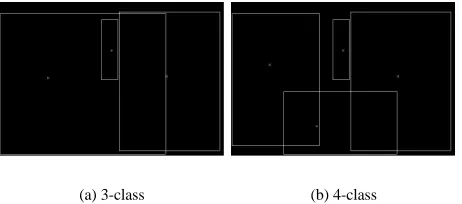
[image:5.612.339.538.475.632.2]ob-jects in the image which is 3 or 4 which then yield the fol-lowing result as illustrated by Figure 8.
[image:6.612.57.288.54.156.2](a) 3-class (b) 4-class
Figure 8. Results after 2nd stage of sub-content grouping
6
Conclusions and Future Work
Perceptual grouping of crack network using a 2-stage ap-proach has been outlined and explained. We have dis-cussed the use of conservative approximation in grouping
crack network in the form of connected curves. We
exper-imented techniques of content merging (i.e the Merge and
Expand (M&E) and the Label and Merge (L&M)) using the
overlapping between pairs of either the Minimum Bounding
Rectangle (MBR) or the Rotated Minimum Bounding Rect-angle (RMBR) as a triggering factor for merging. We also
performed clustering on selected features derived from the RMBR.
Line/curve grouping and classification is an area of re-search which takes quite a lot of attention from rere-searchers. Having said that, looking from a wider scope, with ramifi-cations and improvements our approach can be of benefit not only to this particular area, but also to fields such as data indexing and query/result processing in content-based retrieval systems.
As for the future, we are looking into improving the algorithm by embedding adaptive functionalities in certain parts. Weighted distances can be used in determining the distance between feature points in the second stage of the algorithm. Weights can be assigned to an object based on a characteristic they possess such as their size which in this case the weighting can be proportional to the size. An adaptive way of knowing the optimum number of objects or content in a particular image is also a big challenge at this point. There are quite a number of adaptive clustering techniques with variety of advantages and weaknesses.
We are also still investigating the use of ’fine’ crack
network features aside from the ones discussed in [1] and
[2]. In this paper we experimented using ’coarse’ features which are derived from the conservative approximation, i.e RMBR of a crack network. It is believed, a more detail description of the object of interest might result in a better outcome.
References
[1] F.S. Abas, K. Martinez, Classification of painting cracks for content-based analysis, Proceedings of the
IS&T/SPIE 15th Annual Symposium Electronic Imag-ing: Science and Technology, Santa Clara, USA,
2003.
[2] F.S. Abas, K. Martinez, Craquelure analysis for content-based retrieval, 14th International
Confer-ence on Digital Signal Processing, Santorini, Greece,
2002, 111-114.
[3] S. Bucklow, The description of craquelure patterns,
Studies in Conservation, 42, 1997.
[4] M. Sonka, V. Hlavac, R. Boyle, Image Processing,
Analysis and Machine Vision (London, Chapman &
Hall, 1993).
[5] T. Brinkhoff, H-P. Kriegel, Approximations for a multi-step processing of spatial joins, Geographic
In-formation Systems, International Workshop on Ad-vanced Information Systems, Ascona, Switzerland,
1994, 25-34.
[6] P.L. Rosin, Measuring rectangularity, Machine Vision
and Applications, 11, 1999, 191-196.
[7] A.R. Kelly, E.R. Hancock, Grouping line-segments using eigenclustering, Proceedings of the 11th British
Machine Vision Conference, Bristol, UK, 2000,
586-595.
[8] R.J. Prokop, A.P. Reeves, A survey of moment-based techniques for unoccluded object representation and recognition, Computer Vision, Graphics and Image
Processing, 54(5), 1992, 438-460.
[9] H. Freeman, R. Shapira, Determining the minimum-area encasing rectangle for an arbitrary closed-curve,
Communications of the ACM, 18(7), July 1975,
409-413.
[10] J.D. Foley, A. van Dam , Fundamentals of Interactive
Computer Graphics (Reading, Mass, Addison
Wes-ley, 1982)
[11] Y. Theodoridis, D. Papadias, E.Stenafakis, T. Sel-lis, Direction relations and two-dimensional range queries: Optimization Techniques, Data Knowledge
Engineering, 27(3), 1998.
[12] A.K. Jain, M.N Murty, P.J. Flyn, Data clustering: a review, ACM Computing Surveys, 31(3), September 1999.
[13] A.K. Jain, R.P.W. Duin, J. Mao, Statistical pattern recognition: a review, IEEE Transactions on Pattern
Analysis and Machine Intelligence, 22(1), January