1 Genome-wide association analyses for lung function and chronic obstructive pulmonary disease identify new loci and potential druggable targets
Louise V Wain1,2, Nick Shrine1, María Soler Artigas1, A Mesut Erzurumluoglu1, Boris Noyvert1, Lara Bossini-Castillo3, Ma’en Obeidat4, Amanda P Henry5, Michael A Portelli5, Robert J Hall5, Charlotte K Billington5, Tracy L Rimington5, Anthony G Fenech6, Catherine John1, Tineka Blake1, Victoria E Jackson1, Richard J Allen1, Bram P Prins7, Understanding Society Scientific Group8, Archie Campbell9,10, David J Porteous9,10, Marjo-Riitta Jarvelin11,12,13,14, Matthias Wielscher11, Alan L
James15,16,17, Jennie Hui15,18,19,20, Nicholas J Wareham21, Jing Hua Zhao21, James F Wilson22,23, Peter K Joshi22, Beate Stubbe24, Rajesh Rawal25, Holger Schulz26,27, Medea Imboden28,29, Nicole M Probst-Hensch28,29, Stefan Karrasch26,30, Christian Gieger25, Ian J Deary31,32, Sarah E Harris9,31, Jonathan Marten23, Igor Rudan22, Stefan Enroth33, Ulf Gyllensten33, Shona M Kerr23, Ozren Polasek22,34, Mika Kähönen35, Ida Surakka36,37, Veronique Vitart23, Caroline Hayward23, Terho Lehtimäki38,39, Olli T Raitakari40,41, David M Evans42,43, A John Henderson44, Craig E Pennell45, Carol A Wang45, Peter D Sly46, Emily S Wan47,48, Robert Busch47,48, Brian D Hobbs47,48, Augusto A Litonjua47,48, David W Sparrow49,50, Amund Gulsvik51, Per S Bakke51, James D Crapo52,53, Terri H Beaty54, Nadia N Hansel55, Rasika A Mathias56, Ingo Ruczinski57, Kathleen C Barnes58, Yohan Bossé59,60, Philippe Joubert60,61, Maarten van den Berge62, Corry-Anke Brandsma63, Peter D Paré4,64, Don D Sin4,64, David C Nickle65, Ke Hao66, Omri Gottesman67, Frederick E Dewey67, Shannon E Bruse67, David J Carey68, H Lester Kirchner68, Geisinger-Regeneron DiscovEHR Collaboration8, Stefan Jonsson69, Gudmar Thorleifsson69, Ingileif Jonsdottir69,70, Thorarinn Gislason70,71, Kari Stefansson69,70, Claudia Schurmann72,73, Girish Nadkarni72, Erwin P Bottinger72, Ruth JF Loos72,73,74, Robin G Walters75, Zhengming Chen75, Iona Y Millwood75,76, Julien Vaucher75, Om P Kurmi75, Liming Li77,78, Anna L Hansell79,80, Chris Brightling2,81, Eleftheria Zeggini7, Michael H Cho47,48, Edwin K Silverman47,48, Ian Sayers5, Gosia Trynka3, Andrew P Morris82, David P Strachan83, Ian P Hall5 & Martin D Tobin1,2
Corresponding authors: Louise V. Wain ([email protected]), Ian P. Hall ([email protected]) and Martin D. Tobin ([email protected]) 1. Department of Health Sciences, University of Leicester, Leicester, UK
2. National Institute for Health Research, Leicester Respiratory Biomedical Research Unit, Glenfield Hospital, Leicester, UK
3. Wellcome Trust Sanger Institute, Hinxton, Cambridge, UK
4. The University of British Columbia Centre for Heart Lung Innovation, St Paul’s Hospital, Vancouver, BC, Canada
5. Division of Respiratory Medicine, University of Nottingham, Nottingham, UK
6. Department of Clinical Pharmacology and Therapeutics, University of Malta, Msida, Malta 7. Department of Human Genetics, Wellcome Trust Sanger Institute, United Kingdom 8. A list of contributors can be found in the Supplementary Appendix
9. Medical Genetics Section, Centre for Genomic and Experimental Medicine, Institute of Genetics and Molecular Medicine, University of Edinburgh, Edinburgh, EH4 2XU, UK
10. Generation Scotland, Centre for Genomic and Experimental Medicine, University of Edinburgh, Edinburgh, EH4 2XU, UK
11. Department of Epidemiology and Biostatistics, MRC–PHE Centre for Environment & Health, School of Public Health, Imperial College London, London, UK
2 13. Biocenter Oulu, University of Oulu, Finland.
14. Unit of Primary Care, Oulu University Hospital, Oulu, Finland
15. Busselton Population Medical Research Institute, Sir Charles Gairdner Hospital, Nedlands WA 6009, Australia
16. Department of Pulmonary Physiology and Sleep Medicine, Sir Charles Gairdner Hospital, Nedlands WA 6009, Australia
17. School of Medicine and Pharmacology, The University of Western Australia, Crawley 6009, Australia
18. School of Population Health, The University of Western Australia, Crawley WA 6009, Australia 19. PathWest Laboratory Medicine of WA, Sir Charles Gairdner Hospital, Crawley WA 6009, Australia 20. School of Pathology and Laboratory Medicine, The University of Western Australia, Crawley WA 6009, Australia
21. MRC Epidemiology Unit, University of Cambridge School of Clinical Medicine, Box 285 Institute of Metabolic Science, Cambridge Biomedical Campus, Cambridge CB2 0QQ
22. Centre for Global Health Research, Usher Institute for Population Health Sciences and Informatics, University of Edinburgh, Edinburgh, Scotland
23. Medical Research Council Human Genetics Unit, Institute of Genetics and Molecular Medicine, University of Edinburgh, Edinburgh EH4 2XU, UK
24. Department of Internal Medicine B – Cardiology, Intensive Care, Pulmonary Medicine and Infectious Diseases, University Medicine Greifswald, Ferdinand-Sauerbruch-Straße, 17475 Greifswald, Germany
25. Department of Molecular Epidemiology, Institute of Epidemiology II, Helmholtz Zentrum Muenchen – German Research Center for Environmental Health, Neuherberg, Germany 26. Institute of Epidemiology I, Helmholtz Zentrum Muenchen – German Research Center for Environmental Health, Neuherberg, Germany
27. Comprehensive Pneumology Center Munich (CPC-M), Member of the German Center for Lung Research, Neuherberg, Germany
28. Swiss Tropical and Public Health Institute, Basel, Switzerland 29. University of Basel, Switzerland
30. Institute and Outpatient Clinic for Occupational, Social and Environmental Medicine, Ludwig-Maximilians-Universität, Munich, Germany
31. Centre for Cognitive Ageing and Cognitive Epidemiology, University of Edinburgh, Edinburgh EH8 9JZ, UK
32. Department of Psychology, University of Edinburgh, Edinburgh, EH8 9JZ, UK
33. Department of Immunology, Genetics and Pathology, Uppsala Universitet, Science for Life Laboratory, Husargatan 3, Uppsala, SE-75108, Sweden
34. University of Split School of Medicine, Split, Croatia
35. Department of Clinical Physiology, University of Tampere and Tampere University Hospital, Tampere, Finland
36. Institute for Molecular Medicine Finland (FIMM), University of Helsinki, Helsinki, Finland 37. The National Institute for Health and Welfare (THL), Helsinki, Finland
38. Department of Clinical Chemistry, Fimlab Laboratories and School of Medicine University of Tampere, Tampere Finland.
3 40. Department of Clinical Physiology and Nuclear Medicine, Turku University Hospital, Turku 20521, Finland
41. Research Centre of Applied and Preventive Cardiovascular Medicine, University of Turku, Turku 20520, Finland
42. University of Queensland Diamantina Institute, Translational Research Institute, University of Queensland, Brisbane, Queensland, Australia
43. MRC Integrative Epidemiology Unit, University of Bristol, Bristol, UK 44. School of Social and Community Medicine, University of Bristol, Bristol, UK 45. School of Women’s and Infants’ Health, The University of Western Australia 46. Child Health Research Centre, Faculty of Medicine, The University of Queensland
47. Channing Division of Network Medicine, Brigham and Women’s Hospital, Boston, MA, USA 48. Division of Pulmonary and Critical Care Medicine, Brigham and Women’s Hospital, Boston, MA, USA
49. VA Boston Healthcare System, Boston, MA, USA
50. Department of Medicine, Boston University School of Medicine, Boston, MA USA 51. Department of Clinical Science, University of Bergen, Norway
52. National Jewish Health, Denver, CO, USA
53. Division of Pulmonary, Critical Care and Sleep Medicine, National Jewish Health, Denver, CO, USA 54. Department of Epidemiology, Johns Hopkins University School of Public Health, Baltimore, M.D., USA 21205
55. Pulmonary and Critical Care Medicine, School of Medicine, Johns Hopkins University, Baltimore, MD, USA
56. Division of Allergy and Clinical Immunology, School of Medicine, Johns Hopkins University, Baltimore, MD, USA
57. Department of Biostatistics, Bloomberg School of Public Health, Johns Hopkins University, Baltimore, MD, USA
58. Division of Biomedical Informatics and Personalized Medicine, Department of Medicine, University of Colorado School of Medicine, Anschutz Medical Campus, Aurora, CO, USA 59. Department of Molecular Medicine, Laval University, Québec, Canada
60. Institut universitaire de cardiologie et de pneumologie de Québec, Laval University, Québec, Canada
61. Department of Molecular Biology, Medical Biochemistry, and Pathology, Laval University, Québec, Canada
62. University of Groningen, University Medical Center Groningen, Department of Pulmonology, GRIAC Research Institute, University of Groningen, Groningen, The Netherlands
63. University of Groningen, University Medical Center Groningen, Department of Pathology and Medical Biology, GRIAC Research Institute, University of Groningen, Groningen, The Netherlands 64. Respiratory Division, Department of Medicine, University of British Columbia, Vancouver, BC, Canada
65. Merck Research Laboratories, Genetics and Pharmacogenomics, Boston, MA, USA
66. Icahn Institute of Genomics and Multiscale Biology, Icahn School of Medicine at Mount Sinai, New York, NY, USA
67. Regeneron Genetics Center, Regeneron Pharmaceuticals, Tarrytown, New York, USA 68. Geisinger Health System, Danville, PA, USA
4 70. Faculty of Medicine, School of Health Sciences, University of Iceland, Reykjavik, Iceland
71. Department of Respiratory Medicine and Sleep, Landspitali University Hospital Reykjavik, Reykjavik, Iceland
72. The Charles Bronfman Institute for Personalized Medicine, The Icahn School of Medicine at Mount Sinai, New York, NY, USA
73. The Genetics of Obesity and Related Metabolic Traits Program, The Icahn School of Medicine at Mount Sinai, New York, NY, USA
74. The Mindich Child Health Development Institute, The Icahn School of Medicine at Mount Sinai, New York, NY, USA
75. Clinical Trial Service Unit & Epidemiological Studies Unit (CTSU), Nuffield Department of Population Health, University of Oxford, Oxford, UK
76. Medical Research Council Population Health Research Unit at the University of Oxford, Oxford, UK
77. Chinese Academy of Medical Sciences, Dong Cheng District, Beijing 100730, China
78. Department of Epidemiology and Biostatistics, Peking University Health Science Centre, Peking University, Beijing 100191, China
79. UK Small Area Health Statistics Unit, MRC-PHE Centre for Environment and Health, School of Public Health, Imperial College London, London, UK
80. Imperial College Healthcare NHS Trust, St Mary’s Hospital, Paddington, London, UK
81. Department of Infection, Inflammation and Immunity, Institute for Lung Health, University of Leicester, Leicester, UK
82. Department of Biostatistics, University of Liverpool, Liverpool, UK
5 Abstract
Chronic Obstructive Pulmonary Disease (COPD) is characterised by reduced lung function and is the third leading cause of death globally. Through genome-wide association discovery in 48,943
6 Main text
Maximally attained lung function and subsequent lung function decline together determine the risk of developing Chronic Obstructive Pulmonary Disease (COPD)1,2. COPD, characterised by irreversible airflow obstruction and chronic airway inflammation, is the third leading cause of death globally3. Smoking is the primary risk factor for COPD but not all smokers develop COPD and more than 25% of COPD cases occur in never-smokers4. Patients with COPD exhibit variable presentation of symptoms and pathology, with or without exacerbations, with variable amounts of emphysema and with differing rates of progression. Although risk factors for COPD are known, including smoking and environmental exposures in early5,6 and later life, the causal mechanisms are not well understood7. Disease-modifying treatments for COPD are required7.
Understanding genetic factors associated with reduced lung function and COPD susceptibility could inform drug target identification, risk prediction and stratified prevention or treatment. Previous genome-wide association studies (GWAS) of COPD identified several independent COPD-associated variants8-10 but the rate and scale of discovery has been limited by available sample sizes. We conducted a powerful GWAS for lung function, and followed up the robustly-associated variants in COPD case-control studies. Although previous GWAS have reported genome-wide significant
associations with lung function11-16, there has not been a comprehensive study confirming the effect of these variants on COPD susceptibility. In this study, we hypothesised that: (i) undertaking GWAS of lung function of unprecedented power and scale would detect novel loci associated with
quantitative measures of lung function; (ii) collectively these variants would be associated with the risk of developing COPD, and (iii) aggregate analyses of all novel and previously-reported signals of association, and the identification of genes through which their effects are mediated, would reveal further insight into biological mechanisms underlying the associations. Together these findings could provide potential novel targets17 for therapeutic intervention and pinpoint existing drugs which could be candidates for repositioning18 for the treatment of COPD.
Results
43 new signals for lung function
For stage 1, genome-wide association analyses of forced expired volume in 1 second (FEV1), forced vital capacity (FVC) and FEV1/FVC were undertaken in 48,943 individuals from the UK BiLEVE study16 who were selected from the extremes of the lung function distribution in UK Biobank (total
n=502,682). From analysis of 27,624,732 variants, 81 independent variants associated with one or more traits with P<5x10⁻⁷ were selected for follow-up in stage 2, consisting of a further 95,375 independent individuals from UK Biobank, the SpiroMeta consortium and UK Households
Longitudinal Study (UKHLS) (Supplementary Table 1). No evidence of sample overlap between stage 1 and stage 2 studies or between stage 2 studies was identified using LD score regression
(Supplementary Table 2). Following meta-analysis of stage 1 and stage 2 results, 43 signals showed genome-wide significant (P<5x10⁻⁸) association with one or more of FEV1, FVC or FEV1/FVC (Table 1, Supplementary Table 3 and Supplementary Figure 1). We report these 43 signals as novel
7 novel loci whilst 10 were statistically independent signals (conditional P<5x10⁻⁷) within 500kb of another association signal. Based on an assumed heritability of 40%19,20 for each lung function trait, the novel signals explained 4.3% of the heritability of FEV1, 3.2% for FVC and 5.2% for FEV1/FVC bringing the total heritability explained by the 97 signals to 9.6%, 6.4% and 14.3%, respectively. The estimated effect sizes of lung function associated variants in children were correlated with those in adults (r=0.65, 73 variants with high imputation quality, Supplementary Figure 2). A genetic risk score based on these 73 variants, was also significantly associated with FEV1 and FEV1/FVC in children, (per risk allele β (s.e.) = -0.0177 (0.0040), P=1.03x10⁻⁵ and per risk allele β (s.e.) = -0.0213 (0.0037), P=1.27x10⁻⁸, respectively), but not with FVC (per risk allele β (s.e.) = -0.0037 (0.0041), P=0.366).
Using the stage 1 results, a 95% ‘credible set’ of variants (i.e. the set of variants that were 95% likely to contain the underlying causal variant, based on Bayesian refinement) was defined for all (novel and previously reported) association signals for which this was feasible (67 signals, Online Methods Supplementary Figures 3, 4 and 5 and Supplementary Table 5); 13 of these signals were fine-mapped to <=10 plausible causal variants and for 63 of the 67 signals fine-fine-mapped, the sentinel (lowest P value) variant was also the top ranked variant by posterior probability. In addition, by refining six chromosome 6 MHC region association signals using imputation of classical alleles and amino acid changes (Online methods), we identified the MHC class II DQB1 gene product, HLA-DQβ1, amino acid change at position 57 (alanine compared to non-alanine) as the main driver of signals in the MHC region for both FEV1 (β (s.e.) = 0.048 (0.007), P=5.71×10⁻¹³, Supplementary Figure 6a) and FEV1/FVC (β (s.e.) = 0.062 (0.007), P=1.17×10⁻²⁰,Supplementary Figure 6c) with secondary non-HLA gene signals in the MHC region remaining after conditioning on the HLA-DQβ1 position 57 variant for rs34864796:G>A (near ZKSCAN3, FEV1; conditional β (s.e.) = -0.058 (0.01), P=1.26x10⁻⁹, Supplementary Figure 6b) and rs2070600:C>T (in AGER, FEV1/FVC; conditional β (s.e.) = 0.120 (0.013), P=4.23x10⁻²⁰, Supplementary Figure 6d), (Supplementary Table 6).
We identified that 29 of the lung function-associated signals had previously shown genome-wide significant association in GWAS of traits other than lung function or COPD. This included associations with inflammatory bowel disease (Crohn’s disease and/or ulcerative colitis, 3 signals) and height (9 signals, 3 of which showed a consistent direction of effect on height and the lung function measure with which they were most strongly associated) (Supplementary Table 7). With the exception of
KANSL116, there was no significant (P<5.15x10⁻⁴) association with smoking for any of the signals (Supplementary Table 8).
95 variants and COPD susceptibility
8 moderate-severe cases, 3,950 controls), two studies within which COPD was determined from electronic medical records30 (eMR, total 1,487 cases, 15,138 controls), additional UK Biobank samples (COPD definition based on spirometry, 984 moderate-severe31 cases and 26,561 controls) and UK BiLEVE (COPD definition based on spirometry, 9,563 moderate-severe cases, 27,387 controls). UK BiLEVE COPD cases and controls were only used for single variant COPD association tests for the subset of 47 variants discovered independently from UK BiLEVE (that is excluding the 43 variants discovered using the UK BiLEVE data described in this paper and 5 variants reported in our previous study in the UK BiLEVE population16). Across all 95 variants, 51 showed nominal COPD association (P<0.05) and 30 showed associations with COPD susceptibility reaching a Bonferroni corrected threshold for 95 tests (P<5.26x10⁻⁴, Supplementary Table 10). Of these 30, 27 were variants discovered independently from UK BiLEVE and 3 were from the 48 lower powered association tests not including UK BiLEVE cases and controls.
Using a risk score based on the available 95 sentinel variants or their best proxies, and using data from up to 9791 COPD cases and 120,462 controls (Online Methods), for the meta-analysis the OR (95% CI) per standard deviation change in risk score (~6 alleles) was 1.24 (1.20-1.27), P=5.05x10-49 (Figure 2a, Supplementary Table 11). We observed considerable heterogeneity in effect estimates between the different COPD studies (I2=92%) which had different approaches to ascertainment of COPD cases and variable disease severity. In UK Biobank (including UK BiLEVE) we found broadly similar effect size estimates of moderate-severe COPD to those in COPD case-control studies employing post-bronchodilator spirometry (OR=1.42 versus 1.36) and therefore we undertook further modelling showing a gradation in susceptibility to moderate-severe COPD across deciles of allelic risk score (Online Methods). The risk of moderate-severe COPD was more than three times higher in the top decile than the bottom decile (OR 3.71, 95% CI 3.33 to 4.12, Figure 2b). The estimated proportion of COPD cases attributable to allelic risk scores above the first decile (population attributable risk fraction) was 48.0% (95% CI 43.6 to 52.2%).
We tested association of individual variants and the 95-variant risk score with COPD exacerbations in subsets of individuals from UK Biobank, deCODE, four COPD case-control studies and two eMR studies (total 2,462 COPD exacerbation cases, 15,288 COPD non-exacerbation controls) and the Lung Health Study (100 exacerbation cases, 4,002 controls). There was no association of individual
variants or genetic risk score with acute exacerbations of COPD (Supplementary Tables 12 and 13). To evaluate whether these variants showed disease-relevant associations in a non-European population, we studied 71 variants for which data were available in 7,116 COPD cases (20,919 controls) and 5,292 exacerbation cases (1,824 controls) from the China Kadoorie Biobank cohort (CKB) (Supplementary Tables 10 to 13). The allelic risk score was associated with COPD susceptibility (OR per standard deviation change in risk score (95% CI) = 1.08 (1.04-1.11), P=4.2x10⁻⁶) suggesting some shared genetic contributions to COPD in European and East Asian descent populations. Thirty-nine of the variants showed a consistent direction of effect on COPD in European and Chinese samples and seven of these were significant (P<0.05). Two signals were significant after correction for multiple testing (Supplementary Table 10c).
self-9 reported doctor-diagnosed asthma and show that the effect size estimates were similar
(Supplementary Figure 7).
Implicated genes highlight pathways and druggable targets
Gene expression and genotype data from lung, blood and multi-tissue resources were queried to identify whether the top variant at each of the 97 signals, or a proxy, were significantly associated with changes in expression of any gene (i.e. were an eQTL for any gene). Using this approach, and identification of deleterious variants within the association signal (Online methods, Supplementary Table 14), we implicated 234 genes with potentially causal effects on lung function (Supplementary Table 15). These 234 genes were enriched (False Discovery Rate (FDR) ≤5%) in elastic fibre pathways and in “signalling events mediated by the Hedgehog family”, the latter including CDON implicated by a novel intergenic signal (rs567508, between CDON and RPUSD4) on chromosome 11. We narrowed this group of 234 genes to 68 high-priority genes which were implicated via a deleterious variant or on stricter criteria for gene expression co-localisation (sentinel variant and top expression variant r2≥0.9, Table 2). We found that the 68 high-priority genes were overrepresented (FDR≤5%) among a number of gene ontology terms including SH3 domain binding, GTPase binding, actin binding and fibroblast migration (Supplementary Table 16). Alternative approaches to pathway analyses, which instead use all genome-wide association results, supported previous reports of enrichment of histone and systemic lupus erythematosus pathways14-16 and additional autoimmune and inflammatory pathways (Supplementary Table 17). Tests for tissue-specific enrichment of lung function signals overlapping histone marks identified enrichment in fetal lung, fetal heart and fibroblasts (H3K4me1), and stomach smooth muscle (H3K4me1 and H3K4me3) (Supplementary Table 18).
Approved drugs, or drugs in development, target the protein products of 7 of the 234 genes
(Supplementary Table 19a). This includes 3 high-priority genes CHRM3, SLC6A4 and CRHR1. CHRM3 and SLC6A4 were both implicated by novel signals (rs6688537:C>A in an intron of CHRM3 and rs59835752:-/A in an intron of EFCAB5) and encode targets for drugs approved for the treatment of asthma and COPD (CHRM3, muscarinic acetylcholine receptor M3) and anxiety and depression (SLC6A4, serotonin transporter). CRHR1 (implicated by rs35524223:T>A in an intron of KANSL1) encodes the corticotropin releasing factor receptor 1 which is a target for compounds in
development for the treatment of anxiety, depression and irritable bowel syndrome. The other 4 genes include NDUFA12 (implicated by rs113745635:C>T in an intron of FGD6) encoding an NADH dehydrogenase which is a target for metformin hydrochloride, primarily used to treat type 2 diabetes, and ITK (implicated by rs10515750 in an intron of CYFIP2) encoding a tyrosine-protein kinase, a target for the cancer drug Pazopanib.
10 Discussion
In this study, the power gained by sampling from the extremes of a large biobank whilst retaining the power of a quantitative trait analysis, coupled with strategies to improve coverage of the genome and extensive follow-up, enabled a near-doubling of the number of signals of association with lung function identified to date. We further explored 95 variants, representing 43 novel signals and 52 previously reported signals, and showed that collectively these variants are strongly
associated with COPD susceptibility.
Using functional evidence from eQTL studies and deleterious variants to link signals to genes, we identified that 41 of the 97 lung function signals are also the strongest signals of association for expression of, or contain deleterious variants within, 68 genes (which we term “high-priority genes”). Amongst these, novel signals in or near FAM13A and ADAM19, both previously associated with lung function and COPD susceptibility9,33, along with evidence that these signals are themselves eQTLs for FAM13A and ADAM19, provide further evidence for FAM13A and ADAM19 themselves being the drivers of those signals. There was significant enrichment amongst the 68 genes for SH3 domain (including ADAM19), GTPase and actin binding, and fibroblast migration, highlighting the potential importance of pathways relating to the cytoskeleton.
The 68 genes identified as high-priority included genes at novel signals encoding targets for which there are approved drugs or drugs in development (Supplementary Table 19). Of note, the muscarinic acetylcholine receptor M3, encoded by CHRM3, is a well-characterised drug target for which many approved drugs exist, including for the treatment of asthma and obstructive lung disease. SLC6A4 encodes a serotonin transporter, a target for a number of drugs approved for treating depression and anxiety disorders, one of which (nortriptyline hydrochloride) has been trialed for use in inflammatory skin disorders (psoriasis and eczema); HTR4, which encodes a serotonin receptor, was identified in one of the earliest lung function GWAS13. INPP5E, identified as a high-priority gene for a novel signal of association with FVC (and FEV1) on chromosome 9, encodes inositol polyphosphate-5-phosphatase E, a component of the inositol phosphate metabolism pathway. Another component of the same pathway, phosphoinositide 3-kinase (PI3K) delta is a target of drugs under development for the treatment of a range of indications including COPD and asthma. Mutations in INPP5E cause ciliopathy (Joubert and MORM syndromes).
Protective genetic variants that reduce the function or expression of a target protein could be mimicked by drugs and so are of particular interest. The minor allele (MAF 17%) at the novel signal in an intron of FAM13A was associated with decreased expression of FAM13A in lung tissue and
reduced risk of COPD. This, together with recent evidence from a study of the Fam13a knockout mouse34, suggests that pharmacological inhibition of FAM13A may be protective.
Extending our pathway analyses to all 234 genes implicated by gene expression or deleterious variants, we observed enrichment of genes related to “signalling events mediated by the Hedgehog family” pathway. Hedgehog signalling plays a crucial role in early development. Three members of this pathway, PTCH1, TGFB2 and HHIP, have been previously reported as likely causal genes
11 correlation apply across all 97 lung-function-associated variants, then this would suggest that many of these variants may act, at least in part, via effects on lung development. Elastic fibre pathways were over-represented; products of elastin degradation have been shown to be elevated during acute exacerbations of COPD 36,37. In addition, degradation of elastin by excess neutrophil-released elastase in the lung leads to emphysema in individuals with alpha-1 antitrypsin deficiency. CARD9, another high-priority gene at a novel signal, encodes an adaptor protein involved in neutrophil recruitment in respiratory fungal infection38. Tissue-specific enrichment of lung function signals overlapping H3K4me1 was seen in stomach smooth muscle. Although comparable H3K4me1 data were not available for airway smooth muscle, similar findings have been reported previously for rectal smooth muscle39.
The 17q21.31 inversion has previously been associated with lung function. Custom imputation of additional structural variation at the locus, along with eQTL evidence and deleterious variants in the gene, suggested that KANSL1 may drive the association. Amongst the novel signals reported in this study, SNPs in an intron of EEFSEC on chromosome 3 are correlated with expression of nearby gene
RUVBL1. Both KANSL1 and RUVBL1 encode members of histone modification complexes.
A novel signal on chromosome 20 (rs72448466, intronic in ZGPAT), which showed association with FVC almost as strong as its association with FEV1, is an eQTL for the telomere gene, RTEL1. Although rs72448466:->GT was not the strongest eQTL for RTEL1 (r2=0.6 with the top eQTL variant), RTEL1 is of interest as it has recently been implicated in familial pulmonary fibrosis40. Variant rs72448466 has also been associated with inflammatory bowel disease, prostate cancer and atopic dermatitis. Our implication of genes of potential functional relevance to the 97 signals was based on gene expression data (eQTL) and associated deleterious variants within a gene. Although eQTL evidence currently gives the best in silico indication of which gene (or genes) might be functionally relevant to a signal, conclusive evidence for a causal relationship between SNP genotype and gene expression can only be obtained through direct molecular experiments.
Six signals of association have been previously identified within the HLA region. Using a custom imputation approach, we identified the presence of alanine (compared to aspartic acid, valine or serine) at amino acid position 57 in HLA-DQβ1 as associated with decreased lung function and the main driver of signals in this region. The presence of alanine is also strongly associated with risk of type 1 diabetes41.
The three lung function traits we studied are correlated. The overall and genetic correlations were: 0.88 and 0.87 between FEV1 and FVC; 0.46 vs 0.35 between FEV1 and FEV1/FVC and; 0.038 and -0.17 between FVC and FEV1/FVC (transformed traits, as studied in UK Biobank and SpiroMeta15,
respectively). One might expect variants showing strongest association with FEV1 and FEV1/FVC to be of greatest relevance for COPD and genetic correlations of -0.76 and -0.9 have been reported
between COPD and FEV1 and FEV1/FVC, respectively42. We show, however, that variants associated with one of these traits also tend to be associated with one of the other two lung function traits studied (for example, all but 2 signals for FVC are also associated (P<0.05) with FEV1, Supplementary Table 4). Although classification of COPD in UK Biobank was based on pre-bronchodilator
12 potential winner’s curse bias for the 48 variants discovered using UK BiLEVE, we excluded UK BiLEVE from individual variant analyses. However, this excluded 9,563 moderate to severe COPD cases, and therefore the significance of COPD association tests for these variants should be interpreted with caution. Notably, we found effect size estimates only slightly smaller in deeply-characterised COPD case-control studies than in UK Biobank (OR per SD change in allelic risk score 1.36 compared to 1.42). Whilst we show an appreciable proportion of COPD cases could be attributable to allelic risk scores above the first decile, great caution must be exercised in interpretation of population
attributable risk fraction estimates given considerations of shared etiologic responsibility44. The lung function-associated variants we report were not associated with acute exacerbations of COPD. Although more powerful studies of exacerbations will be required, this suggests that different genetic mechanisms could underlie risk of acute exacerbations.
A threshold of P<5x10⁻⁸ is a valid threshold for genome-wide significance in GWAS analyses of common variants45. Our genotyping and imputation strategy resulted in testing of 27.6 million variants of which 21.6 million had MAF<5% and 18.2 million had MAF<1%. Although all of our 43 signals were common, had we adopted a stricter threshold for genome-wide significance, for example, P<1x10⁻⁸ (recommended in a recent report of significance thresholds in whole genome sequencing45), only two of our signals (rs10246303:A>T in the 3’ UTR of C1GALT1 on chromosome 7, and rs1698268:A>T near LINC00911 on chromosome 14) would not have reached significance. Thirty-nine of the 43 signals were additionally supported by statistically significant independent replication in stage 2 (P<0.05/43, Supplementary Table 3).
13 URLs
UK Biobank genetic data release http://www.ukbiobank.ac.uk/scientists-3/genetic-data/ LD Score regression, Broad Institute http://www.broadinstitute.org/~bulik/eur_ldscores/ DATA AVAILABILITY STATEMENT
The stage 1 (UK BiLEVE) genome-wide association results for FEV1, FVC and FEV1/FVC are available from UK Biobank at http://www.ukbiobank.ac.uk/. The sources of all other data utilised in this study can be found in the Online Methods and Supplementary Note.
ACKNOWLEDGEMENTS
This work was funded by a Medical Research Council (MRC) strategic award to M.D. Tobin, I.P. Hall, D. Strachan and L.V. Wain (MC_PC_12010). This research has been conducted using the UK Biobank Resource under Application Number 648. This article presents independent research funded partially by the National Institute for Health Research (NIHR). The views expressed are those of the author(s) and not necessarily those of the NHS, the NIHR or the Department of Health. This research used the ALICE and SPECTRE High Performance Computing Facilities at the University of Leicester. Additional acknowledgements and funding can be found in the Supplementary Information.
AUTHOR CONTRIBUTIONS
L.V.W., D.J.P., M.J., A.L.J., N.J.W., J.F.W., B.S., H.S., N.M.P., S.K., C.G., I.J.D., I.Rudan, S.M.K., O.P., M.K., C.H., T.L., O.T.R., A.J.H., C.E.P., P.D.S., A.G., P.S.B., J.D.C., T.H.B., N.N.H., R.A.M., I.Ruczinski, K.C.B., Y.B., P.J., P.D.P., D.D.S., K.H., E.P.B., R.JF.L., R.G.W., Z.C., I.Y.M., L.L., E.Z., I.Sayers, D.P.S., I.P.H. and M.D.T. contributed to the conception and study design.
L.V.W., N.S., M.S., A.M.E., B.N., L.B., M.O., A.P.H., M.A.P., R.J.H., C.K.B., T.L.R., A.G.F., C.J., T.B., V.E.J., R.J.A., B.P.P., A.C., M.W., J.H., J.Z., P.K.J., B.S., R.R., M.I., N.M.P., S.E.H., J.M., S.E., I.Surakka, V.V., C.H., T.L., D.M.E., C.A.W., E.S.W., R.B., B.D.H., A.A.L., D.W.S., M.v.d.B, C.Brandsma, D.C.N., O.G., F.E.D., S.E.B., D.J.C., H.L.K., S.J., G.Thorleifsson, I.J., T.G., K.S., C.S., G.N., R.G.W., J.V., O.P.K., M.H.C., E.K.S., G.Trynka and D.P.S. contributed to data analysis.
L.V.W., N.S., M.S., A.M.E., B.N., M.O., A.P.H., M.A.P., R.J.H., C.K.B., T.L.R., A.G.F., C.J., V.E.J., A.C., M.J., B.S., R.R., H.S., M.I., N.M.P., S.K., C.G., C.H., A.G., C.S., G.N., R.JF.L., A.L.H., C.Brightling, I.Sayers, A.P.M., D.P.S., I.P.H. and M.D.T. contributed to data interpretation.
COMPETING FINANCIAL INTERESTS STATEMENT
15 References
1. Fletcher, C. & Peto, R. The natural history of chronic airflow obstruction. Br Med J 1, 1645-8 (1977).
2. Lange, P., Celli, B. & Agusti, A. Lung-Function Trajectories and Chronic Obstructive Pulmonary Disease. N Engl J Med 373, 1575 (2015).
3. Lozano, R. et al. Global and regional mortality from 235 causes of death for 20 age groups in 1990 and 2010: a systematic analysis for the Global Burden of Disease Study 2010. Lancet 380, 2095-128 (2012).
4. Salvi, S.S. & Barnes, P.J. Chronic obstructive pulmonary disease in non-smokers. Lancet 374, 733-43 (2009).
5. Melen, E. Bridging genetics, epidemiology, and respiratory medicine. Am J Respir Crit Care
Med 190, 716-8 (2014).
6. Svanes, C. et al. Early life origins of chronic obstructive pulmonary disease. Thorax 65, 14-20 (2010).
7. ATS/ERS Task Force for COPD Research. An official American Thoracic Society/European Respiratory Society statement: research questions in COPD. Eur Respir J 45, 879-905 (2015). 8. Pillai, S.G. et al. A genome-wide association study in chronic obstructive pulmonary disease
(COPD): identification of two major susceptibility loci. PLoS Genet 5, e1000421 (2009). 9. Cho, M.H. et al. Variants in FAM13A are associated with chronic obstructive pulmonary
disease. Nat Genet 42, 200-2 (2010).
10. Cho, M.H. et al. Risk loci for chronic obstructive pulmonary disease: a genome-wide association study and meta-analysis. Lancet Respir Med 2, 214-25 (2014).
11. Hancock, D.B. et al. Meta-analyses of genome-wide association studies identify multiple loci associated with pulmonary function. Nat Genet 42, 45-52 (2010).
12. Loth, D.W. et al. Genome-wide association analysis identifies six new loci associated with forced vital capacity. Nat Genet 46, 669-77 (2014).
13. Repapi, E. et al. Genome-wide association study identifies five loci associated with lung function. Nat Genet 42, 36-44 (2010).
14. Soler Artigas, M. et al. Genome-wide association and large-scale follow up identifies 16 new loci influencing lung function. Nat Genet 43, 1082-90 (2011).
15. Soler Artigas, M. et al. Sixteen new lung function signals identified through 1000 Genomes Project reference panel imputation. Nat Commun 6, 8658 (2015).
16. Wain, L.V. et al. Novel insights into the genetics of smoking behaviour, lung function, and chronic obstructive pulmonary disease (UK BiLEVE): a genetic association study in UK Biobank. Lancet Respir Med 3, 769-81 (2015).
17. Nelson, M.R. et al. The support of human genetic evidence for approved drug indications.
Nat Genet 47, 856-60 (2015).
18. Sanseau, P. et al. Use of genome-wide association studies for drug repositioning. Nat
Biotechnol 30, 317-20 (2012).
19. Palmer, L.J. et al. Familial aggregation and heritability of adult lung function: results from the Busselton Health Study. European Respiratory Journal 17, 696 -702 (2001).
20. Wilk, J.B. et al. Evidence for major genes influencing pulmonary function in the NHLBI family heart study. Genet Epidemiol 19, 81-94 (2000).
21. Weiss, S.T. Lung function and airway diseases. Nat Genet 42, 14-6 (2010).
22. Gudbjartsson, D.F. et al. Large-scale whole-genome sequencing of the Icelandic population.
Nat Genet 47, 435-44 (2015).
16 24. Lamontagne, M. et al. Refining susceptibility loci of chronic obstructive pulmonary disease
with lung eqtls. PLoS One 8, e70220 (2013).
25. Obeidat, M. et al. GSTCD and INTS12 Regulation and Expression in the Human Lung. PLoS
ONE 8(2013).
26. Regan, E.A. et al. Genetic epidemiology of COPD (COPDGene) study design. COPD 7, 32-43 (2010).
27. Vestbo, J. et al. Evaluation of COPD Longitudinally to Identify Predictive Surrogate End-points (ECLIPSE). Eur Respir J 31, 869-73 (2008).
28. Fishman, A. et al. A randomized trial comparing lung-volume-reduction surgery with medical therapy for severe emphysema. N Engl J Med 348, 2059-73 (2003).
29. Bell, B., Rose, C. L. & Damon, H. The Normative Aging Study: an interdisciplinary and longitudinal study of health and aging. Aging Hum Dev 3, 5–17 (1972).
30. Dewey, F.E. et al. Inactivating Variants in ANGPTL4 and Risk of Coronary Artery Disease. N
Engl J Med 374, 1123-33 (2016).
31. Global Initiative for Chronic Obstructive Lung Disease. Global Strategy for the Diagnosis Management and Prevention of COPD. http://goldcopd.org/ (2015).
32. Szklarczyk, D. et al. STRING v10: protein-protein interaction networks, integrated over the tree of life. Nucleic Acids Res 43, D447-52 (2015).
33. Wilk, J.B. et al. Genome-wide association studies identify CHRNA5/3 and HTR4 in the development of airflow obstruction. American Journal of Respiratory and Critical Care
Medicine 186, 622-632 (2012).
34. Jiang, Z. et al. A Chronic Obstructive Pulmonary Disease Susceptibility Gene, FAM13A, Regulates Protein Stability of beta-catenin. Am J Respir Crit Care Med (2016).
35. Obeidat, M. et al. Molecular mechanisms underlying variations in lung function: A systems genetics analysis. The Lancet Respiratory Medicine 3, 782-795 (2015).
36. Carter, R.I., Ungurs, M.J., Mumford, R.A. & Stockley, R.A. Aalpha-Val360: a marker of neutrophil elastase and COPD disease activity. Eur Respir J 41, 31-8 (2013).
37. Sand, J.M. et al. Accelerated extracellular matrix turnover during exacerbations of COPD.
Respir Res 16, 69 (2015).
38. Jhingran, A. et al. Compartment-specific and sequential role of MyD88 and CARD9 in
chemokine induction and innate defense during respiratory fungal infection. PLoS Pathog 11, e1004589 (2015).
39. Roadmap Epigenomics Consortium et al. Integrative analysis of 111 reference human epigenomes. Nature 518, 317-30 (2015).
40. Cogan, J.D. et al. Rare variants in RTEL1 are associated with familial interstitial pneumonia.
Am J Respir Crit Care Med 191, 646-55 (2015).
41. Todd, J.A., Bell, J.I. & McDevitt, H.O. HLA-DQ beta gene contributes to susceptibility and resistance to insulin-dependent diabetes mellitus. Nature 329, 599-604 (1987).
42. Hobbs, B. et al. Genetic loci associated with chronic obstructive pulmonary disease overlap with loci for lung function and pulmonary fibrosis. Nat Genet XX, XX (2017).
43. Soler Artigas, M. et al. Effect of five genetic variants associated with lung function on the risk of chronic obstructive lung disease, and their joint effects on lung function. Am J Respir Crit
Care Med 184, 786-95 (2011).
44. Poole, C. A history of the population attributable fraction and related measures. Ann
Epidemiol 25, 147-54 (2015).
17 Figure 1: Manhattan plots of genome-wide association results for FEV1 (top), FEV1/FVC (middle) and FVC (bottom). Previously reported signals are highlighted in dark blue (except signals with P>5x10⁻⁴ in this study); and novel signals are coloured in red. Signals are highlighted for the trait with which they showed strongest association only. The red and blue lines correspond to the genome-wide significance level (P=5x10⁻⁸, -log10P=7.3) and the threshold used to select signals for follow up in stage 2 (P=5x10⁻⁷, -log10P=6.3) respectively. Labels show the nearest gene to the novel sentinel variants. There were 2 independent novel signals near CDC7 and TGFBR3 on chromosome 1 (labelled as CDC7/TGFBR3). See Supplementary Table 3 for full results. Image was created using a modified version of the R package qqman.
Figure 2 Genetic Risk Score associations with COPD susceptibility (a) Forest plot of COPD results for the risk score analysis. Odds ratios per standard deviation of the risk score (~6 alleles) are presented for each study. Studies are grouped according to study design and phenotyping: “eMR”, electronic medical records, which used ICD codes to define COPD (DiscovEHR also used spirometry to refine the COPD definition); “case-control”, COPD case-control, which used post-bronchodilator spirometry to define COPD; “lung resection cohort”, which used a combination of pre and post-bronchodilator spirometry to define COPD; the Icelandic Biobank, deCODE, where cases were selected from a population based study and a study of COPD patients and defined using a spirometric definition, controls were selected as individuals within the cohort that were not known cases (no spirometric definition was used for controls); and UK Biobank (excluding UK BiLEVE), which used spirometry to define both COPD cases and controls. Further details are provided in the Supplementary Note. (b) Odds ratios for spirometrically-defined COPD for weighted genetic risk score deciles in UK Biobank (10,547 cases, pre-bronchodilator % predicted FEV1<80% and FEV1/FVC<0.7, and 53,948 controls, FEV1/FVC>0.7 and % predicted FEV1>80%, weights derived from non-discovery populations). For each decile, odds ratios were obtained using a logistic regression adjusted for age, age2, sex, height, smoking status, pack-years and the first 10 ancestry principal components. The OR comparing the 10th and the 1st decile in ever-smokers only was 3.35 (95% CI 2.93 to 3.84) and in never-smokers only was 4.27 (95% CI 3.61 to 5.06).
Table 1: Stage 1 and stage 2 association results for the 43 novel signals of association with lung function.
Where the discovery variant was not available in replication cohorts but a proxy with r2 > 0.7 was available, the proxy was used for replication in all cohorts (proxies are marked with * in rsid column). For discovery the standard errors and P values are genomic controlled except for conditional
18 Stage 1 (discovery in UK
BiLEVE)
Stage 2 Meta-analysis of stage
1 and stage 2
Top trait Rsid (conditioned on) Position b37 Nearest gene(s) Non /coding allele Effect allele
frequency beta se P
UK Biobank beta UK Biobank se Spiro Meta beta Spiro Meta se UKHLS beta UKHLS se Meta beta Meta se Meta P beta se Meta P FEV1/
FVC rs17513135
1:4003568 6
LOC10192951
6 (intron) C/T 23.15% -0.047 0.008 1.25E-09 -0.034 0.008 -0.025 0.009 -0.030 0.020 -0.033 0.006 1.17E-08 -0.038 0.005 2.31E-16
FEV1/ FVC rs1192404 (rs12140637) 1:9206896 7 CDC7/TGFBR
3 A/G 16.21% -0.046 0.009 1.10E-07 -0.047 0.009 -0.046 0.010 -0.033 0.023 -0.050 0.007 9.31E-14 -0.048 0.005 6.09E-20
FEV1/
FVC rs12140637
1:9237451 7
TGFBR3/BRD
T2 C/T 31.30% -0.036 0.007 3.49E-07 -0.014 0.008 -0.019 0.008 -0.042 0.018 -0.020 0.005 1.46E-04 -0.026 0.004 1.18E-09
FVC rs200154334 1:1188620 70
SPAG17/TBX
15 AT/- 24.79% 0.054 0.008 9.70E-12 0.025 0.008 0.023 0.009 0.001 0.020 0.024 0.006 1.69E-05 0.034 0.005 8.20E-14
FEV1/
FVC rs6688537
1:2398505 88
CHRM3
(intron) C/A 50.60% -0.037 0.007 2.74E-08 -0.042 0.006 -0.023 0.008 -0.049 0.017 -0.039 0.005 4.05E-15 -0.038 0.004 6.72E-22
FEV1/
FVC rs61332075
2:2393165 60
TRAF3IP1/AS
B1 G/C 12.30% 0.060 0.010 2.93E-09 0.025 0.010 0.021 0.012 0.029 0.025 0.026 0.007 5.11E-04 0.038 0.006 2.55E-10
FEV1/
FVC rs1458979
3:5515067 7
CACNA2D3/W
NT5A A/G 50.11% -0.035 0.007 1.52E-07 -0.021 0.006 -0.010 0.008 -0.031 0.017 -0.019 0.005 1.07E-04 -0.025 0.004 4.42E-10
FVC rs1490265 3:6745204 3
SUCLG2
(intron) C/A 70.79% 0.039 0.007 1.03E-07 0.022 0.007 0.008 0.008 0.036 0.018 0.019 0.005 3.27E-04 0.026 0.004 1.58E-09
19 FVC 27 (intron)
FEV1/
FVC rs56341938*
3:1687158 08
LOC10050766
1/MECOM A/G 51.34% 0.034 0.007 3.38E-07 0.037 0.006 0.013 0.008 - - 0.027 0.005 1.97E-08 0.029 0.004 4.52E-14
FEV1/ FVC
rs13110699
(rs2045517)
4:8981569 5
FAM13A
(intron) T/G 82.51% -0.045 0.008 1.29E-07 -0.037 0.008 -0.030 0.009 -0.014 0.024 -0.035 0.006 7.80E-09 -0.038 0.005 7.86E-15
FVC rs91731 5:3333431 2
LOC340113/T
ARS C/A 90.53% -0.070 0.011 8.10E-10 -0.031 0.011 -0.047 0.013 0.000 0.028 -0.038 0.008 7.88E-06 -0.049 0.007 4.31E-13
FEV1/
FVC rs1551943
5:5219503
3 ITGA1 (intron) G/A 23.01% -0.052 0.008 3.12E-11 -0.041 0.008 -0.019 0.009 -0.031 0.020 -0.035 0.006 2.35E-09 -0.041 0.005 1.92E-18
FVC rs2441026 5:5344449
8 ARL15 (intron) C/T 46.27% 0.034 0.007 4.59E-07 0.023 0.006 0.025 0.008 0.006 0.017 0.024 0.005 6.59E-07 0.027 0.004 2.75E-12
FEV1/
FVC rs7713065
5:1317883 34
C5orf56
(intron) A/C 73.67% 0.039 0.007 2.21E-07 0.029 0.007 0.014 0.008 0.017 0.019 0.024 0.005 8.29E-06 0.029 0.004 2.77E-11
FEV1 rs3839234 5:1485966 93
ABLIM3
(intron) G/- 47.01% -0.038 0.007 8.87E-09 -0.023 0.006 -0.014 0.008 0.001 0.017 -0.019 0.005 7.71E-05 -0.026 0.004 4.48E-11
FEV1/ FVC
rs10515750 (rs1990950)
5:1568100 72
CYFIP2
(intron) C/T 7.18% -0.063 0.012 2.61E-07 -0.050 0.012 -0.040 0.014 -0.033 0.032 -0.048 0.009 2.62E-07 -0.054 0.007 5.26E-13
FEV1/ FVC
rs28986170
(rs2070600 rs9272528*)
6:3155615
5 LST1 (intron) -/AA 7.52% 0.075 0.013 2.30E-08 0.034 0.014 - - 0.096 0.036 0.048 0.014 6.49E-04 0.063 0.010 1.56E-10
FEV1 rs114229351 6:3264841
20
(rs34864796) DQA2
FEV1/
FVC rs141651520
6:7367009 5
KCNQ5 (intron)
TTCTAT
/- 20.10% 0.042 0.008 3.38E-07 0.049 0.008 0.026 0.009 0.025 0.020 0.042 0.006 5.49E-12 0.042 0.005 9.93E-18
FEV1/
FVC rs10246303 7:7286445
C1GALT1 (3’
UTR) A/T 41.74% -0.034 0.007 4.42E-07 -0.013 0.006 -0.016 0.008 -0.019 0.017 -0.016 0.005 1.29E-03 -0.022 0.004 2.35E-08
FEV1/
FVC rs72615157
7:9963596 7
ZKSCAN1 (3’
UTR) G/A 16.73% 0.046 0.009 2.68E-07 0.015 0.009 0.030 0.010 0.030 0.022 0.024 0.007 2.56E-04 0.032 0.005 1.98E-09
FEV1 rs12698403 7:1561272 46
LOC389602/L
OC285889 G/A 44.36% -0.036 0.007 7.43E-08 -0.025 0.006 -0.025 0.008 -0.012 0.017 -0.026 0.005 1.43E-07 -0.029 0.004 1.11E-13
FEV1 rs7872188 9:4124377 GLIS3 (intron) C/T 40.17% -0.038 0.007 1.80E-08 -0.019 0.007 -0.020 0.008 0.005 0.017 -0.019 0.005 1.41E-04 -0.026 0.004 1.59E-10
FVC
rs10870202
(rs10858246)
9:1392574
11 DNLZ (intron) T/C 50.01% -0.033 0.006 3.25E-07 -0.016 0.006 -0.017 0.008 -0.027 0.017 -0.019 0.005 1.54E-04 -0.024 0.004 9.32E-10
FEV1/
FVC rs3847402
10:302678 10
SVIL/KIAA146
2 G/A 40.57% -0.036 0.007 1.00E-07 -0.017 0.007 -0.027 0.008 -0.007 0.017 -0.021 0.005 3.84E-05 -0.027 0.004 7.72E-11
FVC rs7095607 10:699573
50 MYPN (intron) G/A 49.52% -0.037 0.007 3.93E-08 -0.021 0.006 -0.029 0.008 -0.030 0.017 -0.027 0.005 2.26E-08 -0.031 0.004 8.67E-15
FEV1 rs2509961 11:623109 09
AHNAK
(intron) T/C 38.21% 0.036 0.007 1.68E-07 0.030 0.007 0.017 0.008 0.025 0.017 0.027 0.005 1.07E-07 0.030 0.004 1.49E-13
FEV1 rs145729347* 11:864427
33 ME3/PRSS23 G/C 15.08% -0.056 0.009 1.67E-09 -0.020 0.009 -0.016 0.010 - - -0.018 0.007 5.36E-03 -0.031 0.005 8.58E-09
FEV1 rs567508 11:126008 910
CDON/RPUS
21 FEV1 rs1494502 12:65824670 MSRB3 (intron) A/G 36.20% 0.036 0.007 2.72E-07 0.020 0.007 0.012 0.008 0.030 0.017 0.019 0.005 1.33E-04 0.025 0.004 9.80E-10
FEV1/
FVC rs113745635
12:955547
71 FGD6 (intron) C/T 21.20% -0.050 0.008 3.47E-10 -0.039 0.008 -0.018 0.009 -0.061 0.020 -0.036 0.006 1.41E-09 -0.041 0.005 8.46E-18
FVC rs35506 12:115500 691
TBX3/MED13
L T/A 71.25% 0.037 0.007 4.31E-07 0.021 0.007 0.019 0.008 0.011 0.018 0.021 0.005 1.08E-04 0.027 0.004 9.87E-10
FEV1/
FVC rs1698268
14:843096 64
LINC01467/LI
NC00911 A/T 29.44% -0.039 0.007 1.12E-07 -0.023 0.007 -0.003 0.010
0.000
0.018 -0.016 0.006 4.20E-03 -0.025 0.005 3.19E-08
FEV1/
FVC rs72724130
15:419776
90 MGA (intron) A/T 5.70% -0.075 0.014 2.05E-07 -0.046 0.014 -0.039 0.021 0.007 0.035 -0.043 0.012 2.62E-04 -0.056 0.009 9.58E-10
FEV1/ FVC
rs12591467
(rs10851839)
15:717883 87
THSD4
(intron) C/T 68.38% 0.037 0.007 6.45E-08 0.021 0.007 0.011 0.008 0.030 0.018 0.019 0.005 2.17E-04 0.026 0.004 5.65E-10
FEV1/
FVC rs66650179
15:842616 89
SH3GL3
(intron) A/- 81.34% -0.048 0.009 2.60E-08 -0.030 0.008 - - -0.035 0.021 -0.036 0.008 1.79E-05 -0.042 0.006 3.71E-12
FEV1/
FVC rs62070270*
17:282639 80
EFCAB5
(intron) A/G 45.65% -0.041 0.007 6.71E-10 -0.036 0.006 -0.021 0.008 - - -0.030 0.005 8.00E-10 -0.034 0.004 7.29E-18
FEV1/
FVC rs11658500
17:368868
28 CISD3 (intron) G/A 14.16% -0.051 0.009 4.70E-08 -0.031 0.009 -0.011 0.011 -0.069 0.025 -0.029 0.007 5.11E-05 -0.037 0.006 7.22E-11
FVC rs6140050 20:663290 1
CASC20/BMP
2 C/A 63.34% 0.040 0.007 5.95E-09 0.026 0.007 0.028 0.008 -0.011 0.017 0.026 0.005 5.23E-07 0.031
0.004 6.39E-14
FEV1 rs72448466 20:623636 40
ZGPAT
(intron) GT/- 67.28% -0.038 0.007 1.09E-07 -0.020 0.007 -0.029 0.008 -0.032 0.017 -0.027 0.005 3.68E-07 -0.030
22 FEV1 rs11704827 22:18450287 MICAL3 (intron) A/T 23.14% 0.049 0.008 6.08E-10 0.021 0.008 0.021 0.009 0.047 0.020 0.025 0.006 1.44E-05 0.033 0.005 8.32E-13
FEV1 rs2283847 22:281813
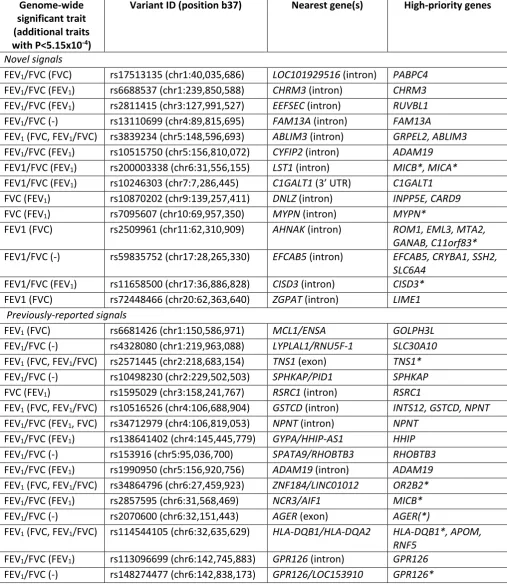
23 Table 2 Genes implicated as high-priority genes for novel genome-wide significant and previously-reported signals using expression data and functional annotation. #Variant did not reach P<5.15x10⁻⁴ (Bonferroni corrected P value for 97 tests) in this study for any trait. *Gene implicated as it
contained a deleterious variant (Supplementary Table 14); all other genes implicated by
co-localisation of GWAS and eQTL signal. (*) implicated by both co-co-localisation of eQTL and GWAS, and a deleterious variant. All 234 genes implicated are listed in Supplementary Table 15.
Genome-wide significant trait (additional traits with P<5.15x10⁻⁴)
Variant ID (position b37) Nearest gene(s) High-priority genes
Novel signals
FEV1/FVC (FVC) rs17513135 (chr1:40,035,686) LOC101929516 (intron) PABPC4
FEV1/FVC (FEV1) rs6688537 (chr1:239,850,588) CHRM3 (intron) CHRM3
FEV1/FVC (FEV1) rs2811415 (chr3:127,991,527) EEFSEC (intron) RUVBL1
FEV1/FVC (-) rs13110699 (chr4:89,815,695) FAM13A (intron) FAM13A
FEV1 (FVC, FEV1/FVC) rs3839234 (chr5:148,596,693) ABLIM3 (intron) GRPEL2, ABLIM3
FEV1/FVC (FEV1) rs10515750 (chr5:156,810,072) CYFIP2 (intron) ADAM19
FEV1/FVC (FEV1) rs200003338 (chr6:31,556,155) LST1 (intron) MICB*, MICA*
FEV1/FVC (FEV1) rs10246303 (chr7:7,286,445) C1GALT1 (3’ UTR) C1GALT1
FVC (FEV1) rs10870202 (chr9:139,257,411) DNLZ (intron) INPP5E, CARD9
FVC (FEV1) rs7095607 (chr10:69,957,350) MYPN (intron) MYPN*
FEV1 (FVC) rs2509961 (chr11:62,310,909) AHNAK (intron) ROM1, EML3, MTA2, GANAB, C11orf83*
FEV1/FVC (-) rs59835752 (chr17:28,265,330) EFCAB5 (intron) EFCAB5, CRYBA1, SSH2, SLC6A4
FEV1/FVC (FEV1) rs11658500 (chr17:36,886,828) CISD3 (intron) CISD3*
FEV1 (FVC) rs72448466 (chr20:62,363,640) ZGPAT (intron) LIME1 Previously-reported signals
FEV1 (FVC) rs6681426 (chr1:150,586,971) MCL1/ENSA GOLPH3L
FEV1/FVC (-) rs4328080 (chr1:219,963,088) LYPLAL1/RNU5F-1 SLC30A10
FEV1 (FVC, FEV1/FVC) rs2571445 (chr2:218,683,154) TNS1 (exon) TNS1*
FEV1/FVC (-) rs10498230 (chr2:229,502,503) SPHKAP/PID1 SPHKAP
FVC (FEV1) rs1595029 (chr3:158,241,767) RSRC1 (intron) RSRC1
FEV1 (FVC, FEV1/FVC) rs10516526 (chr4:106,688,904) GSTCD (intron) INTS12, GSTCD, NPNT
FEV1/FVC (FEV1, FVC) rs34712979 (chr4:106,819,053) NPNT (intron) NPNT
FEV1/FVC (FEV1) rs138641402 (chr4:145,445,779) GYPA/HHIP-AS1 HHIP
FEV1/FVC (-) rs153916 (chr5:95,036,700) SPATA9/RHOBTB3 RHOBTB3
FEV1/FVC (FEV1) rs1990950 (chr5:156,920,756) ADAM19 (intron) ADAM19
FEV1 (FVC, FEV1/FVC) rs34864796 (chr6:27,459,923) ZNF184/LINC01012 OR2B2*
FEV1/FVC (FEV1) rs2857595 (chr6:31,568,469) NCR3/AIF1 MICB*
FEV1/FVC (-) rs2070600 (chr6:32,151,443) AGER (exon) AGER(*)
FEV1 (FVC, FEV1/FVC) rs114544105 (chr6:32,635,629) HLA-DQB1/HLA-DQA2 HLA-DQB1*, APOM, RNF5
FEV1/FVC (FEV1) rs113096699 (chr6:142,745,883) GPR126 (intron) GPR126
24 FVC (FEV1) rs10858246 (chr9:139,102,831) QSOX2 (intron) QSOX2
FVC (FEV1) rs2348418 (chr12:28,689,514) CCDC91 (intron) FLJ35252
FEV1/FVC# (-) rs11172113 (chr12:57,527,283) LRP1 (intron) LRP1
FEV1# (-) rs7155279 (chr14:92,485,881) TRIP11 (intron) ATXN3
FEV1# (-) rs117068593 (chr14:93,118,229) RIN3 (exon) RIN3(*)
FEV1/FVC (FEV1) rs10851839 (chr15:71,628,370) THSD4 (intron) THSD4
FEV1/FVC (-) rs12447804 (chr16:58,075,282) MMP15 (intron) MMP15
FEV1/FVC (FEV1) rs3743609 (chr16:75,467,021) CFDP1 (intron) TMEM170A, BCAR1, CFDP1
FEV1 (FVC, FEV1/FVC) rs35524223 (chr17:44,192,590) KANSL1 (intron) KANSL1(*), MAPT(*), ARL17B, ARL17A, LRRC37A4, NUDT1, LRRC37A, CRHR1, LRRC37A2, ARHGAP27, FMNL1, PLEKHM1, WNT3, NSF, SPPL2C*
FEV1 (FVC) rs7218675 (chr17:73,513,185) TSEN54 (intron) CASKIN2, TSEN54*
25 Online Methods
Study Governance
UK Biobank has ethical approval from the NHS National Research Ethics Service (Ref 11/NW/0382). Informed consent was obtained from all participants. All other studies were approved by an appropriate ethics committee or data protection authority (Supplementary Note).
Stage 1 study sample selection
A genome-wide discovery study for variants associated with lung function measures was performed in 48,943 individuals from the UK BiLEVE16 subset of UK Biobank (UK BiLEVE, stage 1). In brief, UK Biobank comprised 502,682 individuals of whom 275,939 were of self-reported European-ancestry and had ≥2 Forced Expired Volume in 1s (FEV1) and Forced Vital Capacity (FVC) measures
(Vitalograph Pneumotrac 6800, Buckingham, UK) passing ATS/ERS criteria46. Based on the best (highest) available FEV1 measurement, 50,008 individuals from groups with extreme low (n=10,002), near-average (n=10,000) and extreme high (n=5,002) % predicted FEV1 were selected from amongst never-smokers (total n=105,272) and the same numbers from amongst the heavy-smokers (mean 35 pack-years of smoking, total n=46,758). FEV1, FVC and FEV1/FVC distributions are summarised in Supplementary Figure 8. Genotyping was undertaken using the Affymetrix Axiom UK BiLEVE array16 and imputed to the 1000 Genomes Project Phase 147 and UK10K48,49 combined panel. A total of 27,624,732 imputed or directly genotyped autosomal variants with imputation quality (info) >0.5 and minor allele count (MAC) ≥3 were included in the analysis. In total, 48,943 unrelated individuals passed all quality control steps and were used in this analysis.
Association testing and selection of signals from stage 1 for follow-up in stage 2
Power calculations were undertaken using Quanto (see URLs) (Supplementary Figure 9). For stage 1, genome-wide association studies of FEV1, FVC and FEV1/FVC were undertaken separately in heavy-smokers and never-heavy-smokers and then meta-analysed for each trait. Linear regression of age, age2, sex, height, the first 10 principal components of genetic ancestry and pack years of smoking (in smokers) on each trait was undertaken and residuals were ranked and transformed to inverse normally distributed Z-scores. For the first 26 lung function variants reported11,13,14,50 we showed Stage 2 effect size estimates14 were comparable with those from inverse normally distributed Z-scores in UK BiLEVE (Supplementary Figure 10). Subsequently these Z-Z-scores were used for genome-wide association testing using an additive genetic model (SNPTEST v2.5). The full genome-genome-wide stage 1 results are available via UK Biobank (see URLs).
From each of the three discovery GWAS, signals were selected for follow-up in stage 2 if they met an initial threshold of P<5x10⁻⁷. Low MAC variants (MAC between 3 and 20), were selected for follow-up only if the imputation quality (info) exceeded 0.8. Independence of signals was determined as follows: the most strongly associated (P<5x10⁻⁷) variant within a 1Mb region was selected as a putative signal and then the analysis repeated for that 1Mb region conditioning on the most strongly associated variant. Any variant which then had a conditional P<5x10⁻⁷ was then assigned as a
26 signals for different traits were in linkage disequilibrium (r2 > 0.2), the variant for the trait with the most significant association was followed up. Due to the extended LD structure in the MHC region, conditional analyses and GCTA were run over a 9Mb region (chr6:24,126,750-33,126,689). Two pairs of signals previously reported as being independent (rs16909859:G>A11 and rs16909898:A>G14 in
PTCH1, and rs34712979:G>A16 and rs6856422:T>G15, in NPNT) were found to be correlated in our data.
Stage 2 – follow-up in independent studies (quantitative lung function)
Putative novel signals of association from stage 1 were followed up in three independent sets of samples (stage 2): (i) an independent subset of UK Biobank participants (UK Biobank, n=49,727), (ii) a population-based consortium (SpiroMeta, n=38,199)15 and (iii) UK Households Longitudinal Study (UKHLS, n=7,449). We did not include these studies in Stage 1 as: (ii) was to be utilised for
independent replication and; (i) and (iii) were not yet available when Stage 1 was undertaken. Each signal was followed-up only for the trait with which it was most strongly associated in Stage 1. The first tranche of genotype data and imputation output (merged 1000 Genomes Project Phase 3 and UK10K imputation panel) from UK Biobank was released May 2015 (see URLs) and comprised the 49,979 individuals originally genotyped for UK BiLEVE (an unrelated subset of 48,943 of which were used as discovery in this study) and an additional 102,757 individuals selected at random from the entire UK Biobank. From these 102,757 individuals, we initially selected 51,117 samples that had lung function measurements (FEV1 and FVC) meeting ATS/ERS criteria and had covariates age, sex, height, principal components and smoking status recorded. Following further exclusion of individuals with sex mismatches (n=41), individuals of non-European ancestry (based on k-means clustering of principal components 1 and 2 with 4 clusters, n=124) and one individual from each pair of related samples (KING relatedness > 0.088 [2nd degree], n=1,225), a total of 49,727 individuals remained for analysis.
The details of the SpiroMeta consortium analysis (including contributing studies, spirometry details and methods) are described elsewhere15. In brief, this was an inverse variance weighted fixed effects meta-analysis of 17 studies with imputation to 1000 Genomes Project Phase 1 reference panel. Within each study, FEV1, FVC and FEV1/FVC were adjusted for age, age2, sex, height and population structure, separately for ever and never-smokers. Inverse normal transformed residuals were then tested for association within each smoking stratum assuming an additive genetic effect and then meta-analysed. Genomic control was applied to account for residual population structure. We only included SpiroMeta meta-analysis results in the meta-analysis in this study if Neffective > 70% (i.e. >70% of 38,199), where Neffective is the effective sample size after scaling for imputation quality15. Summary statistics of a GWAS of FEV1, FVC and FEV1/FVC in 7,449 individuals were available from UKHLS (Supplementary Note). SNPs were genotyped using the Illumina Infinium HumanCoreExome BeadChip Kit and imputed against the same 1000 Genomes Project + UK10K combined imputation panel as used in discovery in this study. Association testing was performed separately for ever and never-smokers with covariates age, age2, sex height and ancestry principal components, as for Stage 1. We only included UKHLS results in the meta-analysis in this study if imputation info >0.5 and MAC >=3.
27 All meta-analyses were undertaken using fixed effects inverse variance weighting which takes directionality of association into account. Effect estimates for all variants followed up in stage 2 were meta-analysed across the three stage 2 studies and then the combined result was meta-analysed with stage 1 results. Where the discovery variant was not present in any stage 2 study, a proxy (r2>0.8) that was available in all stage 1 and stage 2 studies was used. We report signals with association P<5x10⁻⁸ in the meta-analysis of stages 1 and 2 as novel signals of association with lung function.
Assessment of stage 1 and stage 2 sample overlap by LD score regression
LD score regression was used to assess the extent of confounding. Absence of significant confounding
indicates that factors such as sample overlap and/or population stratification are not evident.
Pre-computed LD scores from a European population were used (see URLs), based on genotypes for 1,293,150 HapMap3 SNPs in samples from the 1000 Genomes Project EUR population. Association results were filtered (info > 0.9 and MAF > 1%) before running LD score regression on (i) 3 pairwise meta-analyses of results from UK BiLEVE (stage 1) and UK Biobank (stage 2), UK BiLEVE and
SpiroMeta and UK Biobank and SpiroMeta; (ii) bivariate analyses of the 3 pairs of cohorts.
Effect sizes in adults and children
The effects of variants on lung function in children were also tested in 5,062 children from ALSPAC (mean age 8.6) and 1,220 children from the Raine study (mean age 8.1). Data were available for 81 of the 97 variants (a proxy variant with r2>0.7 was used for 11 signals) with imputation quality >0.5 of which 73 had imputation quality >0.8 (71 variants in ALSPAC and 35 in the Raine study).
Association results from the two cohorts were combined using inverse variance weighted meta-analysis. A weighted risk score was approximated using pooled single SNP results, as described in Dastani et al52, and weights obtained using estimated effect sizes from either SpiroMeta15 summary data (for SNPs discovered in UK Biobank), or from UK Biobank (for SNPs discovered elsewhere). The risk score was tested for the three lung function traits: FEV1, FVC and FEV1/FVC.
Refinement of signals
A Bayesian method53 was used to fine-map lung function-associated signals to the set of variants that were 95% likely to contain the underlying causal variant (assuming that the causal variant has been analysed). This was undertaken for novel signals and for previously-reported signals which reached P<10-5 in the stage 1 results. Following van de Bunt et al.54 we set the value of a prior W=0.4 in the approximate Bayes Factor formula. Signals in the HLA were not included.
We re-imputed our 48,943 discovery samples across the HLA (chr6:29,607,078-33,267,103 (b37)) using IMPUTE2 v2.3.1 with a reference panel incorporating classical HLA alleles and amino acid changes55. The reference panel contained haplotypes for 5,225 samples from the type 1 diabetes genetics consortium (T1DGC) across 8,961 biallelic variants comprised of 5,863 directly genotyped biallelic SNPs and 3,098 surrogate biallelic variants encoding multiallelic SNPs, indels, classical HLA alleles and amino acid changes. Association testing was then undertaken as described for stage 1 for FEV1 and FEV1/FVC.