Research paper
Characterisation of human saliva as a platform for oral dissolution
medium development
Sally Gittings
a, Neil Turnbull
b, Brian Henry
b, Clive J. Roberts
a, Pavel Gershkovich
a,⇑ aSchool of Pharmacy, The University of Nottingham, Nottingham, United Kingdomb
Pfizer Drug Product Design, WRD Pharmaceutical Sciences, United Kingdom
a r t i c l e
i n f o
Article history:
Received 23 September 2014
Accepted in revised form 11 January 2015 Available online 17 January 2015
Keywords:
Human saliva Taste masking Dissolution Biorelevant medium
Physicochemical characteristics Oral cavity
a b s t r a c t
Human saliva is a biological fluid of great importance in the field of dissolution testing. However, until now, no consensus has been reached on its key characteristics relevant to dissolution testing. As a result, it is difficult to select or develop anin vitrodissolution medium to best represent human saliva. In this study, the pH, buffer capacity, surface tension, viscosity and flow rate of both unstimulated (US) and stimulated (SS) human saliva were investigated in order to provide a platform of reference for future dis-solution studies using simulated salivary fluids. Age and gender related differences in a sample size of 30 participants for each parameter were investigated. Significant differences were established between US and SS for all characteristics except surface tension. Therefore, the requirement for using two simulated salivary fluids should be considered when developing an oral dissolution model.
Ó2015 Elsevier B.V. All rights reserved.
1. Introduction
The oral cavity as a dissolution site is often overlooked due to rapid oral transit as conventional dosage forms are swallowed. However conventional oral formulations such as tablets and capsules are of limited application in the paediatric and geriatric population and alternative oral dosage forms which reside in the mouth for a significant time are increasing in popularity [1]. In addition, adult dosage forms which can be taken ‘‘on the move’’, without the co-administration of water are also gaining interest [2]. Many alternative formulations, such as oral films, sublingual and buccal tablets and orally disintegrating tablets rely on dissolu-tion or disintegradissolu-tion in saliva. On the contrary, taste masked oral dosage forms often aim to reduce drug dissolution in saliva in order to prevent contact between the unpleasant tasting active pharmaceutical ingredient (API) and the taste buds [3]. Saliva therefore plays a critical role in the dissolution and performance of these formulations. However, there is no consensus on the key characteristics of human saliva which may affect dissolution, and as a result, it is difficult to select or develop anin vitrodissolution
medium to best represent human saliva in the evaluation of these dosage forms.
A number of parameters can be considered as highly influential onin vitrodissolution. The pH, buffer capacity and surface tension are identified as some of the most important factors[4]. Addition-ally, viscosity is considered in many cases[5]. Furthermore, Wang et al. described biorelevant dissolution and suggested consider-ation of pH, buffer capacity, surface tension and viscosity of the medium to be paramount for biorelevant dissolution testing (along with non-medium related hydrodynamic factors such as volume, flow, agitation and apparatus)[6]. The importance of these partic-ular parameters is evident as similar approaches have been adopted in the characterisation of other gastro-intestinal fluids [7–13]. Extensive research has been carried out over the past few decades in the design and development of, and application of, bio-relevant media representing other gastro-intestinal fluids in both the fed and fasted states[11,14–20]. However, saliva remains less well characterised. Without knowledge of these crucial medium parameters in human saliva, it would prove impossible to develop or select a biorelevant simulated salivary fluid for dissolution stud-ies. This paper therefore aims to address the gap in the character-isation of human biological fluids through the investigation of key parameters of saliva.
The pH of a dissolution medium is important since it affects ion-isation of the API, according to the Henderson–Hasselbalch equa-tion, and ionisation is directly linked with the aqueous solubility
http://dx.doi.org/10.1016/j.ejpb.2015.01.007 0939-6411/Ó2015 Elsevier B.V. All rights reserved.
Abbreviations:API, active pharmaceutical ingredient; SS, stimulated saliva; SSF, simulated salivary fluid; US, unstimulated saliva.
⇑Corresponding author. Centre for Biomolecular Sciences, School of Pharmacy, University Park, University of Nottingham, Nottingham NG7 2RD, United Kingdom. Tel.: +44 0115 84 68014.
E-mail address:[email protected](P. Gershkovich).
Contents lists available atScienceDirect
European Journal of Pharmaceutics and Biopharmaceutics
of an API[21]. Of equal importance therefore is the ability of the medium to resist changes in pH as an acidic or basic drug begins to dissolve, i.e. the medium’s buffer capacity. This was demon-strated by Tsume et al.[22] who performed dissolution experi-ments in media of different buffer capacities with the acidic drug ibuprofen and found that when the buffer capacity was low, the pH decreased to a greater extent as dissolution proceeded, which hindered the rate and extent of further dissolution.
The pH of human saliva has been described previously, with varying results in the wide range of 5.3–7.8, depending on the stimulation state[10,23]. In most studies, either unstimulated sal-iva (US) or stimulated salsal-iva (SS) was investigated, but not both [24,25]. Additionally, studies in which the pH of both types of sal-iva was investigated generally had a small number of participants, or focussed on just one or two salivary characteristics relevant to dissolution testing, such as Bardow et al.[26] who investigated only the pH and buffer capacity. We aim to address this issue by characterising the pH of both US and SS, as well as other key parameters within the same sample.
Buffer capacity has been investigated in numerous studies. However, in most cases, the experimental design employed does not allow one to draw conclusions about the actual buffer capacity value or range. Literature values are reported in different ways. Some research groups have simply quoted the buffer capacity to be high, medium or low, without providing any actual value[27]. Thus one cannot draw direct comparisons between studies. Some researchers simply state the bicarbonate concentration of saliva samples to infer buffer capacity[28]. Furthermore, in some cases, buffer capacity is quoted in mmol L 1pH 1 [26,29]. The lack of similarity in experimental design has led to inconclusive findings regarding the buffer capacity of saliva. This research aims to address these issues by assessing the buffer capacity of saliva using similar experimental design to that used for other gastro-intestinal fluids[12,13,16,20]to allow for comparison.
Viscosity is another key parameter affecting dissolution. A high viscosity medium would increase the thickness of the boundary layers (h) and decrease the diffusion coefficient (D) according to the Noyes–Witney dissolution model, thus reducing the drug dis-solution rate compared with a medium of lower viscosity[30]. Despite viscosity of stimulated and unstimulated whole human saliva being evaluated by several research groups, no consensus has been reached on human saliva viscosity due to differences in experimental conditions. For example, in a review by Schipper et al.[31]viscosity of unstimulated whole saliva was found to be 1.5–1.6 mPa s over a shear rate of 1–300 s 1 in one study [32].
However another study found it to range from 3.8 to 8.8 mPa s at a single shear rate of 90 s 1[33]and a viscosity of 100 mPa s was
recorded at a shear rate of 0.02 s 1in another study[34]within
this review. Research groups used different shear rates, tempera-tures and types of rheometer and often small sample sizes. This research aims to address these issues by using physiological tem-perature and assessing viscosity across a wide range of shear rates. It is well known that the surface tension of the medium also affects the rate of dissolution[9]. A high interfacial tension reduces wetting of the drug particles and reduces the rate of dissolution. Wetting can be improved by the addition of surfactants, reducing interfacial tension and increasing the rate of dissolution, and it is a common practice to add surfactants to dissolution media[35]. Although many studies have investigated the film forming proper-ties of saliva, as well as salivary pellicle thickness and composition [36], few studies have focussed on the surface tension of whole human saliva[23]. Literature regarding the surface tension of sal-iva uses variable experimental designs including different temper-atures and sites in the oral cavity, and often small or non-specified numbers of participants [37,38]. Further clarification of this
parameter is therefore required, using a sufficient number of sam-ples and physiologically relevant temperature.
Despite not directly affecting media choice and composition, salivary flow rate is an important factor when developing a biorel-evant dissolution model[6]. The volume available for dissolution, or flow rate, should reflect physiological conditions since this affects the concentration gradient of solvated API molecules and saturation of the bulk fluid. Salivary flow rate has been investi-gated; however, most groups investigated either US [24] or SS [39]. Since inter-individual variation is so vast in these studies, flow rate should be considered for US and SS in the same individual to allow accurate comparison of stimulation states.
Many research groups performing dissolution tests modelling the oral environment have not taken into account the key charac-teristics described above and have used simple media such as water or phosphate buffered saline (PBS)[3,40]. The most likely reason for that is the lack of availability of sufficient data on the characteristics of human saliva. In addition, many commercial [41]and literature formulations[42]for simulated salivary fluids (SSF) exist. In fact, one article in the year 2000 identified 60 artifi-cial salivas of differing compositions. Whilst it is possible that some of these 60 compositions may be appropriate for dissolution studies, information regarding parameters key to dissolution test-ing is not available[43]. It is also difficult to select the single most appropriate SSF without a clear understanding of human salivary characteristics, and therefore these SSFs are rarely used in dissolu-tion testing. Saliva is a complex mixture containing 99% water, but additionally contains numerous electrolytes, small organic mole-cules such as hormones and glucose, and proteins such as immu-noglobulins, enzymes and glycoproteins, which may have a huge impact on dissolution[44].
Therefore, the aim of this work was to characterise stimulated and unstimulated human saliva for the key characteristics relevant to dissolution to provide a platform of reference for the future selection or development of oral dissolution media that would be representative of human saliva. The saliva flow rate was assessed in this work to aid development of oral dissolution models. Age and gender related differences were also investigated for each parameter. To the best of our knowledge, this is a first work in which the key parameters relevant to drug dissolution – pH, buffer capacity, viscosity, surface tension and flow rate – are assessed simultaneously for both stimulated and unstimulated whole human saliva with a sufficient number of participants to draw sta-tistically meaningful conclusions.
2. Methods and instrumentation
2.1. Human volunteers
All saliva samples were collected in accordance with ethical approval number R12122013 SoP TTTFS, Faculty of Medicine and Health Sciences Research Ethics Committee, Queens Medical Cen-tre, Nottingham University Hospitals. Participation was voluntary and informed written consent was obtained. All data were held in accordance with the Data Protection Act.
2.2. Saliva collection and flow rate
Participants were asked firstly to donate an unstimulated saliva sample by draining their saliva via a sterile disposable funnel into two 15 mL polypropylene sterile graduated centrifuge tubes (Gre-iner Bio-One, UK) and one 1.5 mL polypropylene graduated micro-centrifuge tube (Sarstedt, UK). Samples were collected in 3 different vessels to allow for separate defrosting for each charac-terisation. For each type of saliva (US and SS), the following was collected: 10 mL for buffer capacity, 6 mL for viscosity and 1.5 mL for surface tension measurement. This allowed for a slight excess for each measurement. The time taken to donate each vol-ume was recorded using a stopwatch and the exact volvol-ume was used to calculate flow rate for each sample.
Participants then donated a stimulated saliva sample. For this, they were asked to continually chew a 5 cm5 cm piece of Para-filmÒ[25,26,45,46]and repeat the donations following this stimu-lation. Stimulation was controlled by regulating the size of the piece of ParafilmÒ, and the same volume of saliva was collected each time. Samples were immediately tested for pH, flash frozen in liquid nitrogen and then stored at 80°C until being defrosted for characterisation. No significant difference in pH was observed between fresh and defrosted samples (pairedt-test).
2.3. Viscosity
A Modular Compact Cone-Plate Rheometer MCR 302 (Anton Paar GmbH, Germany) was used. The cone used was a CP50-2-SN30270 with diameter 49.972 mm, angle 2.016°, truncation 211
l
m. Analy-sis was carried out at 37°C. 8 points per decade were used for 3 dec-ades with shear rate increasing logarithmically from 1 to 1000 s 1. Atotal of 25 points were made, 1 point per minute. Rheoplus analysis software (Anton Paar GmbH, Germany) was used. The sample vol-ume was 1.2 mL. Saliva was analysed in triplicate for each partici-pant for US and SS. A range of shear rates was used to assess whether saliva exhibits non-Newtonian behaviour. A shear rate of 4 s 1corresponds to movement of particles across the tongue, 60
corresponds to swallowing and 160 s 1to speech, whilst shear rates of 10–500 s 1have been proposed to reflect the shear during eating.
We therefore used 1–1000 s 1to encompass values that are likely to
be presented in the oral cavity[47].
2.4. Surface tension
A DSA 100 Drop Shape Analyser with DSA 4 software (Kruss GmbH, Germany) using pendant drop method for surface tension analysis with Laplace–Young computational method was employed. Temperature was set to 37°C using an MB-5 heat circu-lator (Julabo GmbH, Germany) with water bath. Measurements were taken immediately after droplet formation. Samples were measured with 5 replicates.
2.5. pH
An S220 seven compact pH/ion meter was used with InLab Science Pro electrode (SI 343 071, Mettler Toledo, Switzerland). The pH meter was accurate to ±0.002 pH units and a 3 point
calibration was used at pH 4, 7 and 10. The pH of human saliva was measured immediately after collection prior to freezing the samples in liquid nitrogen and storing at 80°C. The pH was mea-sured in triplicate for each participant for both US and SS.
2.6. Buffer capacity
A 4 mL saliva sample was allowed to warm to 37°C in the test tube. Temperature was maintained using a water bath in which the test tube for titration was placed. The beaker was placed on an RCT basic hotplate stirrer (IKA Works GmbH, Germany) with tempera-ture probe. Initial pH was tested. The sample was then titrated with 0.01 M HCl at 37°C until a decrease in pH of 1 unit was observed. Buffer capacity in mmol H+/L saliva was calculated from
the volume of acid added. Stirring speed was set such that the added HCl was adequately mixed throughout the bulk of the sam-ple without forming a vortex. A 100 mm23 mm B19/26 glass test tube was used (supplied by Scientific Glassware Supplies, UK). Human saliva was analysed in duplicate for each participant for each type of saliva.
2.7. Statistical analysis
Prior to experiments, the number of study participants was determined using a power calculation[48]. With 80% power and a level of significance ofp< 0.05, 95% significance, a sample size of 8–34 participants is sufficient to detect small to very large ferences, with sample size being inversely proportional to the dif-ference to be detected.
Following the completion of the experiments, the normal distri-bution of the results in each group was tested using a D’Agostino & Pearson omnibus normality test. Where two normally distributed groups were compared, a t-test was used (either paired or unpaired). If one or both groups were not normally distributed, a Wilcoxon matched pairs test was used for paired samples, and a Mann–Whitney U-test was used for unpaired samples. p< 0.05 was considered significant in all cases.
3. Results
3.1. Viscosity
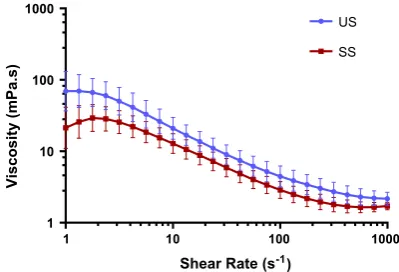
[image:3.595.34.284.87.144.2]The viscosity of US and SS are described inFig. 1. SS was shown to have a lower viscosity, and a statistically significant difference in viscosity was observed between US and SS at every shear rate recorded withp< 0.0001 (Wilcoxon matched pairs test).
Table 1
Study group demographic data.
Total number of participants 30
Age (mean ± S.D. (range)) 26.13 ± 3.55 (20–35)
Age 20–27 22
Age 28–35 8
Male 13
Female 17
1 10 100 1000
1 10 100 1000
Shear Rate (s-1)
Viscosity (mPa.s)
US
SS
[image:3.595.326.526.567.703.2]A statistically significant difference (Mann–Whitney U-test,
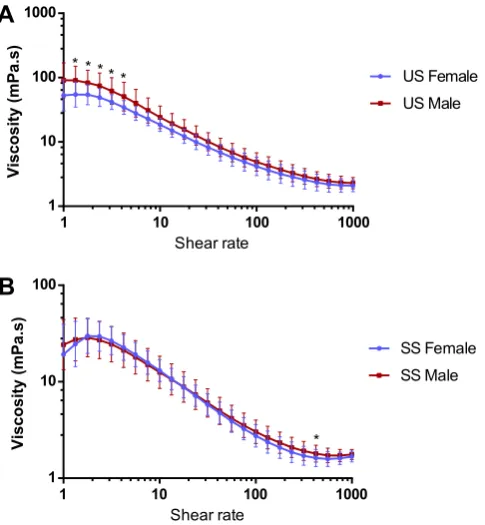
p< 0.05) in US viscosity was observed between males and females at 5 shear rates in the lower shear rate range, with male saliva showing higher viscosity (Fig. 2A). This trend appears to continue across the remainder of the viscosity profile. Practically no differ-ence was observed for SS between male and female groups, with a statistically significant difference (Mann–Whitney U-test,
p< 0.01) observed at just one shear rate (Fig. 2B).
The viscosity of US was significantly higher for the age group 28–35 compared to 20–27 at 3 shear rates (Mann–WhitneyU-test,
p< 0.05,Fig. 3A). This trend also appears to continue across the rest of the viscosity profile. For SS, no significant difference was observed between the two age groups (Fig. 3B).
3.2. Surface tension
The surface tension for US and SS is shown inFig. 4. The surface tension of US was very similar to SS, with no significant difference observed between the two types of saliva (pairedt-test). Note the variability between individuals in surface tension of saliva was very low.
The surface tension of human saliva (Table 2) showed no signif-icant difference between males and females for US or SS. In addi-tion, no significant difference in surface tension of human saliva was observed between different age groups for US or SS.
3.3. pH
SS had a higher pH than US (Fig. 5) and a statistically significant difference was observed between the two groups according to a pairedt-test (p< 0.0001).
No significant difference in pH was observed between males and females for either US or SS. Similarly, no significant difference in pH was observed between age groups for US or SS (Table 3).
3.4. Buffer capacity
The buffer capacity was found to be significantly different for US and SS (pairedt-test,p< 0.0001), with SS having a much greater buffer capacity, as shown inFig. 6.
1 10 100 1000
1 10 100 1000
Shear rate
Viscosity (mPa.s)
US Female US Male * * * **
1 10 100 1000
1 10 100
Shear rate
Viscosity (mPa.s)
SS Female SS Male
*
A
[image:4.595.338.536.69.361.2]B
Fig. 2.Panel A: The viscosity (mean ± S.D.) of US for males (n= 13, triplicates) and females (n= 17, triplicates) at different shear rates.⁄
Significant difference between males and females (Mann–Whitney U-test, p< 0.05). Panel B: The viscosity (mean ± S.D.) of SS for males (n= 13, triplicates) and females (n= 17, triplicates) at different shear rates.⁄
Significant differences between males and females (Mann– WhitneyU-test,p< 0.01). (For interpretation of the references to colour in this figure legend, the reader is referred to the web version of this article.)
B
1 10 100 1000
1 10 100 1000
Shear rate
Viscosity (mPa.s)
US Age 20-27
US Age 28-35 * * *
1 10 100 1000
1 10 100
Shear rate
Viscosity (mPa.s)
SS Age 20-27
SS Age 28-35
[image:4.595.49.292.424.687.2]A
Fig. 3.Panel A: The viscosity (mean ± S.D.) of US for participants age 20–27 (n= 22, triplicates) and age 28–35 (n= 8, triplicates) at different shear rates.⁄
Significant differences between age groups (Mann Whitney test,p< 0.05). Panel B: The viscosity (mean ± S.D.) of SS for participants age 20–27 (n= 22, triplicates) and age 28–35 (n= 8, triplicates) at different shear rates. (For interpretation of the references to colour in this figure legend, the reader is referred to the web version of this article.)
US SS
50 55 60 65 70
Type of Saliva
Surface Tension (mN/m)
Fig. 4.Surface tension of US and SS (n= 30, quintuplicate). Box represents median value, 25th and 75th percentile. Whiskers represent maximum and minimum values. No significant difference in surface tension between US and SS (paired
[image:4.595.322.550.432.600.2]No significant difference in buffer capacity was observed for US between males and females. However, a significant difference in buffer capacity was observed for SS between males and females (unpairedt-test,p< 0.05). No significant difference in buffer capac-ity was observed between different age groups for US or SS (Table 4).
3.5. Flow rate
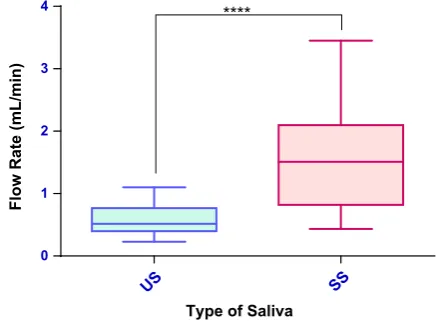
As anticipated, the flow rate of SS was significantly greater than US, shown inFig. 7(pairedt-test,p< 0.0001).
No significant difference in flow rate was observed between males and females for US or SS. Similarly, no significant difference in flow rate was observed between age groups for US or SS (Table 5).
4. Discussion
4.1. Viscosity
[image:5.595.313.545.70.235.2]Human saliva was found to be non-Newtonian across the range of shear rates applied. The shear rates tested are likely to be in the range observed in the oral cavity since it has been suggested that a Table 2
Surface tension of human saliva.
Mean (S.D.) US surface tension (mN/m)
Mean (S.D.) SS surface tension (mN/m)
All participants (N= 30) 58.98 (2.18) 59.69 (2.71)
Male (N= 13) 58.71 (2.06) 59.19 (3.43)
Female (N= 17) 59.18 (2.30) 60.07 (2.03)
Age 20–27 (N= 22) 58.86 (2.13) 59.49 (2.34)
Age 28–35 (N= 8) 59.30 (2.40) 60.22 (3.67)
All measurements are in quintuplicate. No significant difference between US and SS for all participants. No significant differences observed between males and females, or between age groups for US or SS.
US SS
6.0 6.5 7.0 7.5 8.0 8.5
Type of Saliva
pH
[image:5.595.33.282.87.156.2]****
Fig. 5.pH of US and SS (n= 30, triplicate). Box represents median value, 25th and 75th percentile. Whiskers represent maximum and minimum values.⁄⁄⁄⁄
Significant difference (p< 0.0001, pairedt-test). (For interpretation of the references to colour in this figure legend, the reader is referred to the web version of this article.)
Table 3
pH of human saliva.
Mean (S.D.) US pH Mean (S.D.) SS pH
All participants (N= 30) 6.97 (0.20)a
7.40 (0.21)
Male (N= 13) 7.02 (0.23) 7.40 (0.16)
Female (N= 17) 6.93 (0.17) 7.39 (0.25)
Age 20–27 (N= 22) 6.97 (0.18) 7.40 (0.21)
Age 28–35 (N= 8) 6.98 (0.25) 7.40 (0.20)
All measurements are in triplicate.
aSignificantly different to SS (p< 0.0001, pairedt-test).
US SS
0 5 10 15
Type of Saliva
Buffer Capacity (mmol H
+/L)
[image:5.595.47.269.222.390.2]****
Fig. 6.Buffer capacity of US and SS (n= 30, duplicates). Box represents median value, 25th and 75th percentile. Whiskers represent maximum and minimum values.⁄⁄⁄⁄
[image:5.595.300.555.332.403.2]Significant difference (p< 0.0001, pairedt-test). (For interpretation of the references to colour in this figure legend, the reader is referred to the web version of this article.)
Table 4
Buffer capacity of human saliva.
Mean (S.D.) US buffer capacity (mmol H+/L)
Mean (S.D.) SS buffer capacity (mmol H+/L)
All participants (N= 30) 5.93 (1.78)a 8.41 (2.02)
Male (N= 13) 6.60 (1.73) 9.39 (1.31)b
Female (N= 17) 5.42 (1.72) 7.66 (2.18)
Age 20–27 (N= 22) 5.83 (1.76) 8.44 (2.25)
Age 28–35 (N= 8) 6.21 (1.99) 8.31 (1.32)
All measurements are in duplicate.
aSignificantly different to SS (p< 0.0001, pairedt-test). bSignificantly different to SS female (p< 0.05, unpairedt-test).
US SS
0 1 2 3 4
Type of Saliva
Flow Rate (mL/min)
****
Fig. 7.Flow rate of US and SS (n= 30, triplicates). Box represents median value, 25th and 75th percentile. Whiskers represent maximum and minimum values.
⁄⁄⁄⁄
[image:5.595.316.536.454.615.2] [image:5.595.33.282.482.545.2]shear rate of 4 s 1corresponds to the movement of particles across
the tongue whilst 60 s 1 and 160 s 1 correspond to swallowing
and speech respectively[34,47]. Furthermore, shear rates between 10 and 500 s 1have been proposed to mimic the range of shear
rates in the mouth during eating[49]. US was shown to have a higher variability, with a greater relative standard deviation observed for US than SS at all shear rates measured, with the exception of the very lowest shear rate.
SS’s lower viscosity is proportional to its higher flow rate, lead-ing to an increased aqueous content, and a lower concentration of mucins: glycoproteins with a polypeptide backbone and oligosac-charide side chains which are thought to be responsible for the vis-cosity of saliva[50]. It has been suggested that this is due to SS originating predominantly from different salivary glands compared to US[33]. SS has been suggested to have a larger proportion of parotid secretions. However, mucins are mainly secreted from the sublingual, submandibular and palatal glands[33]. Indeed, it is well documented that secretions from the main salivary glands have differing mucin proportions and thus differing viscosities. In some cases, parotid saliva has actually been shown to demonstrate Newtonian behaviour, further reinforcing the link between mucin presence and shear thinning behaviour[31,51].
In human saliva, there are two main types of mucin present: a high molecular weight (MW) mucin, MUC5B (MW 2–40 MDa), and a low molecular weight mucin, MUC7 (MW approx. 150 kDa). The molecular structure of mucin is discussed in detail elsewhere by Haward et al.[20]One study investigated which of these types of mucin is responsible for modifying the viscosity of saliva. They established that MUC5B concentration increased line-arly with viscosity, but MUC7 did not, thus it is likely that MUC5B is responsible for the viscosity of saliva[22].
The results obtained in this study correspond well with other reports regarding the viscosity of US and SS since other research groups found SS to be of lower viscosity[46,51]. The actual viscos-ity values for US and SS in the literature vary depending on the type of viscometer, shear rates and temperature used. However, similar to other reports[50–52], we also observed non-Newtonian behaviour for human saliva. This is thought to be attributed to the destruction of the mucin networks within the samples which undergo an irreversible breakdown upon shearing[31].
4.2. Surface tension
The mean value for US was 58.98 mN/m whilst SS was slightly higher at 59.69 mN/m. Literature reports variable values; however, our results are similar to some other research groups. For example, Kazakov et al.[23]measured the surface tension of US at room temperature and found that it ranged from 68.7 to 44.9 mN/m depending on the time after surface formation, with highest values being obtained at 1 s after surface formation, and lowest values representing time infinity after surface formation. Kirkness et al. found US surface tension to have a more similar mean value to us at 57.4 mN/m in their year 2000 study[37], and 57.7 mN/m in 2005[53]. However, these articles did not specify the number of
samples or participants tested. Furthermore, for SS, Madsen et al. [54] found human saliva to have an equilibrium surface tension of 41.83 mN/m, whilst Christersson et al. [25] found it to range from 56.2 mN/m at 30 s after surface formation to 48.5 mN/m at 600 s after surface formation.
[image:6.595.329.541.66.263.2]The exact composition of surface-active molecules responsible for the interfacial tension of saliva remains unclear. However, pro-teinaceous and glycopropro-teinaceous material has been attributed to surface activity according to numerous studies investigating the composition of salivary pellicle[55,56]or salivary film formation [25,57]. In particular, proline rich proteins are thought to be pres-ent at these interfaces[58,59]. There is also some suggestion of ‘‘surfactant associated proteins A, B, C and D’’ in saliva, which are not structurally or functionally described [60]. Moreover, lipidic materials such as phospholipids, fatty acids and triglycerides are known to be present which may also play a role [23,61]. Since we found no significant difference between US and SS, it is likely that the surface active components of human saliva remain approximately constant, regardless of the stimulation state.
4.3. pH
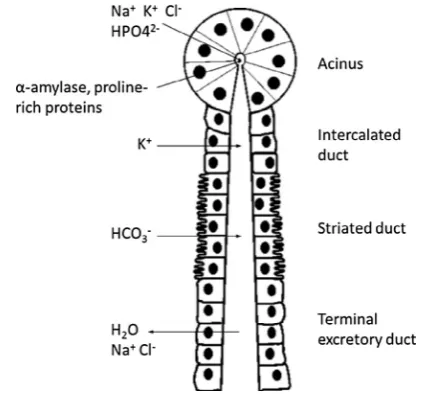
The higher pH in the SS group can be attributed to differences in electrolyte composition, including a greater bicarbonate concen-tration in SS[62]. The pH of saliva is modified as it travels through the duct system within salivary glands by the secretion and reab-sorption of electrolytes, depicted inFig. 8. Initially, an isotonic fluid is released in the secretory acinus. As fluid travels along the duct, reabsorption of some ions such as sodium and chloride, and secre-tion of others such as bicarbonate and potassium occur, until a hypotonic solution is released from the duct[44].
Each acinus may contain only serous cells, mucous cells or both. Serous secretions are rich in electrolytes and enzymes, whereas mucous secretions are rich in glycoproteins. The parotid gland has predominantly serous secretion. Upon stimulation of saliva, there is a greater parotid gland output, thus a greater release of bicarbonate rich serous secretion. This coincides with a lower mucin concentration for SS as discussed previously[44].
Literature stating the pH of human saliva reports variable val-ues that range from 5.3 to 7.8 depending on the stimulation state [23–25]. We found US and SS to be within this range, with mean values of 6.97 and 7.40 for US and SS respectively (range US: 6.49–7.28, range SS: 6.96–7.69). It would be advisable to tailor dis-solution media pH values to reflect these findings.
Table 5
Flow rate of human saliva.
Mean (S.D.) US flow rate (mL/min)
Mean (S.D.) SS flow rate (mL/min)
All participants (N= 30) 0.58 (0.24)a
1.51 (0.72)
Male (N= 13) 0.65 (0.20) 1.60 (0.63)
Female (N= 17) 0.52 (0.26) 1.44 (0.79)
Age 20–27 (N= 22) 0.57 (0.22) 1.46 (0.66)
Age 28–35 (N= 8) 0.61 (0.28) 1.64 (0.88)
All measurements are in triplicate. a
[image:6.595.42.293.87.156.2]Significantly different to SS (p< 0.0001, pairedt-test).
4.4. Buffer capacity
The greater buffer capacity of SS can be attributed to the higher bicarbonate concentration. Bicarbonate contributes approximately 80% of the buffering capacity of human saliva[63], and is found in higher concentrations in SS due to the higher proportion of parotid gland secretions[27]. It should be noted that unlike pH which was measured immediately upon collection, buffer capacity was mea-sured after flash freezing and short term storage at 80°C. The bicarbonate buffer is a dynamic system and in liquid saliva sam-ples, carbon dioxide may be lost from the system. Although we do not anticipate the buffer capacity to alter as a result of freezing, this could be considered a limitation of the study.
A direct comparison with other literature is challenging due to methodological differences. Nevertheless, the approach used here was also used by Bardow et al.[26]who found the buffer capacity to range from 3.1 to 6.0 mmol H+/L of saliva in US and 3.3 to
8.5 mmol H+/L of saliva in SS depending on the pH. This is
compa-rable to our values, since we found mean values to be 5.93 and 8.41 mmol H+/L of saliva for US and SS respectively. In both cases,
SS buffer capacity is higher than US. Despite methodological differ-ences, this was also true for other literature [27]. However, we found buffer capacity to be highly variable for both US and SS, with relative standard deviation being 30.29% and 24.08% for US and SS respectively. This demonstrates a high inter-individual variation, which should be taken into account when designing a dissolution medium.
4.5. Flow rate
The increased flow rate for SS results from the parasympathetic response to ParafilmÒchewing which increases saliva output from the salivary glands, in particular the parotid gland. Inter-individual variability was high, with relative standard deviation being 41.0% and 47.5% for US and SS respectively. In this study, US flow rate ranged from 0.23 to 1.10 mL/min with a mean value of 0.58 mL/ min whilst SS flow rate ranged from 0.43 to 3.45 mL/min with a mean value of 1.51 mL/min.
Literature is also highly variable, with one study finding a max-imum US flow rate of 2.87 mL/min[64], whilst mean SS flow rate was quoted to be just 0.9 mL/min in another study[65]. Across lit-erature, salivary flow rate has been quoted to range from 0.05 to 7.0 mL/min[24,66].
It is known that saliva undergoes diurnal changes in flow rate [66], and since a higher flow rate was associated with a higher pH, higher buffer capacity and lower viscosity in our study, the time at which saliva is collected may affect many of the salivary parameters investigated. Thus, the time of collection was con-trolled and 3 pm was chosen for practical reasons.
There are three main mechanisms of salivary stimulation: mechanical, gustatory and olfactory [44]. Dissolution testers should consider whether the dosage form may stimulate saliva. Crucially, the presence of a dosage form in the oral cavity such as an orally disintegrating tablet or oromucosal formulation may stimulate the release of saliva and therefore it may be prudent to consider both US and SS when modelling the oral cavity. Given that the flow rate and many other parameters are so variable for human saliva, this reinforces the requirement to model both the US and SS states since a single set of test conditions is unlikely to represent the range of salivary scenarios observed.
4.6. Effect of age and gender on salivary parameters
We observed significant gender and age related differences in viscosity of US in the low shear rate region wherein viscosity
was found to be higher for males and the older age group (even with the relatively narrow age range of volunteers). This low shear rate region may require further investigation as statistical differ-ences between demographic groups are only seen in this region. Furthermore, when designing biorelevant dissolution media, this low shear rate region should be modelled accurately. Little is understood about the effect of age and gender on saliva viscosity. Humphrey and Williamson[44]claim that mucin concentrations decrease with age, but also state that secretory hypofunction is not a normal age related phenomenon.
No differences were observed in surface tension for any demo-graphic group. Similar to viscosity, little research has been carried out in this area. Kazakov et al.[23]found that equilibrium surface tension decreased with age, whereby age 5–9 > 10–15 > 40– 55 years. However, surface tension in the over 55 years group began to increase so a linear relationship with age was not estab-lished. The effect of gender was also not considered in that study. Conversely, extensive literature exists detailing the influence of age or gender on flow rate. Despite this, age and gender related effects remain unclear due to conflicting reports[67]. In this study, no significant differences in flow rate were observed between males and females, or between the two age groups. Accordingly, other researchers also found flow rate was not affected by age [68]or gender[26]. However, some literature suggests that female gender correlates with lower flow rate [28,69] which may be attributed to smaller salivary glands and a lower body mass index (BMI)[70,71]. Additionally, increased age has been reported to cor-respond with lower flow rates in some cases[28,72]. In a review by Whelton[62]decreased salivary flow in older patients is described as being secondary to disease or medication rather than directly due to ageing, and total flow is considered to be independent of age.
No significant differences in pH or buffer capacity were found for any demographic group in this study except for SS buffer capac-ity, which was found to be higher for males than females. This is in agreement with Wikner and Soder[73]who found females had a lower SS buffer capacity. Fenoll-Palomares et al.[28]also found no significant differences in pH, and higher bicarbonate concentra-tion in men than women. However, their findings were based on US only. Conversely, another report states gender had no effect on buffer capacity[26]. pH has been described as higher for males in some studies[69]. Additionally, literature describing the effect of age on pH[69]and buffer capacity[74]reaches no consensus.
5. Conclusions
US and SS were found to be significantly different to each other for pH, buffer capacity and flow rate, with SS being higher for these characteristics. No significant difference was seen between US and SS for surface tension. SS had lower viscosity with significant dif-ferences between US and SS observed across all shear rates mea-sured. US and SS were both found to be non-Newtonian. Significant age and gender related differences were observed in some parameters but were not as distinct as differences between US and SS and may require further investigation.
These findings can be used as a platform of reference for the development or selection of future dissolution media representing human saliva. Since SS was found to be significantly different to US for all of the assessed characteristics except surface tension, this suggests the potential requirement for the development of two dif-ferent biorelevant dissolution media: one representing US with a lower pH and buffer capacity but higher viscosity, and one repre-senting SS with a higher pH and buffer capacity, but lower viscosity.
Conflict of interest
The authors declare no conflict of interest.
Acknowledgements
S. Gittings would like to acknowledge the Centre for Doctoral Training in Targeted Therapeutics and Formulation Sciences at the University Of Nottingham – United Kingdom (EPSRC grant EP/I01375X/1) and Pfizer – United Kingdom for funding this work. Additionally, we thank all the participants of the trial.
References
[1]R.G. Strickley, Q. Iwata, S. Wili, T.C. Dahl, Pediatric drugs – a review of commercially available oral formulations, J. Pharm. Sci. 97 (2008) 1731– 1774.
[2]B.P. Badgujar, A.S. Mundada, The technologies used for developing orally disintegrating tablets: a review, Acta Pharm. 61 (2011) 117–139.
[3]S. Gittings, N. Turnbull, C.J. Roberts, P. Gershkovich, Dissolution methodology for taste masked oral dosage forms, J. Control. Release 173 (2014) 32–42. [4]S. Nissankararao, Dissolution method development and validation: a review,
Int. J. Pharm. Res. Develop. 5 (2013) 106–112.
[5]R.J. Braun, E.L. Parrott, Influence of viscosity and solubilization on dissolution rate, J. Pharm. Sci. 61 (1972) 175–178.
[6]Q. Wang, N. Fotaki, Y. Mao, Biorelevant dissolution: methodology and application in drug development, Dissolut. Technol. 16 (2009) 6–12. [7]J.B. Dressman, G.L. Amidon, C. Reppas, V.P. Shah, Dissolution testing as a
prognostic tool for oral drug absorption: immediate release dosage forms, Pharm. Res. 15 (1998) 11–22.
[8]C. Reppas, G. Eleftheriou, P. Macheras, M. Symillides, J.B. Dressman, Effect of elevated viscosity in the upper gastrointestinal tract on drug absorption in dogs, Eur. J. Pharm. Sci. 6 (1998) 131–139.
[9]M. Efentakis, J.B. Dressman, Gastric juice as a dissolution medium: surface tension and pH, Eur. J. Drug Metab. Pharmacokinet. 23 (1998) 97–102. [10]L. Kalantzi, K. Goumas, V. Kalioras, B. Abrahamsson, J.B. Dressman, C. Reppas,
Characterization of the human upper gastrointestinal contents under conditions simulating bioavailability/bioequivalence studies, Pharm. Res. 23 (2006) 165–176.
[11]S. Clarysse, J. Tack, F. Lammert, G. Duchateau, C. Reppas, P. Augustijns, Postprandial evolution in composition and characteristics of human duodenal fluids in different nutritional states, J. Pharm. Sci. 98 (2009) 1177–1192. [12]A. Diakidou, M. Vertzoni, K. Goumas, E. Soderlind, B. Abrahamsson, J.
Dressman, C. Reppas, Characterization of the contents of ascending colon to which drugs are exposed after oral administration to healthy adults, Pharm. Res. 26 (2009) 2141–2151.
[13]P.B. Pedersen, P. Vilmann, D. Bar-Shalom, A. Mullertz, S. Baldursdottir, Characterization of fasted human gastric fluid for relevant rheological parameters and gastric lipase activities, Eur. J. Pharm. Biopharm. 85 (2013) 958–965.
[14]E. Galia, E. Nicolaides, D. Horter, R. Lobenberg, C. Reppas, J.B. Dressman, Evaluation of various dissolution media for predicting in vivo performance of class I and II drugs, Pharm. Res. 15 (1998) 698–705.
[15]J.B. Dressman, M. Vertzoni, K. Goumas, C. Reppas, Estimating drug solubility in the gastrointestinal tract, Adv. Drug Deliv. Rev. 59 (2007) 591–602.
[16]E. Jantratid, N. Janssen, C. Reppas, J.B. Dressman, Dissolution media simulating conditions in the proximal human gastrointestinal tract: an update, Pharm. Res. 25 (2008) 1663–1676.
[17]C. Reppas, M. Vertzoni, Biorelevant in-vitro performance testing of orally administered dosage forms, J. Pharm. Pharmacol. 64 (2012) 919–930. [18]E.M. Persson, A.S. Gustafsson, A.S. Carlsson, R.G. Nilsson, L. Knutson, P. Forsell,
G. Hanisch, H. Lennernas, B. Abrahamsson, The effects of food on the dissolution of poorly soluble drugs in human and in model small intestinal fluids, Pharm. Res. 22 (2005) 2141–2151.
[19]S. Clarysse, D. Psachoulias, J. Brouwers, J. Tack, P. Annaert, G. Duchateau, C. Reppas, P. Augustijns, Postprandial changes in solubilizing capacity of human intestinal fluids for BCS class II drugs, Pharm. Res. 26 (2009) 1456–1466. [20] A. Diakidou, M. Vertzoni, J. Dressman, C. Reppas, Estimation of intragastric
drug solubility in the fed state: comparison of various media with data in aspirates, Biopharm. Drug Dispos. 30 (2009) 318–325.
[21]M. Aulton, Aulton’s Pharmaceutics Churchill Livingstone, Elsevier, London, 2007.
[22]Y. Tsume, P. Langguth, A. Garcia-Arieta, G.L. Amidon, In silico prediction of drug dissolution and absorption with variation in intestinal pH for BCS class II weak acid drugs: ibuprofen and ketoprofen, Biopharm. Drug Dispos. 33 (2012) 366–377.
[23]V.N. Kazakov, A.A. Udod, Zinkovych II, V.B. Fainerman, R. Miller, Dynamic surface tension of saliva: general relationships and application in medical diagnostics, Colloids Surf. B – Biointerfaces 74 (2009) 457–461.
[24]D.J. Aframian, T. Davidowitz, R. Benoliel, The distribution of oral mucosal pH values in healthy saliva secretors, Oral Dis. 12 (2006) 420–423.
[25]C.E. Christersson, L. Lindh, T. Amebrant, Film-forming properties and viscosities of saliva substitutes and human whole saliva, Eur. J. Oral Sci. 108 (2000) 418–425.
[26]A. Bardow, D. Moe, B. Nyvad, B. Nauntofte, The buffer capacity and buffer systems of human whole saliva measured without loss of CO2, Arch. Oral Biol. 45 (2000) 1–12.
[27]M. Moritsuka, Y. Kitasako, M.F. Burrow, M. Ikeda, J. Tagami, The pH change after HCl titration into resting and stimulated saliva for a buffering capacity test, Aust. Dent. J. 51 (2006) 170–174.
[28]C. Fenoll-Palomares, J.V. Munoz-Montagud, V. Sanchiz, B. Herreros, V. Hernandez, M. Minguez, A. Benages, Unstimulated salivary flow rate, pH and buffer capacity of saliva in healthy volunteers, Rev. Esp. Enferm. Dig. 96 (2004) 773–778.
[29]I.H. Bassoukou, J. Nicolau, M.T. dos Santos, Saliva flow rate, buffer capacity, and pH of autistic individuals, Clin. Oral Invest. 13 (2009) 23–27.
[30] U.V. Banakar, Pharmaceutical Dissolution Testing, Informa Healthcare, London, 1992.
[31]R.G. Schipper, E. Silletti, M.H. Vingerhoeds, Saliva as research material: biochemical, physicochemical and practical aspects, Arch. Oral Biol. 52 (2007) 1114–1135.
[32]W.A. Vanderreijden, E.C.I. Veerman, A.V.N. Amerongen, Shear rate-dependent viscoelastic behavior of human glandular salivas, Biorheology 30 (1993) 141– 152.
[33]P.J.F. Rantonen, J.H. Meurman, Viscosity of whole saliva, Acta Odontol. Scand. 56 (1998) 210–214.
[34]A. Vissink, H.A. Waterman, E.J. Sgravenmade, A.K. Panders, A. Vermey, Rheological properties of saliva substitutes containing mucin, carboxymethylcellulose or polyethylenoxide, J. Oral Pathol. Med. 13 (1984) 22–28.
[35]N. Fotaki, W. Brown, J. Kochling, H. Chokshi, H. Miao, K. Tang, V. Gray, Rationale for selection of dissolution media: three case studies, Dissolut. Technol. 20 (2013) 6–13.
[36]N. Vassilakos, T. Arnebrant, P.O. Glantz, Adsorption of whole saliva onto hydrophilic and hydrophobic solid-surfaces – influence of concentration, ionic-strength and pH, Scand. J. Dent. Res. 100 (1992) 346–353.
[37]J.P. Kirkness, T.C. Amis, J.R. Wheatley, H.K. Christenson, Determining the surface tension of microliter amounts of liquid, J. Colloid Interface Sci. 232 (2000) 408–409.
[38]A. Preetha, R. Banerjee, Comparison of artificial saliva substitutes, Trends Biomater. Artif. Org. 18 (2005) 178–186.
[39]V. Erdem, M. Yildiz, T. Erdem, The evaluation of saliva flow rate, pH, buffer capacity, microbiological content and indice of decayed, missing and filled teeth in Behcet’s patients, Balkan Med. J. 30 (2013) 211–214.
[40] F.A. Mohammed, H. Khedr, Preparation and in vitro/in vivo evaluation of the buccal bioadhesive properties of slow-release tablets containing miconazole nitrate, Drug Dev. Ind. Pharm. 29 (2003) 321–337.
[41]BMJ Group, The Royal Pharmaceutical Society of Great Britain, British National Formulary, BMJ Group and Pharmaceutical Press, London, 2013.
[42]M.R.C. Marques, R. Loebenberg, M. Almukainzi, Simulated biological fluids with possible application in dissolution testing, Dissolut. Technol. 18 (2011) 15–28.
[43]J.Y. Gal, Y. Fovet, M. Adib-Yadzi, About a synthetic saliva for in vitro studies, Talanta 53 (2001) 1103–1115.
[44]S.P. Humphrey, R.T. Williamson, A review of saliva: normal composition, flow, and function, J. Prosthet. Dent. 85 (2001) 162–169.
[46]H. Inoue, K. Ono, W. Masuda, T. Inagaki, M. Yokota, K. Inenaga, Rheological properties of human saliva and salivary mucins, J. Oral Biosci. 50 (2008) 134–141. [47]J.F. Prinz, P.W. Lucas, An optimization model for mastication and swallowing
in mammals, Proc. R. Soc. B – Biol. Sci. 264 (1997) 1715–1721.
[48] R.V. Lenth, Java Applets for Power and Sample Size [Computer Software], 2006. [49]D.D. Roberts, T.E. Acree, Simulation of retronasal aroma using a modified headspace technique – investigating the effects of saliva, temperature, shearing, and oil on flavor release, J. Agric. Food Chem. 43 (1995) 2179–2186. [50]S.J. Haward, J.A. Odell, M. Berry, T. Hall, Extensional rheology of human saliva,
Rheol. Acta 50 (2011) 869–879.
[51]M.S. Park, J.W. Chung, Y.K. Kim, S.C. Chung, H.S. Kho, Viscosity and wettability of animal mucin solutions and human saliva, Oral Dis. 13 (2007) 181–186. [52]M.J. Levine, A. Aguirre, M.N. Hatton, L.A. Tabak, Artificial salivas – present and
future, J. Dent. Res. 66 (1987) 693–698.
[53]J.P. Kirkness, H.K. Christenson, J.R. Wheatley, T.C. Amis, Application of the ‘pull-off’ force method for measurement of surface tension of upper airway mucosal lining liquid, Physiol. Meas. 26 (2005) 677–688.
[54]K.D. Madsen, C. Sander, S. Baldursdottir, A.M.L. Pedersen, J. Jacobsen, Development of an ex vivo retention model simulating bioadhesion in the oral cavity using human saliva and physiologically relevant irrigation media, Int. J. Pharm. 448 (2013) 373–381.
[55]R.E. Baier, P.O. Glantz, Characterization of oral in vivo films formed on different types of solid-surfaces, Acta Odontol. Scand. 36 (1978) 289–301.
[56]T. Sonju, T.b. Christen, L. Kornstad, G. Rolla, Electron-microscopy, carbohydrate analyses and biological-activities of proteins adsorbed in 2 hours to tooth surfaces in-vivo, Caries Res. 8 (1974) 113–122.
[57]P.O. Glantz, Interfacial phenomena in the oral cavity, Colloids Surf. A – Physicochem. Eng. Aspects 123 (1997) 657–670.
[58]E. Adamczyk, T. Arnebrant, P.O. Glantz, Time-dependent interfacial tension of whole saliva and saliva-bacteria mixes, Acta Odontol. Scand. 55 (1997) 384–389. [59]D.I. Hay, Interaction of human parotid salivary proteins with hydroxyapatite,
Arch. Oral Biol. 18 (1973) 1517.
[60]L. Braeuer, S. Moeschter, S. Beileke, K. Jaeger, F. Garreis, F.P. Paulsen, Human parotid and submandibular glands express and secrete surfactant proteins A, B, C and D, Histochem. Cell Biol. 132 (2009) 331–338.
[61]B.L. Slomiany, V.L.N. Murty, A. Slomiany, Salivary lipids in health and disease, Prog. Lipid Res. 24 (1985) 311–324.
[62]H. Whelton, in: M. Edgar, C. Dawes, D. O’Mullane (Eds.), Saliva and Oral Health, Stephen Hancocks Limited, England, 2012, pp. 1–36.
[63]K.T. Izutsu, Theory and measurement of the buffer value of bicarbonate in saliva, J. Theor. Biol. 90 (1981) 397–403.
[64]J.D. Rudney, Z. Ji, C.J. Larson, The prediction of saliva swallowing frequency in humans from estimates of salivary flow-rate and the volume of saliva swallowed, Arch. Oral Biol. 40 (1995) 507–512.
[65]P.R. Delvadia, W.H. Barr, H.T. Karnes, A biorelevant in vitro release/permeation system for oral transmucosal dosage forms, Int. J. Pharm. 430 (2012) 104–113. [66]P. Rantonen, Salivary Flow and Composition in Healthy and Diseased Adults, Institute of Dentistry, Faculty of Medicine, University of Helsinki, Helsinki, 2003. pp. 97.
[67]P. Del Vigna de Almeida, A.M. Trinidade Gregio, M.A. Naval Machada, A. Adilson Soares de Lima, L. Reis Azevedo, Saliva composition and functions: a comprehensive review, J. Contemp. Dent. Pract. 9 (2008) 072–080. [68]T. Osterberg, D. Birkhed, C. Johansson, A. Svanborg, Longitudinal-study of
stimulated whole saliva in an elderly population, Scand. J. Dent. Res. 100 (1992) 340–345.
[69]G.J. van der Putten, H.S. Brand, L.M.J. De Visschere, J. Schols, C. de Baat, Saliva secretion rate and acidity in a group of physically disabled older care home residents, Odontology 101 (2013) 108–115.
[70]H. Inoue, K. Ono, W. Masuda, Y. Morimoto, T. Tanaka, M. Yokota, K. Inenaga, Gender difference in unstimulated whole saliva flow rate and salivary gland sizes, Arch. Oral Biol. 51 (2006) 1055–1060.
[71]K. Ono, H. Inoue, W. Masuda, Y. Morimoto, T. Tanaka, M. Yokota, K. Inenaga, Relationship of chewing-stimulated whole saliva flow rate and salivary gland size, Arch. Oral Biol. 52 (2007) 427–431.
[72]T.O. Narhi, N. Kurki, A. Ainamo, Saliva, salivary micro-organisms, and oral health in the home-dwelling old elderly – a five-year longitudinal study, J. Dent. Res. 78 (1999) 1640–1646.
[73]S. Wikner, P.O. Soder, Factors associated with salivary buffering capacity in young-adults in Stockholm, Sweden, Scand. J. Dent. Res. 102 (1994) 50–53. [74]M. Moritsuka, Y. Kitasako, M.F. Burrow, M. Ikeda, J. Tagami, S. Nomura,