R E S E A R C H P A P E R
Effects of principal stress rotation on the wave
–
seabed
interactions
Zhe Wang1
·
Yunming Yang1·
Hai-Sui Yu2Received: 4 September 2015 / Accepted: 17 February 2016 / Published online: 21 March 2016
©The Author(s) 2016. This article is published with open access at Springerlink.com
Abstract This paper simulates the wave–seabed interac-tions considering the principal stress rotation (PSR) by using the finite element method. The soil model is devel-oped within the framework of kinematic hardening and the bounding surface concept, and it can properly consider the impact of PSR by treating the PSR generating stress rate independently. The simulation results are compared with centrifuge test results. The comparison indicates that the simulation with the soil model considering the PSR can better reproduce the test results on the development of pore water pressure and liquefaction than the soil model without considering the PSR. It indicates that it is important to consider the PSR impact in simulation of wave–seabed soil interactions.
Keywords Liquefaction · Non-coaxiality · Principal stress rotation · Soil elastoplastic model · The finite element method
1 Introduction
Study of wave–seabed interaction is essential to offshore developments. There are a few characteristics on loading conditions on seabed soil, and one of them is that the soil is subject to considerable principal stress rotation (PSR). Ishihara and Towhata [6] first proposed that the PSR can
generate plastic deformation and non-coaxiality even without a change in principal stress magnitudes under wave loadings. Continuous PSR can also generate excess pore water pressure and cumulative shear strain in undrained condition. Similar studies are also carried out by Ishihara and Yamazaki [7], Bhatia et al. [2], Miura et al. [11], Gutierrez et al. [5], Yang and Yu [17], and Yang and Yu [18]. Because the plastic deformation caused by the PSR from the wave loading can accelerate undrained soil liq-uefaction, ignoring this PSR-induced deformation may lead to unsafe design. Due to the significance of the PSR in seabed soil, a few experimental studies have been carried out to study it. For instance, Nago and Maeno [12] and Zen et al. [20] investigated the behavior of cohesionless sedi-ments subjected to oscillatory pore pressure with large-scale model in 1-g condition. Sassa and Sekiguchi [13] also carried out a series of centrifuge wave tests on seabeds with fine-grained sand. They found that the soil behaviors are greatly affected by the PSR under the wave loading. They also proposed the concept of critical cyclic stress ratio below which the liquefaction will not occur.
Although researchers have recognized the importance of the PSR in seabed soil and conducted extensive experi-mental studies, there are few considerations of the PSR impact on numerical simulations of wave–seabed soil interactions. Only a few studies can be found in Dunn et al. [4], Li and Jeng [9], and Liu et al. [10]. One of the best known researches in this topic was the finite element simulation conducted by Sassa and Sekiguchi [14]. They implemented a cyclic loading elastoplastic soil model into the finite element analysis to study wave–seabed interac-tion under both progressive and standing waves. They compared the simulation results with the experimental data and found that the sand bed is less resistant to the lique-faction if the PSR is considered in the soil model. & Yunming Yang
Ming.yang@nottingham.edu.cn
1 Department of Civil Engineering, International Doctoral
Innovation Centre, University of Nottingham, Ningbo, China
2 Nottingham Centre for Geomechanics, University of
However, Jeng [8] claims that Sassa’s model has several limitations in the simulation of this kind of problems, such as the lack of consideration of viscosity and the assumption of infinite bed. One of them is that the simulation results from this PSR model seem to be very sensitive to the model parameters, which restricts its application.
This paper aims to take into account the impacts of PSR in the numerical simulations of wave–seabed inter-actions by using a well-established PSR soil model. This model is developed on the basis of kinematic hardening principle with bounding surface concept and critical state concept. It can consider the PSR effect by treating the stress rate generating the PSR independently [19], and the simulation results demonstrate that this model has great ability to simulate the PSR effects in single-element studies. The focus of the paper is on the investigation of the PSR impact on the boundary value problems of wave– seabed interactions. Firstly, the original model and the PSR model will be introduced. Secondly, these two models will be tested in a single-element numerical simulation. Finally, they will be implemented into the finite element software to simulate centrifuge tests of wave–seabed interactions by Sassa and Sekiguchi [13], and the simulation results will be compared with experi-mental results.
2 The original soil model
2.1 Model formulations
A well-established soil model with bounding surface con-cept and kinematic hardening is chosen as the base model. It employs the back-stress ratio as the hardening parameter and the state parameter to represent influences of different confining stresses and void ratios on sand behaviors. It also adopts the critical state concept and phase transformation line. However, it does not give special consideration of the PSR effect. This model will be briefly introduced, and more details about this model can be found in Dafalias and Manzari [3].
The yield function of the model is
f ¼½ðspaÞ : ðspaÞ1=2pffiffiffiffiffiffiffiffi2=3pm ¼0 ð1Þ
where s is the deviatoric stress tensor. P and α are the confining pressure and back-stress ratio tensor, respec-tively.αrepresents the center of yield surface in the stress ratio space whilemis the radius of yield surface, andmis assumed to be a small constant, indicating no isotropic hardening. The normal to the yield surface is defined as:
I¼oofr¼n1
3ðn:rÞI;n¼ rffiffiffiffiffiffiffiffia
2=3 p
m ð2Þ
whereIis the isotropic tensor andnrepresents the normal to the yield surface on the deviatoric plane.rrepresents the stress ratio and is equal tos/p. The elastic shear strain rate is a function of elastic shear modulus and bulk modulus, which are dependent on the confining pressure. The plastic strain ratedep is defined as:
dep¼h iL R ð3Þ
L¼ 1 Kp
of
or :dr ð4Þ
R¼nþ1
3DI ð5Þ
whereLrepresents the plastic multiplier (or loading index), andRis the normal to the potential surface, indicating the direction of the plastic strain rate.Iis the isotropic tensor, and n represents the normal to the yield surface on the deviatoric plane. Kp is the plastic modulus, and D is the dilatancy ratio, and they are defined as:
Kp¼2
3p G0h0ð1cheÞ p pat
1=2
" #
b : n
j j
ðaainÞ: n
j j
ð6Þ
D¼Add : n ð7Þ
wherebanddare the distances between the current back-stress ratio tensor and bounding and dilatancy back-back-stress ratio tensors, respectively. h0, ch, and Ad are the model
parameters.αinis the initial value ofαat the start of a new
loading process and is updated when the denominator becomes negative.
2.2 Model simulations of laboratory experiments
significantly overestimates the volumetric strain in the case of q/p′ = 0.8, 0.7, and 0.6. This is mainly because the original model does not give special consideration to the PSR. To better simulate this problem, a new model is developed based on the original model by separately con-sidering the PSR.
3 The PSR modified soil model
In the PSR modified model, the plastic strain rate is split into the monotonic strain ratedep
mand the PSR strain rate dep
r, where the subscriptsmandrrepresent monotonic and PSR loading hereinafter, respectively. The evolution of hardening parameter is not affected by this separate treat-ment. Therefore, the plastic strain rate can be expressed as:
depm¼h iLm Rm¼ 1 Kpm
of o rdrm
Rm ð8Þ
depr ¼h iLr Rr¼ 1 Kpr
o f o rdrr
Rr ð9Þ
It is assumed that Kpm = Kp and Rm = R (Eqs. 5, 6) because the original model is for non-PSR loading. The direction of PSR strain rate Rr can be expressed as:
Rr¼nrþ1
3DrI ð10Þ
wherenris the direction of deviatoric plastic strain rate and
can be approximated asnfor simplicity.Dris the dilatancy
[image:3.595.54.285.58.390.2]Fig. 1 Stress paths of monotonic loading (a) and pure rotational loading (b) (after [16]
Table 1 Soil parameters of Leighton Buzzard sand used in the finite element analysis
Constant Parameters Value (fraction B) Value (fraction E)
Original model Elasticity G0 275 100
v 0.25 0.25
Critical state M 1.07 1.35
c 0.77 0.712
kc 0.017 0.15
e0 0.77 0.977
n 0.7 0.203
Yield surface m 0.014 0.013
Plastic modulus h0 2.5 10
ch 0.868 0.968
nb 0.7 0.3
Dilatancy A0 0.7 1.0
nd 0.3 0.1
Modified model Plastic modulus h0r 2.27 3.3
nr 1.5 1.5
[image:3.595.52.548.453.682.2]ratio for the PSR loading rate, and it can be derived from the postulate of the PSR dilatancy ratio [5] and expressed as:
Dr¼Ar1a=abha ð11Þ
whereAris a constant for the impact of PSR on the dilatancy.
The plastic modulusKprfor PSR loading rate is defined as:
Kpr ¼2
3p G0h0rð1cheÞ p pat
1=2
" #
b:n
j j
ðaainÞ:n
j j
nr
ð12Þ
whereh0randξrare new model parameters associated with
the PSR. In order to makeKprmore sensitive to the stress
ration,ξr is usually larger than unity.
At present, all new parameters for the modified model are introduced. Finally, to complete the model, the definition of PSR loading rate dσr is required. To determine dσr in general stress space, it is first con-sidered in the space with only x- and y-directions denoted as α. It can be expressed as drar ¼Nardr and then in matrix form as:
drarx
drary
drarxy 0 B B B B B B @ 1 C C C C C C A ¼ 1 2
ðrxryÞ2
8tJa
1 2þ
ðrxryÞ2 8taJ
ðrxryÞrxy 2tJa 1
2þ
ðrxryÞ2 8tJa
1 2
ðrxryÞ2 8taJ
ðrxryÞrxy 2taJ ðrxryÞrxy
4tJa
ðrxryÞrxy
4taJ 1
r2
xy tJa 2 6 6 6 6 6 6 6 4 3 7 7 7 7 7 7 7 5
drx
dry
drxy 0 B B B B B @ 1 C C C C C A ð13Þ (a) (b)
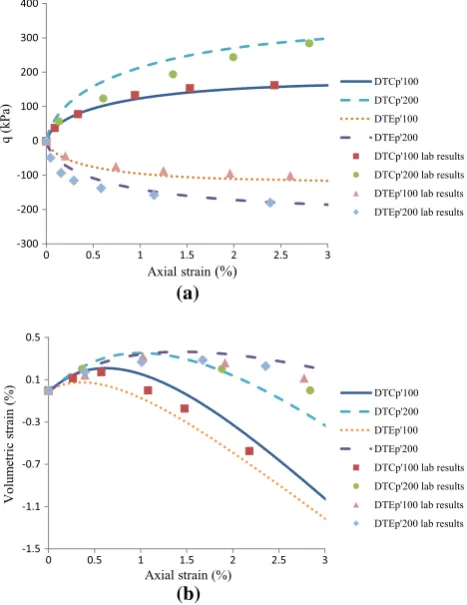
Fig. 2 Comparison between the predicted results and laboratory results under the monotonic loadingastress ratio,bvolumetric strain (tension: positive)
(a)
(b)
[image:4.595.309.539.54.367.2] [image:4.595.52.285.54.388.2]wheretaJ ¼ ðrxryÞ2=4þr2xy. Similarly, in thebspace (y,z) andcspace (z,x), they can be defined as drbr ¼Nbrdrand drcr ¼Ncrdr.Combining drar, drbr, and drcr, and letting drrx¼drarxþdrcrx, drry¼draryþdrbry, and drrz¼drbrzþ drcrz, drrin the general stress space can be obtained as:
drr¼Nrdr ð14Þ
The relationship between the stress and strain rates can be expressed as:
dr¼Eepde ð15Þ
Eep¼EB1
ðERÞðlNrÞ KprþlNrRr
ðERÞðlEÞ KprþlERr
B2 ðERrÞðlN
rÞ lNrR
ðERrÞðlEÞ KpþlER
ð16Þ
Nr ¼2GNr ð17Þ
B1¼
lNrR KprþlNrRr
KpþlER
KprþlERr
1
ð18Þ
B2¼
KprþlNrRr lNrR
KprþlERr KpþlER
1
ð19Þ
where E denotes the elastic stiffness tensor. The above formulations show that the stiffness tensor is independent of stress increments, and the stress and strain increments have a linear relationship, which indicates the easy numerical implementations. In these equations, ifKpris set
to beKpandRr to be R, they will be downgraded to the
formulations in the classical plasticity.
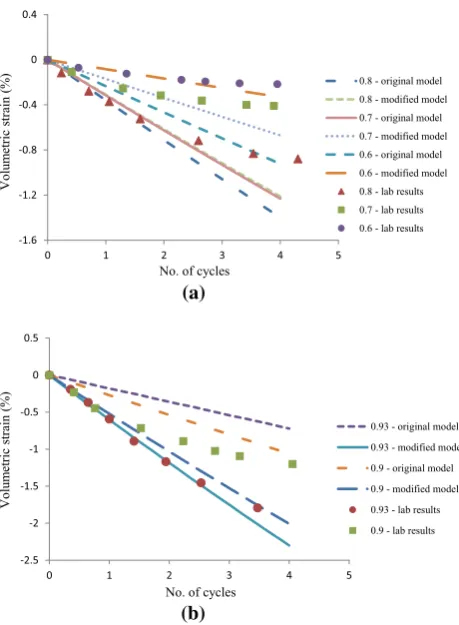
The PSR modified model is used to simulate the above-mentioned laboratory tests. Figure3shows the simulations, compared with the simulations with the original model and test results. In the cases of q/p′ = 0.6, 0.7, and 0.8, the modified model generates less volumetric strain than the original model, which agrees much better with the test results. In the cases of q/p′ = 0.9 and 0.93 close to the failure stress ratio, while the original model significantly underestimates the volumetric strains, the modified model predicts much larger volumetric strains, agreeing better with the test results. Generally, the results from the mod-ified model fit better with the test results than the original model under the PSR. The capability of the PSR modified model will be further verified by the finite element analysis of the following wave–seabed soil interactions.
4 Finite element analysis of wave
–
seabed
interactions
4.1 Problem definition
The centrifuge experimental study carried out by Sassa and Sekiguchi [13] investigates the behaviors of sand bed such
as its liquefaction, under fluid wave trains including the progressive wave and standing wave. These waves can generate the PSR in the seabed soil. In these centrifuge tests with plain strain conditions, a seabed with saturated sand is 100 mm deep and 200 mm wide, and it is subjected to the progressive and standing wave loading, shown in Fig.4. A steady-state acceleration of 50gis applied to the centrifuge. The sand is loose Leighton Buzzard sand (Fraction E, 100/170).The progressive wave and the standing wave have the wavelength denoted byLand wave period by T. These two types of waves are defined by the pore pressure u0on the soil surface (z=0) as:
u ¼u0sinðjxwtÞ ðprogressive waveÞ ð20Þ
u ¼u0cosð Þjx sinð Þwt ðstanding waveÞ ð21Þ
whereu0is the amplitude of the fluid pressure fluctuation imposed on the soil surface.κis the wave number, andwis the angular frequency of the waves, and they are defined as:
j¼2p=L ð22Þ
w ¼ 2p=T ð23Þ
[image:5.595.299.542.54.391.2] [image:5.595.51.287.180.326.2]For the progressive wave loading, eight cases with different u0from 1 to 6 kPa are simulated, given in Table2a. The intensity of the progressive wave is also represented by the cyclic stress ratio, χ0 = κu0/γ′, where the saturated unit weight of soilγ′is 425 kN/m3, andκwas 12.2 m−1[14].The standing wave loadings with diverse cyclic stress ratios are given in Table2b. Their antinodes are set at the middle of the seabed width.
The problem is simulated by the finite element software which adopts the effective stress theory and Forchheimer’s law which is a rigorous format of Darcy’s flow law, and the acceleration is negligible in wave loading with relatively low frequencies. The soil model and two types of waves are implemented by using user subroutines. Generally, the same setting as in the finite element analysis by Sassa and Seki-guchi [14] is used in this simulation, including the coefficient of permeability of 0.0015 m/s, so as to compare the predicted results with their experimental and numerical studies. Quadrilateral elements with four nodes are used for the simulations. The bottom boundary is set to be fixed while the side boundaries are smooth vertically, and all of them are impermeable. All cases analyzed are assumed to be underK0 condition before the wave loading is applied, andK0is set to be 0.52. Twenty-five cycles of wave loadings are considered in total. Furthermore, the numerical implementation of the PSR model is performed using an explicit substepping integration algorithm with automatic error controls. In this integration scheme, the imposed strain increment can be automatically divided based on the prescribed error toler-ance and details can be found in Abbo [1].
The first 13 model parameters in the original model without the PSR for Leighton Buzzard sand (Fraction E, 100/170) are calibrated by using a series of triaxial tests with constant effective confining stress [15], and they are listed in Table1. Some typical simulation results together with test results are shown in Fig.5. This figure indicates that the predicted results generally fit the laboratory results very well. Those three PSR model parameters are basically calibrated to better fit the experimental results from the centrifuge wave tank tests, listed in Table2.
4.2 Predictions under the progressive waves
[image:6.595.50.544.73.198.2]Case P8 with the cyclic stress ratio χ0 = 0.17 is studied first. Figure 6 shows the development of pore water pres-sure and change in effective confining prespres-sure at point a in Fig. 4 in the centerline of the seabed with the depth of 15 mm. Only 19 cycles are recorded in the figure because the modified model has already brought the soil to Table 2 Cases analyzed for progressive wave loading (a) and standing wave loading (b)
Description P1 P2 P3 P4 P5 P6 P7 P8
a
u0 1.0 2.0 3.0 3.5 4.0 4.5 5.0 6.0
χ0=κu0/Ƴ′ 0.03 0.06 0.09 0.10 0.12 0.13 0.14 0.17
Description S1 S2 S3 S4 S5 S6 S7 S8 S9 S10
b
u0 1.0 2.0 3.0 4.0 5.0 6.0 6.7 7.0 7.2 8.0
χ0=κu0/Ƴ′ 0.03 0.06 0.09 0.12 0.14 0.17 0.19 0.20 0.21 0.23
(a)
(b)
[image:6.595.309.543.222.525.2]liquefaction in the 19th cycle. It is proposed that the excess pore water pressure is divided into two parts:
ue¼u1eþu2e ð24Þ
whereue1is the oscillatory part andue2is the residual part,
taking the average of the moving waveue. Unless specified
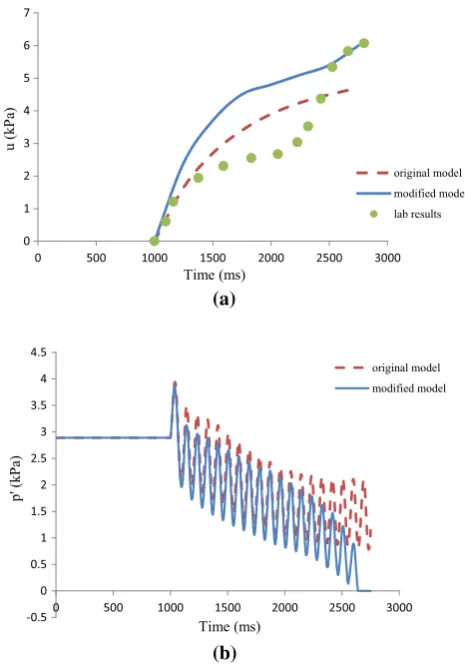
otherwise, all pore water pressures presented in this paper are the residual pore water pressures. Figure 6a shows that a significant buildup of pore water pressure can be observed in the results from both the original model and modified model due to the plastic contractive behavior of sand under the cyclic loading. However, the modified model produces a higher pore water pressure in the whole process and finally reaches a pore water pressure of 6.0 kPa. This value is about 95 % of the initial vertical stress, indicating the occurrence of liquefaction. The original model achieves a maximum pore water pressure of 4.9 kPa, which is lower than the results by the modified model and the laboratory results, and does not reach the liquefaction. Generally, the modified model agrees better with the test results, especially for pore water pressure near the liquefaction. However, both models overestimate the pore water pressure during the early stage of the
simulation. The same difference can be seen in the effective confining pressurep′as well, in Fig.6b. As the progressive wave repeatedly moves along the seabed surface,p′ contin-ues to decrease from both original and modified model. Butp ′from the modified model decreases more rapidly than the original model and finally reaches a value very close to zero as the pore water pressure reaches the maximum value. In the original model, p′ reaches the lowest value of 0.75 kPa, indicating no liquefaction, and the trend becomes flatter after 2 s. Figure 7 shows the predicted stress path of σ13 and (σ1–σ3)/2 by using the original model, which is also similar to the stress path by using the modified model. It shows that the principal stress continuously rotates under the progressive wave. The PSR is more profound with increasing number of progressive wave, where the normal stress difference becomes smaller. It can explain that the predicted pore water pressure by using the original and modified models becomes larger with increasing number of waves, and only the mod-ified model considering the PSR brings soil to liquefaction at the end.
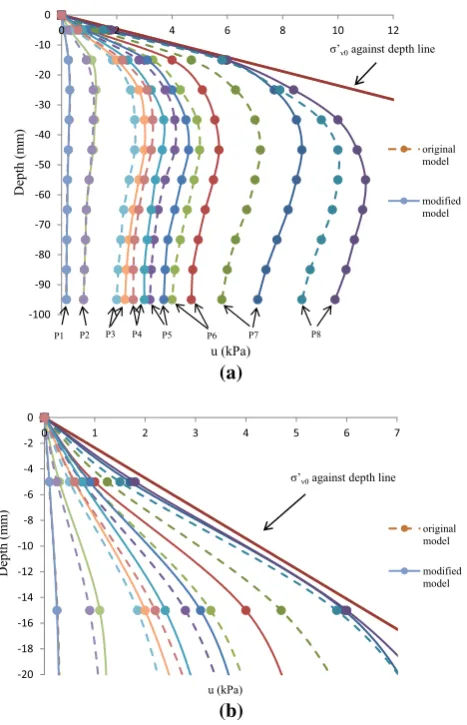
Figure 8 shows the predicted pore water pressure with the depth of seabed soil for all these eight cases after 25 cycles of wave loading. It should be noted that these results are recorded for the full 25 cycles, which is different from the results presented above for 19 cycles of case P8. Generally, all the results show nonlinear behaviors with the depth, especially for the cases with higher cyclic stress ratios χ0, and the largest water pressure occurs around the mid-depth for higher cyclic stress ratios. It shows that a larger cyclic stress ratio leads to a larger pore water pres-sure. In the case of P8 at the depth of 15 mm, the modified model brings the soil to liquefaction in the 19th cycle, while the original model only achieves the maximum pore water pressure of 5.8 kPa in the 25th cycle, which is close but still does not reach liquefaction. In the case of P7, the modified model achieves liquefaction in the last cycle, (a)
(b)
Fig. 6 Time history of pore water pressure (a) and effective confining pressure (b) at point a in case P8 for the progressive wave
[image:7.595.52.285.55.391.2] [image:7.595.310.541.57.211.2]while the original model only predicts the maximum pore water pressure of 4.6 kPa, which is lower than the modified model and does not reach liquefaction. The occurrence of liquefaction in the cases of P7 and P8 predicted by the modified model agrees well with the experimental results by Sassa and Sekiguchi [13]. In their experiments, the cyclic stress ratioχ0of 0.14 in the case of P7 is the critical value, above which liquefaction will occur. In the case of P6, liquefaction does not occur with both two models, but the modified model predicts a larger pore water pressure than the original model. Similarly, the modified model predicts higher pore water pressures than the original model in the cases of P3, P4, and P5. However, this dif-ference between the original model and modified model becomes unapparent when the cyclic stress ratio becomes smaller. In the cases of P1 and P2, the results from the original model and modified model are very similar, only a slight difference around the depth of 15 mm in case P2 can be observed. It is obvious that the impact of PSR in the modified model is dependent on the cyclic stress ratio or
the magnitude of wave loading. This can be explained by the stress path in Fig. 7. A larger wave loading tends to bring the normal stress closer to zero, and the magnitude of normal stress difference becomes closer to the magnitude of shear stress. This will lead to a larger change in principal stress orientation, which results in a larger impact of the modified model.
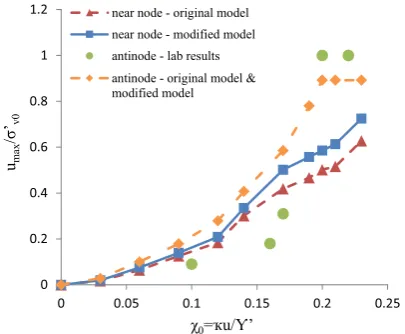
Figure9shows the relationship between the cyclic stress ratio and the normalized pore water pressure at the depth of 15 mm, including the predictions and laboratory results. The test results indicate that a larger cyclic stress ratio leads to a larger pore water pressure. The predictions by the original and modified model reflect this trend, although the predicted pore water pressure is slightly larger than that in the laboratory results at a smaller cyclic stress ratio. The test results also indicate that the soil reaches liquefaction when the cyclic stress ratio is above 0.14, which corre-sponds to the case of P7. This is also called critical cyclic stress ratio [13]. While Fig. 9 indicates that the modified model can very well simulate the occurrence of liquefac-tion above the critical cyclic stress ratio, the original model is not capable of simulating it due to its inappropriate treatment of PSR impacts.
4.3 Predictions under the standing waves
Figure10shows the relationship between the cyclic stress ratio and the normalized pore water pressure under the standing waves at the depth of 5 mm at the antinode in Fig. 4, including both the predictions and laboratory results. It should be noted that the original model and the modified model give almost the same prediction. This is because the antinode is at the centerline in the symmetrical setup under the standing wave, and the shear stress is zero at the antinode, which does not result in the PSR. Similar to the progressive wave loading, the test results in Fig. 10 (a)
(b)
Fig. 8 Predicted maximum pore water pressure under progressive wave loadings,afull range of depth,babove the depth of 20 mm
Fig. 9 Comparison of normalized pore water pressure withχ0at the
[image:8.595.55.289.54.417.2] [image:8.595.323.525.60.202.2]indicate that the pore water pressure increases with increasing cyclic stress ratio until it reaches the critical cyclic stress ratio of 0.2, above which liquefaction occurs. The model predictions can capture this trend, and the predicted pore water pressure increases with increasing cyclic stress ratio, except the predictions are larger than the test results. On the aspect of critical cyclic stress ratio and occurrence of liquefaction, the predictions agree very well with the test results. The model also predicts that the critical cyclic stress ratio is 0.2, and liquefaction occurs above it. Figure10also shows the predictions at the near node, which is close to the side boundary and 85 mm to the centerline. The wave loading is not symmetrical at the near node, and there is shear stress and corresponding change in principal stress orientation. Similar to the predictions under the progressive wave, the predicted pore water pressure by using the modified model is larger than that using the original model due to the impact of PSR.
5 Conclusion
This paper simulates the wave–seabed interaction by using a newly developed PSR model which can properly consider the impact of principal stress rotations. This model is developed based on a well-established original kinematic hardening model which employs the critical state and bounding surface concept. Both the original model and modified PSR model are firstly verified in simulations of soil responses in triaxial tests and hollow cylindrical tests. Although the original model can simulate the responses in triaxial tests very well, its simulation of responses in hol-low cylindrical tests is not accurate. The modified model is
capable of simulating both responses due to its separate consideration of PSR impacts. The model is numerically implemented into the FEM software to study the wave– seabed interactions under both progressive waves and standing waves with various amplitudes, and the following conclusions can be drawn from the simulations.
1. A larger wave loading magnitude, represented by the cyclic stress ratio, leads to a larger pore water pressure in the seabed soil under both progressive and standing waves. This trend of predictions by using both models is in agreement with that in the test results.
2. The progressive loading can generate considerable PSR in the seabed soil, and the impact of PSR increases with increasing wave magnitudes. The PSR soil model predicts larger pore water pressure devel-opment than the original soil model. The PSR model can predict the critical cyclic stress ratio above which soil liquefaction occurs, which is in good agreement with the test results. The original soil model is not capable of bringing the soil into liquefaction.
3. The predictions of pore water pressure development by using both soil models are the same at the antinode under the standing wave, due to its symmetrical condition at the antinode. The predictions of critical cyclic stress ratio are in very good agreement with the test results. Away from the center symmetrical line, the modified model predicts a larger pore water pressure development than the original model.
4. It is evident that both the progressive wave and the standing wave loadings produce the PSR and non-coaxiality in wave–seabed interactions. As the natural wave loadings are much more random and may be the combination of these two types of waves, it is important to consider the PSR effect in offshore foundation designs. Therefore, the modified model presented in this paper has an implication and plays an important role in the simulations of wave–seabed interactions.
Acknowledgments This research was supported by National Nat-ural Science Foundation of China (NSFC Contract No. 11172312/A020311) and the International Doctoral Innovation Centre (IDIC) scholarship scheme. These supports are appreciated. We also greatly acknowledge the support from Ningbo Education Bureau, Ningbo Science and Technology Bureau, China’s MoST and the University of Nottingham.
[image:9.595.69.272.57.224.2]Open Access This article is distributed under the terms of the Creative Commons Attribution 4.0 International License (http://crea tivecommons.org/licenses/by/4.0/), which permits unrestricted use, distribution, and reproduction in any medium, provided you give appropriate credit to the original author(s) and the source, provide a link to the Creative Commons license, and indicate if changes were made.
Fig. 10 Comparison of normalized pore water pressure withχ0at the
References
1. Abbo AJ (1997) Finite element algorithms for elastoplasticity and consolidation, Ph.D. Thesis. University of Newcastle, Australia 2. Bhatia SK, Schwab J, Ishibashi I (1985) Cyclic simple shear,
torsional shear and triaxial—a comparative study. In: Proceed-ings of the advanced in the art of testing soils under cyclic conditions. ASCE, New York, pp 232–254
3. Dafalias YF, Manzari MT (2004) Simple plasticity sand model accounting for fabric change effects. J Eng Mech ASCE 130 (6):622–634
4. Dunn SL, Vun PL, Chan AHC (2006) Numerical modeling of wave-induced liquefaction around pipelines. ASCE J Waterw Port Coast Ocean Eng 132(4):276–288
5. Gutierrez M, Ishihara K, Towhata I (1993) Flow theory for sand during rotation of principal stress direction. Soils Found 31 (4):121–132
6. Ishihara K, Towhata I (1983) Sand response to cyclic rotation of principal stress directions as induced by wave loads. Soils Found 23(4):11–26
7. Ishihara K, Yamazaki A (1984) Analysis of wave-induced liq-uefaction in seabed deposits of sand. Soils Found 24(3):85–100 8. Jeng DS (2013) Porous models for wave-seabed interactions.
Shanghai JiaoTong University Press, Springer, Berlin, pp 279– 296
9. Li J, Jeng DS (2008) Response of a porous seabed around breakwater heads. Ocean Eng 35(8–9):864–886
10. Liu Z, Jeng D-S, Chan AHC, Luan M (2009) Wave-induced progressive liquefaction in a poro-elastoplastic seabed: a
two-layered model. Int J Numer Anal Methods Geomech 33(5):591– 610
11. Miura K, Miura S, Toki S (1986) Deformation behavior of ani-sotropic dense sand under principal stress axes rotation. Soils Found 26(1):36–52
12. Nago H, Maeno S (1987) Pore pressure and effective stress in a highly saturated sand bed under water pressure variation on its surface. J Nat Disaster Sci 9(1):23–35
13. Sassa S, Sekiguchi H (1999) Wave-induced liquefaction of beds of sand in a centrifuge. Geotechnique 49(5):621–638
14. Sassa S, Sekiguchi H (2001) Analysis of wave-induced lique-faction of sand beds. Geotechnique 51(2):115–126
15. Visone C (2008) Performance-based approach in seismic design of embedded retaining walls, Ph.D. thesis. University of Napoli Federico II, Napoli, Annex A1–A21
16. Yang L (2013) Experimental study of soil anisotropy using hol-low cylinder testing. Ph.D. Thesis, University of Nottingham, Nottingham, pp 78–191
17. Yang Y, Yu HS (2006) A non-coaxial critical state soil model and its application to simple shear simulations. Int J Numer Anal Methods Geomech 30:1369–1390
18. Yang Y, Yu HS (2010) Numerical aspects of non-coaxial model implementations. Comput Geotech 37:93–102
19. Yang Y, Yu HS (2013) A kinematic hardening soil model con-sidering the principal stress rotation. Int J Numer Anal Methods Geomech 37:2106–2134
![Fig. 1 Stress paths of monotonic loading (a) and pure rotationalloading (b) (after [16]](https://thumb-us.123doks.com/thumbv2/123dok_us/8662667.375469/3.595.52.548.453.682/fig-stress-paths-monotonic-loading-pure-rotationalloading-b.webp)
![Fig. 4 Sand bed setup for the progressive (a) and standing waveloading (b) (after [13]](https://thumb-us.123doks.com/thumbv2/123dok_us/8662667.375469/5.595.299.542.54.391/fig-sand-bed-setup-progressive-standing-waveloading-b.webp)