1
Use of conspicuity aids by cyclists and risk of crashes involving
other road users: population based case-control study.
Philip D Miller a,b*, Denise Kendricka, Carol Couplanda, Frank Coffeyb
a Division of Primary Care, School of Medicine, University of Nottingham, The Tower,
University Park, Nottingham, NG7 2RD, United Kingdom
b Emergency Department, Nottingham University Hospitals NHS Trust, Derby Road,
Nottingham, NG7 2UH, United Kingdom
* Corresponding Author
Email addresses:
Philip Miller: [email protected]
Denise Kendrick: [email protected]
Carol Coupland: [email protected]
2
Abstract
Background:
Cycling can improve health and well-being by reducing inactivity. Concern about collision
crashes may be a barrier to participation since collision crashes can lead to significant
mortality and morbidity. The conspicuity of cyclists may be a contributory factor in some
collision crashes. This study investigated whether increased conspicuity aid use (such as
reflective or fluorescent clothing) is associated with a reduced risk of collision crashes for
cyclists in a UK city.
Methods:
A matched case-control study was undertaken. Cases were adult cyclists involved in a
collision crash causing injury. Controls were adult cyclists matched to cases by time of day,
day of week and geographical area of travel. Exposures, potential confounders and route
were reported by participants. Odds ratios (OR) and 95% confidence intervals were
calculated using conditional logistic regression.
Results:
76 cases and 272 controls were included. 69.7% of cases and 65.4% of controls reported
using a conspicuity aid on the crash (cases) or index (controls) journey. The unadjusted OR
for a collision crash when using any conspicuity aid vs none was 1.2 (95% CI 0.7 to 2.2) and
2.4 (95% CI 1.1 to 5.6) after adjustment for age, gender, index of multiple deprivation score,
route risk score and previous bicycle crash.
Conclusion:
This study found no evidence that cyclists using conspicuity aids were at reduced risk of a
collision crash compared to non-users after adjustment for confounding, but there was
some evidence of an increase in risk. Bias and residual confounding from differing route
selection and cycling behaviours in users of conspicuity aids are possible explanations for
these findings. Conspicuity aids may not be effective in reducing collision crash risk for
cyclists in highly-motorised environments when used in the absence of other bicycle crash
3 Keywords
4
1. Introduction
Regular cycling has been shown to improve health and well-being and has a role in tackling
obesity and inactivity (1-4). The total distance travelled by bicycle in Britain has declined
from 24 billion kilometres in 1948 to around 5.2 billion kilometres in 2014 which equates to
around 1% of all travel (5). In 2015 the average person travelled 5,159 miles by car, 184
miles on foot but only 53 miles by bicycle (6).
Cycle collisions, particularly those involving motorised vehicles, can lead to considerable
mortality and morbidity (7, 8). In addition to these direct consequences, participation in
cycling may be reduced in highly motorised environments in part because of the widely held
view that cycling is dangerous (9). There is emerging evidence that “near-miss” incidents
involving no injury are common and act as a considerable disincentive to cycling (10, 11).
Low rates of cycling may increase risk for individual cyclists as increases in numbers of
people cycling are associated with lower rates of bicycle crashes for individuals (12-14).
There is evidence that the conspicuity of cyclists may be a factor in some collision crashes
(15). Late detection by drivers of other road users has been highlighted as the most ‘basic
driver error’ leading to collisions (16). Many drivers report not being aware of cyclists prior
to collisions (17). Detailed analyses of crashes suggest that cyclists may be difficult for
drivers to detect owing to their road position, low relative speed and small size (18). Given
these findings it is reasonable to ask whether increasing the conspicuity of cyclists could
reduce the incidence of collision crashes.
Moderate to low-cost retro-reflective and fluorescent clothing and accessories are widely
available for use by cyclists. There are a considerable variety of configurations of such
materials in use by cyclists, many of which include both modes of action incorporated in
parts of jackets or trousers or worn over other clothing (“snap-wraps”, gilets or “Sam
Browne” belts etc). A systematic review examining the literature concerning the
effectiveness of conspicuity aids found test-circuit and simulated studies only and concluded
that they can increase the distances at which drivers can detect and then recognise cyclists
and pedestrians (19). The review found no studies which reported the effectiveness of
5
poorly understood. One study found relatively low rates of use by urban cyclists observed in
a Canadian city during daylight hours (20). Other published findings suggest that cyclists
estimate the potential for such clothing to increase conspicuity to be greater than do car
drivers (21). It has also been suggested that some cyclists may assume that the use of lights
alone may be sufficient to make them conspicuous at night and therefore that there is little
benefit in using additional conspicuity apparel (22).
There is some evidence that the use of conspicuity aids is associated with a reduction in
odds in both motorcyclists and cyclists although this is inconsistent. A case-control study of
crash-involved motorcyclists in New Zealand reported a 37% reduction in the odds of a
crash for riders who were using conspicuity aids at the time of the crash compared to those
who did not (OR 0.63; 95% CI; 0.42 to 0.94)(23). An analysis of data collected via an online
survey from cyclists in a public cycling event in New Zealand also suggested that there may
be a protective effect of conspicuity aid use with a 28% reduction in the odds of a crash for
cyclists who reported always wearing fluorescent colours compared to those who reported
never wearing them (24). Both studies included crashes where the rider lost control with no
other road user being involved despite it being unlikely that conspicuity is a causal factor in
incidents of this type. More recently a re-analysis of longer-term follow-up data from the
bicycle study in New Zealand restricted to bicycle/motor-vehicle collision crashes showed an
increased risk for cyclists using greater amounts of conspicuity aids in some geographical
regions but not in others (25). An analysis of Canadian cyclists injured in collisions involving
motor vehicles compared to cyclist-only crashes found light-coloured upper body clothing to
be protective in daylight (26). Fluorescent and reflective clothing in various combinations
was not found to reduce crash risk in daylight or darkness, whilst red/yellow/orange upper
body clothing and having tail lights on were both associated with an increased odds of
collision in darkness. There was a reduction in the risk of hospitalisation among cyclists using
one or more conspicuity aids (adjusted OR 0.21; 95% CI 0.04 to 1.00) and this was significant
for those using two or more aids (adjusted OR 0.10; 95% CI 0.02 to 0.41).
The study reported in this paper was designed to investigate the relationship between the
use of conspicuity aids and the risk of injury requiring emergency department assessment or
6
2. Material and Methods
2.1 Study design
A matched case-control study was undertaken as described in the published protocol (27).
2.2 Selection of cases
Cases were adult cyclists, aged 16 and over, involved in a crash resulting from a collision or
attempted evasion of a collision with another road user and who attended the emergency
department (ED) at the Nottingham University Hospitals Trust for assessment and treatment
of their injuries. Cyclists were eligible for inclusion if they were commuting to work (defined
as making a journey to or from their place of work or study or on a work or study related
trip) or for utility purposes (defined as travelling for a purpose such as shopping where they
would park or dismount in a public place at some point during their journey). Cyclists were
excluded if they were travelling for leisure, training or competitive purposes owing to the
likely differences between such cyclists and commuter or utility cyclists and also the
practical difficulty of recruiting similar controls engaged in these activities. In addition cases
were excluded if they had been fatally injured, if their crash occurred between 11pm and
5am or if their crash occurred outside the study catchment area (the catchment area of
Nottingham University Hospitals NHS Trust ED).
The majority of cases were identified from ED records and contacted by post, in addition a
small number of case cyclists were approached and recruited during their initial attendance
at ED.
2.3 Selection of controls
Controls were commuter or utility cyclists recruited at company or organisational premises
or public places prior to or following a cycle journey within the same geographical area as
7
incidence density basis with a target ratio of four controls per case. They were individually
matched to cases by journey time (to within plus or minus 1 hour of the case’s crash time)
and day of the week within six weeks of their case’s crash, to reduce confounding from
short-term and seasonal variations in traffic patterns, environmental conditions and
changes in available cycling populations at risk at different times of day. Recruitment and
data collection for cases and controls was completed between June 2008 and July 2010.
Controls were approached by a researcher and informed about the study. If they agreed to
take part they were given a questionnaire to complete.
2.4 Data collection
Data on the use of conspicuity aids was collected using self-completed questionnaires.
Participants were asked to record their use of reflective and fluorescent items of clothing
and equipment on the crash journey (cases) or the index journey on the day of recruitment
(controls). Data were also collected on demographic characteristics (age, sex, ethnic group),
years of cycling experience, previous cycling injuries, bicycle use, cycle helmet use,
psychological traits associated with risk-taking behaviour (Normlessness (28) and sensation
seeking (28, 29)) and the prevailing light and weather conditions during their journey. Index
of multiple deprivation scores (30) were derived using postcodes for the homes of
participants. Participants were asked to illustrate the route of their crash journey (cases) or
index journey (controls) on maps of the study area supplied with the questionnaire.
A measure of cycling injury risk was derived for each of the routes provided by the
participating cyclists. To calculate this measure, observations of cyclist numbers were made
by a researcher over two hour intervals during peak and off-peak periods at randomly
selected sites along each participant’s route. The numbers of police recorded bicycle injury
crashes along the route in the previous three years was also calculated using information
extracted from publicly available data for the three years immediately preceding the study
period
(http://webarchive.nationalarchives.gov.uk/20121017175053/http://innovate.direct.gov.uk
/2009/03/10/pedalling-some-raw-data/ last accessed 05/02/2016) The data on cyclist
numbers, previous recorded bicycle crashes and route length were combined to give an
8
participant’s route to adjust for potential confounding from this source (see Appendix 1 in
supplement).
2.5 Exposures
The primary exposure of interest was use of any conspicuity aid (reflective or fluorescent on
upper body or lower body clothing or on cycle helmet) on the index journey.
Other exposure variables were any fluorescent or retro-reflective or light coloured materials
worn as part of upper or lower body clothing or cycle helmet, cycle-mounted reflectors,
front or rear lights and any other safety equipment intended to increase conspicuity.
2.6 Validation study
To validate the self-reported responses on conspicuity aid use, independent observations of
the use of fluorescent and retro-reflective clothing and cycle helmet use of cases and
controls were undertaken by a researcher during face to face recruitment at matched sites
(controls) and within the local Emergency Department when possible (cases).
2.7 Sample Size
Two observers (PM and DK) recorded conspicuity aid use amongst cyclists within the study
area during peak hours as a pilot study to inform the sample size calculation. The proportion
of cyclists observed to be using any fluorescent or reflective clothing or item was 44% during
peak hours (n=64; 95% CI 31% to 57%). It was assumed that the majority of cyclists at this
time were commuters and that this represented a realistic estimate of exposure for the
target population. A power calculation showed that with a 44% prevalence of use 218
cases and 872 matched controls were required with a matched case-control correlation of
0.2 and a ratio of 1:4 cases to controls, to give the study 80% power (2-sided alpha= 0.05) to
detect an OR of 0.63 for collision crash when using conspicuity aids.
2.8 Statistical Analysis
All analyses were conducted using Stata version 10 (Stata Corp, Texas, USA). The
characteristics of cases and controls were described using proportions, means and standard
9
Conditional logistic regression was used to estimate ORs with 95% confidence intervals to
quantify the relationship between the exposures of interest and the odds of collision or
evasion crash. To account for potential confounding variables first age and gender were
included in the model as a priori variables, then a backwards elimination process was used
starting from an initial model containing all potential confounders with a Wald significance
value less than 0.25 in a univariate analysis (31). Third, confounders were removed from the
model if their removal altered the OR for the primary exposure variable (conspicuity aid use)
by less than 10% (32). The linearity of continuous covariates with the outcome was tested
and variables were categorised where appropriate. Interactions between conspicuity aid use
and covariates in the final model were assessed using likelihood ratio tests and deemed
significant if p<0.05.
Validation of the self-reported primary exposure variable was undertaken by comparison to
independent observations. Agreement was estimated using kappa coefficients with 95%
confidence intervals. The sensitivity, specificity and positive and negative predictive values
of self-reported exposures were calculated using the independent observations as the
reference values.
2.9 Ethical approval
The study was reviewed and approved by Nottingham Research Ethics Committee 1 (ref.
08/H0407/13) and authorization to conduct the research at the study site was given by the
Research and Development Department of the Nottingham University Hospitals NHS Trust (ref.
07AE003).
3. Results
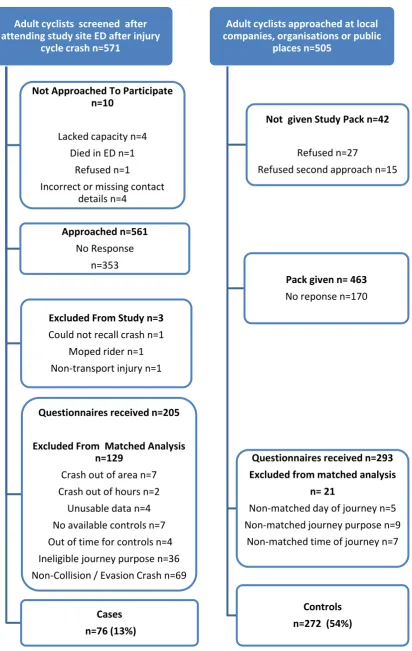
After application of the inclusion and exclusion criteria 76 cases and 272 controls were
eligible for inclusion in the primary analysis. The recruitment process is shown in Figure 1. It
10
on collision crash involvement as opposed to non-collision crashes could not be ascertained
for non-responders.
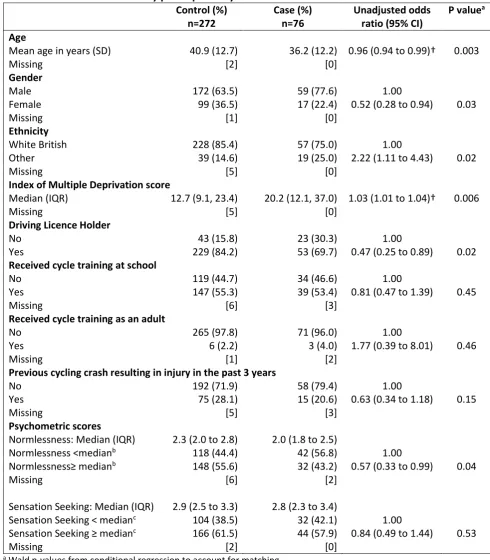
The characteristics of study participants are described in Table 1, along with unadjusted
ORs. Cases were significantly younger than controls (mean 36 years vs 41 years), more likely
to be male (77.6% vs 63.2%), more likely to live in a deprived area (index of multiple
deprivation median 20 vs 13) and were less likely to hold a driving licence (69.7% vs 84.2%).
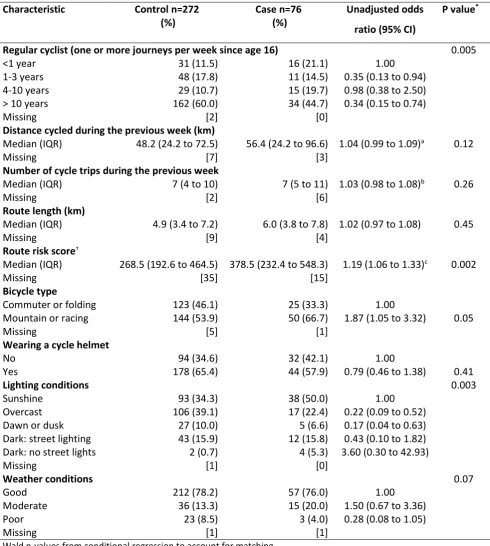
Information on bicycle use, cycling experience and characteristics of the index journey for
cases and controls is shown in Table 2 with unadjusted ORs. The number of years of regular
cycling as an adult differed significantly between cases and controls with the proportion of
cases reporting less than a year of regular cycling experience being nearly twice that of
controls (21.1% vs. 11.5%) and fewer cases than controls reporting cycling regularly for
more than 10 years (44.7% vs. 60.0%). Cases and controls did not differ significantly in the
distance they had cycled or the numbers of trips they made in the seven days prior to their
reported index journey. Increasing route risk scores were associated with significantly
higher odds of a crash such that for every 100 additional recorded bicycle crashes per 100
million cyclists per kilometre there was a 19% increase in the odds of a crash (95% CI 6% to
33%). Riding a racing or mountain bike rather than a commuter or folding bike was
associated with a significantly increased crash risk. The proportions using cycle helmets
were similar in both groups. Cycling during overcast conditions or at dawn or dusk was
associated with a significantly lower crash risk compared with daylight.
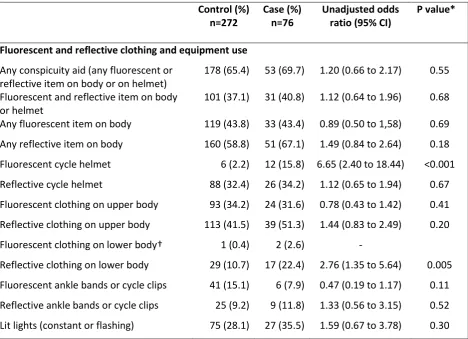
Details of conspicuity aid use are presented in Table 3. Cases and controls were similar
overall in their use of conspicuity aids with 65.4% of controls and 69.7% of cases reporting
use of any fluorescent or reflective clothing or item (unadjusted OR 1.20, 95% CI 0.66 to
2.17). Cases were significantly more likely than controls to report wearing fluorescent
helmets and having reflective materials on the lower body although the numbers using
either aid were small. The proportions of cases and controls using fixed conspicuity aids (e.g.
reflectors, lights etc) were very similar overall. The use of lit lights (flashing and constant
11
CI 0.67 to 3.78) and was associated with conspicuity aid use (unmatched OR 4.46, 95% CI
2.40 to 8.28) but had minimal influence on the odds ratio in the multivariate model.
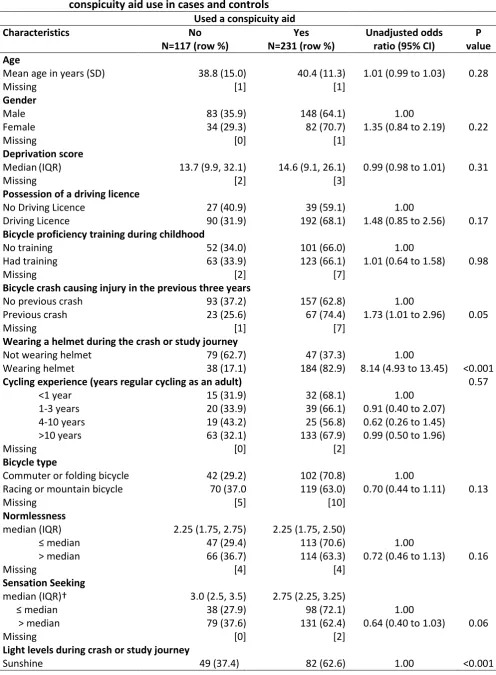
Table 4 shows unadjusted associations between participant and bicycle use characteristics,
and the use of conspicuity aids (use of any fluorescent or reflective clothing or item). The
use of conspicuity aids was significantly higher among participants who had been involved in
a previous bicycle crash, who used a cycle helmet, who were travelling in darkness and
whose journey was greater than the median route distance (5.2 kilometres). There was no
significant association between use of conspicuity aids and the route risk estimate.
The great majority of case journeys were undertaken during daylight hours and these were
matched to control recruitment on an incidence-density basis. Daytime crashes are common
and we included them given the hypothesis given that fluorescent materials are only
effective in the presence of ultraviolet light and are therefore thought to be most effective
when daylight is present but limited e.g. dawn or dusk.
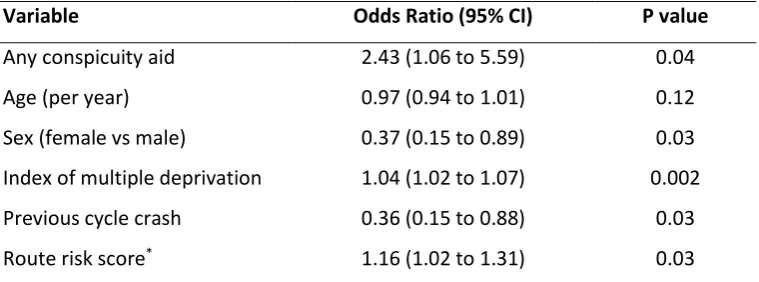
In the multivariable analysis after adjustment for confounding from age, gender and other
confounders which altered the estimated OR for use of conspicuity aids by greater than 10%
(namely deprivation, route risk and history of a previous cycle crash) the use of conspicuity
aids was associated with a significant increase in the odds of a crash (OR 2.43; 95% CI 1.06
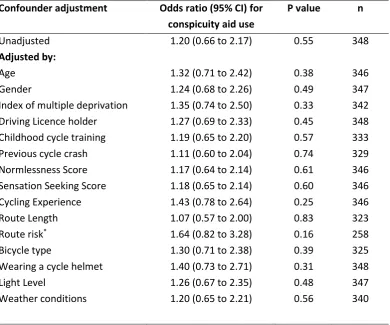
to 5.59) (Table 5). Odds ratios for conspicuity aid use adjusted by individual confounding
variables are shown in Table 6. The greatest changes in ORs were for adjustment by cycling
experience, helmet use and route risk which all resulted in increases in the OR for
conspicuity aid use.
Validation of exposure data
Independent observations on use of any fluorescent or reflective clothing or item were
made for 369 potential controls and 15 potential cases during recruitment, and 224 of these
controls and 4 cases returned questionnaires and were eligible for the main study. Among
these 228 participants the kappa coefficient for agreement between the self-reported and
independently observed exposures for eligible participants was 0.42 (95% CI 0.32 to 0.51).
12
4. Discussion
4.1. Principle findings and their interpretation
This study found no evidence that the use of conspicuity aids was associated with a reduced
odds of a collision crash for cyclists. Instead it was found that there was an increased odds
of a collision crash associated with use of conspicuity aids after adjustment for confounding
from measurable sources. This result is inconsistent with the body of evidence suggesting
that conspicuity aids are effective in increasing detection and recognition distances in
test-circuit and otherwise simulated road conditions (15, 19). These results do however support
some other findings in the recent literature showing little or no protective benefit and even
some potential for increased collision crash risk from the use of conspicuity aids in
motorised traffic environments (25, 26).
Taken together this emerging body of evidence suggests that a “risk over-compensation”
effect may be at work. Cyclists who choose to wear conspicuity aids may increase their
exposure to motorised traffic or conversely, conspicuity aids may be worn if a journey is
thought to involve greater exposure to traffic danger. Also cyclists who wear conspicuity
aids may alter their behaviour in traffic. Such behavioural adaptations could give rise to an
increased risk of collisions if cyclists using conspicuity aids believe themselves to be more
conspicuous to motorists than they actually are. Conspicuity aids along with lights and
reflectors are among the safety equipment items that cyclists commonly adopt to reduce
their risk of collision crashes. The degree to which such equipment does reduce collision risk
in real traffic environments is potentially limited and in turn cyclists’ beliefs about efficacy
may alter choice of route, voluntary exposure to motorised traffic and cycling behaviour in
ways which place them at greater risk than would otherwise choose.
This study was able to adjust for a number of sources of potential confounding including
that posed by route selection and risk from traffic. There were significant differences in the
level of crash risk represented by the routes chosen by cases and controls but no significant
13
based on the measure of route risk used in this study. This suggests that conspicuity aid
users do not compensate for increased perceived conspicuity by selecting routes with
greater exposure to traffic risk. However the second form of compensatory behaviour may
have occurred if there were changes in cyclist’s behaviour in traffic as a result of their use of
conspicuity aids. For example, users may have adopted more exposed road positions or
manoeuvres involving crossing the path of motorised vehicles more frequently in the belief
that they were relatively conspicuous. If such compensatory behaviour was common
amongst users this could explain why the study did not show the protective effect from
conspicuity aid use predicted by experiments under “laboratory” conditions where subjects
were not at actual risk of injury. Such differences in behaviour are difficult to measure and
may not be well represented in our study by proxy measures such as age or cycling
experience.
Conspicuity aid use may also lead to compensatory changes in road behaviour by other road
users who encounter cyclists. A study conducted on the UK road system at four sites, two
rural and two suburban, measured the passing distances of motor vehicles overtaking a
cyclist using different conspicuity aids (33). Across the four sites the use of a fluorescent
vest did not increase the passing space afforded the cyclist by motor vehicle drivers, but at
one of the suburban sites there was a significant increase in passing space when the vest
was used with a mean increase of 61 mm, and a corresponding reduction in the proportion
of passes within one metre but this did not occur on rural roads. There were significant
increases in passing distances with use of a side bar with either a flag or a reflective disc
projecting to the off side across the sites. More recent work has suggested that safety
equipment use such as a cycle helmet is associated with a reduction in the passing distance
of vehicles although conspicuity aids such as fluorescent vests were not tested (34). A recent
interview study analysing cyclists’ perceptions of safety clothing use suggests that use of
conspicuity-enhancing clothing is associated with the level of subjective risk encountered
especially from motorised traffic and that many participants were unsure of the degree of
actual safety benefit conferred (35).
14
The study described here represents the first published attempt to examine the effect of
conspicuity aid use by cyclists on the odds of a collision crash adjusted for traffic
environments as measured by previous bicycle crash incidence along the selected route. The
relationship found between the odds of a crash and an objective measure of the route risk is
novel. Our measure of route risk may however fail to capture all of the aspects of risk such
as surface condition, infrastructure and traffic speeds and densities but represents a
different approach to controlling for confounding in previous studies. Further research is
needed to understand better the geographical distribution of traffic risk for cyclists, which
features of the environment carry the most risk, how this impacts on the effects of safety
practices and how such dangers can best be reduced.
There are a number of limitations to the study which mean that the results should be
treated with caution. The participation rate was low, participants may have been aware of
the hypothesis being explored and there is potential for recall bias. The number of
participants recruited was lower than that required by the power calculation and the study
lacks power to detect anything but a large protective effect and also to detect interactions
with weather or lighting conditions. A larger multi-centre study is needed, with a higher
participation rate and capture of exposure data from cases at the time of their crash to
reduce recall bias.
It was only possible to makes independent observations of exposure data on a small number
of cases as the majority could not be approached in person after their crash or they had
disposed of the clothing they were wearing during the crash prior to being approached in
person by the researcher. This means it was only possible to verify the reporting of
self-reported exposures for a small proportion of cases compared to controls. The validity of this
data could have been affected by recall or social desirability biases, where those involved in
collisions may have reported what they perceived to be the socially acceptable responses
(i.e. wearing conspicuity aids) to a greater extent than controls.
Overall the validation data, despite the small sample size, suggested that some respondents
may have over-estimated their use of conspicuity aids, with only moderate agreement with
15
towards unity; this is not necessarily the case if misclassification differs between cases and
controls. Both cases and controls reported greater levels of use of conspicuity aids than that
collected during field observations (44%), but unlike the study participants these
observations may have included leisure cyclists despite being recorded during the rush hour.
The relative performance of conspicuity aids was not measured directly to assess whether
they conformed to existing safety standards. Some aids used by participants may have met
safety standards whilst others were relatively ineffective, in poor condition or used
inappropriately, but there is no reason to think this was likely to differ between cases and
controls. The possibility remains that aids conforming to existing safety standards for
protective equipment, in good condition and used appropriately may indeed be protective.
This cannot be confirmed unless the relative conspicuity enhancing performance of
participants’ garments can be measured directly or otherwise standardised in future studies.
Conclusion
The results of this study suggest that interventions reliant on increasing cyclist conspicuity
may not improve cyclists’ safety in urban traffic environments in the UK. This is consistent
with an emerging body of evidence from similar traffic environments in other developed
countries showing little protective effect but further studies are required to confirm and
explain these findings. Future research should aim to minimise the risk of biases and be
designed to measure the effects of any compensatory behaviours by cyclists such as
relatively greater tolerance of risks, resulting from their choice to use conspicuity aids. The
variable distribution of traffic risk across the study area and its association with collision
crash involvement suggest that reducing traffic danger by limiting motor vehicle speeds or
increasing segregation of cyclists may be more fruitful approaches to reducing the current
16 Conflicts of Interests
None
Authors’ Contributions (INITIALS REMOVED FOR REVIEW PURPOSES)
PM was responsible for recruitment, data collection and analyses and has written the
manuscript. CC and DK proposed the original study design, co-authored the protocol and
supervised the conduct and analysis of the study. FC is the local collaborator for the study
and has commented on the manuscript and original design. All authors read and approved
the final manuscript.
Acknowledgments
The authors wish to thank the many individual cyclists who participated in the study.
Funding
The study was sponsored by the University of Nottingham and funding was provided by the
17 References
1. Oja P, Vuori I, Paronen O. Daily walking and cycling to work: their utility as health-enhancing physical activity. Patient Education and Counseling. 1998;33(Supplement 1):S87-S94.
2. Andersen LB, Schnohr P, Schroll M, Hein HO. All-Cause Mortality Associated With Physical Activity During Leisure Time, Work, Sports, and Cycling to Work. Arch Intern Med. 2000;160(11):1621-8.
3. Bucksch J. Physical activity of moderate intensity in leisure time and the risk of all cause mortality. Br J Sports Med. 2005;39(9):632-8.
4. de Hartog JJ, Boogaard H, Nijland H, Hoek G. Do The Health Benefits Of Cycling Outweigh The Risks? Environ Health Perspect. 2010.
5. Department for Transport. Road traffic statistics: 2014. London; 2015.
6. Department for Transport. National Travel Survey: England 2015. London; 2016 7. European Road Safety Observatory. Traffic Safety Basic Facts 2007: Bicycles.
SafetyNet; 2008.
8. Rivara F, Sattin RW. Preventing bicycle-related injuries: next steps. Inj Prev. 2011;17(3):215-.
9. Department for Transport. Attitudes to Walking and Cycling. HMSO; 2003.
10. Aldred R, Crosweller S. Investigating the rates and impacts of near misses and related incidents among UK cyclists. Journal of Transport & Health. 2015;2(3):379-93.
11. Sanders RL. Perceived traffic risk for cyclists: The impact of near miss and collision experiences. Accident Analysis & Prevention. 2015;75:26-34.
12. Jacobson PL. Safety in numbers: more walkers and bicyclists, safer walking and bicycling. Injury Prevention. 2003;9:205-9.
13. Schepers P. Does more cycling also reduce the risk of single-bicycle crashes? Injury Prevention. 2012;18(4):240-5.
14. Tin Tin S, Woodward A, Thornley S, Ameratunga S. Regional variations in pedal cyclist injuries in New Zealand: safety in numbers or risk in scarcity? Aust N Z J Public
Health. 2011;35(4):357-63.
15. Knowles J. Collisions Involving Cyclists on Britain’s Roads: Establishing the Causes. London 2010.
16. Rumar K. The basic driver error: late detection. Ergonomics. 1990;33(10-11):1281-90. 17. Rowe BH, Rowe AM, Bota GW. Bicyclist and environmental factors associated with
fatal bicycle-related trauma in Ontario. Can Med Assoc J. 1995;152(1):45-53. 18. Cowland S. Pedal cyclist collisions and casualties in Greater London. 2008.
19. Kwan I, Mapstone J. Visibility aids for pedestrians and cyclists: a systematic review of randomised controlled trials. Accident Analysis & Prevention. 2004;36(3):305-12. 20. Hagel BE, Lamy A, Rizkallah JW, Belton KL, Jhangri GS, Cherry N, et al. The prevalence
and reliability of visibility aid and other risk factor data for uninjured cyclists and pedestrians in Edmonton, Alberta, Canada. Accident Analysis & Prevention. 2007;39(2):284-9.
18
22. Wood JM, Tyrrell RA, Marszalek R, Lacherez P, Carberry T, Chu BS. Using reflective clothing to enhance the conspicuity of bicyclists at night. Accident Analysis & Prevention. 2012;45:726-30.
23. Wells S, Mullin B, Norton R, Langley J, Connor J, Lay-Yee R, et al. Motorcycle rider conspicuity and crash related injury: case-control study. British Medical Journal. 2004;328(7444):857-.
24. Thornley SJ, Woodward A, Langley J, Ameratunga S, Rodgers A. Conspicuity and bicycle crashes: preliminary findings of the Taupo bicycle study. Injury Prevention. 2008;14:11-8.
25. Tin Tin S, Woodward A, Ameratunga S. The role of conspicuity in preventing bicycle crashes involving a motor vehicle. European Journal of Public Health.
2015;25(3):517-22.
26. Hagel BE, Romanow NTR, Morgunov N, Embree T, Couperthwaite AB, Voaklander D, et al. The relationship between visibility aid use and motor vehicle related injuries among bicyclists presenting to emergency departments. Accident Analysis & Prevention. 2014;65:85-96.
27. NOT SHOWN FOR REVIEW PURPOSES
28. Iversen H, Rundmo T. Personality, risky driving and accident involvement among Norwegian drivers. Personality and Individual Differences. 2002;33(8):1251-63. 29. Stephenson MT, Hoyle RH, Palmgreen P, Slater MD. Brief measures of sensation
seeking for screening and large-scale surveys. Drug and Alcohol Dependence. 2003;72(3):279-86.
30. Department for Communities and Local Government. The English Indices of Deprivation 2007. 2007.
31. Hosmer D, Lemeshow S. Applied Logistic Regression. Second ed. New York: John Wiley and Sons; 2000.
32. Maldonado G, Greenland S. Simulation study of confounder selection strategies. American Journal of Epidemiology. 1993;138(11):923-36.
33. Watts GR. Bicycle safety devices-effects on vehicle passing distances. Crowthorne: TRRL; 1979.
34. Walker I. Drivers overtaking bicyclists: Objective data on the effects of riding position, helmet use, vehicle type and apparent gender. Accident Analysis & Prevention. 2007;39:417-425.
19 Table 1 Characteristics of study participants by case-control status
Control (%) n=272
Case (%) n=76
Unadjusted odds ratio (95% CI)
P valuea
Age
Mean age in years (SD) 40.9 (12.7) 36.2 (12.2) 0.96 (0.94 to 0.99)† 0.003
Missing [2] [0]
Gender
Male 172 (63.5) 59 (77.6) 1.00
Female 99 (36.5) 17 (22.4) 0.52 (0.28 to 0.94) 0.03
Missing [1] [0]
Ethnicity
White British 228 (85.4) 57 (75.0) 1.00
Other 39 (14.6) 19 (25.0) 2.22 (1.11 to 4.43) 0.02
Missing [5] [0]
Index of Multiple Deprivation score
Median (IQR) 12.7 (9.1, 23.4) 20.2 (12.1, 37.0) 1.03 (1.01 to 1.04)† 0.006
Missing [5] [0]
Driving Licence Holder
No 43 (15.8) 23 (30.3) 1.00
Yes 229 (84.2) 53 (69.7) 0.47 (0.25 to 0.89) 0.02 Received cycle training at school
No 119 (44.7) 34 (46.6) 1.00
Yes 147 (55.3) 39 (53.4) 0.81 (0.47 to 1.39) 0.45
Missing [6] [3]
Received cycle training as an adult
No 265 (97.8) 71 (96.0) 1.00
Yes 6 (2.2) 3 (4.0) 1.77 (0.39 to 8.01) 0.46
Missing [1] [2]
Previous cycling crash resulting in injury in the past 3 years
No 192 (71.9) 58 (79.4) 1.00
Yes 75 (28.1) 15 (20.6) 0.63 (0.34 to 1.18) 0.15
Missing [5] [3]
Psychometric scores
Normlessness: Median (IQR) 2.3 (2.0 to 2.8) 2.0 (1.8 to 2.5)
Normlessness <medianb 118 (44.4) 42 (56.8) 1.00
Normlessness≥ medianb 148 (55.6) 32 (43.2) 0.57 (0.33 to 0.99) 0.04
Missing [6] [2]
Sensation Seeking: Median (IQR) 2.9 (2.5 to 3.3) 2.8 (2.3 to 3.4)
Sensation Seeking < medianc 104 (38.5) 32 (42.1) 1.00
Sensation Seeking ≥ medianc 166 (61.5) 44 (57.9) 0.84 (0.49 to 1.44) 0.53
Missing [2] [0]
a Wald p-values from conditional regression to account for matching
b Dichotomised at overall median value of 2.25
c Dichotomised at overall median value of 2.75
20
Table 2 Characteristics of bicycle use and journey characteristics by case-control status Characteristic Control n=272
(%)
Case n=76 (%)
Unadjusted odds ratio (95% CI)
P value*
Regular cyclist (one or more journeys per week since age 16) 0.005
<1 year 31 (11.5) 16 (21.1) 1.00
1-3 years 48 (17.8) 11 (14.5) 0.35 (0.13 to 0.94) 4-10 years 29 (10.7) 15 (19.7) 0.98 (0.38 to 2.50) > 10 years 162 (60.0) 34 (44.7) 0.34 (0.15 to 0.74)
Missing [2] [0]
Distance cycled during the previous week (km)
Median (IQR) 48.2 (24.2 to 72.5) 56.4 (24.2 to 96.6) 1.04 (0.99 to 1.09)a 0.12
Missing [7] [3]
Number of cycle trips during the previous week
Median (IQR) 7 (4 to 10) 7 (5 to 11) 1.03 (0.98 to 1.08)b 0.26
Missing [2] [6]
Route length (km)
Median (IQR) 4.9 (3.4 to 7.2) 6.0 (3.8 to 7.8) 1.02 (0.97 to 1.08) 0.45
Missing [9] [4]
Route risk score†
Median (IQR) 268.5 (192.6 to 464.5) 378.5 (232.4 to 548.3) 1.19 (1.06 to 1.33)c 0.002
Missing [35] [15]
Bicycle type
Commuter or folding 123 (46.1) 25 (33.3) 1.00
Mountain or racing 144 (53.9) 50 (66.7) 1.87 (1.05 to 3.32) 0.05
Missing [5] [1]
Wearing a cycle helmet
No 94 (34.6) 32 (42.1) 1.00
Yes 178 (65.4) 44 (57.9) 0.79 (0.46 to 1.38) 0.41
Lighting conditions 0.003
Sunshine 93 (34.3) 38 (50.0) 1.00
Overcast 106 (39.1) 17 (22.4) 0.22 (0.09 to 0.52) Dawn or dusk 27 (10.0) 5 (6.6) 0.17 (0.04 to 0.63) Dark: street lighting 43 (15.9) 12 (15.8) 0.43 (0.10 to 1.82) Dark: no street lights 2 (0.7) 4 (5.3) 3.60 (0.30 to 42.93)
Missing [1] [0]
Weather conditions 0.07
Good 212 (78.2) 57 (76.0) 1.00
Moderate 36 (13.3) 15 (20.0) 1.50 (0.67 to 3.36)
Poor 23 (8.5) 3 (4.0) 0.28 (0.08 to 1.05)
Missing [1] [1]
* Wald p-values from conditional regression to account for matching
† Estimated bicycle crashes per 100 million cyclists per kilometre along each participant’s route
a Per additional 10 km cycled during the previous week
b Per additional trip during the previous week
21
Table 3 Conspicuity aid use by case-control status and unadjusted odds ratios Control (%)
n=272
Case (%) n=76
Unadjusted odds ratio (95% CI)
P value*
Fluorescent and reflective clothing and equipment use Any conspicuity aid (any fluorescent or
reflective item on body or on helmet)
178 (65.4) 53 (69.7) 1.20 (0.66 to 2.17) 0.55
Fluorescent and reflective item on body or helmet
101 (37.1) 31 (40.8) 1.12 (0.64 to 1.96) 0.68
Any fluorescent item on body 119 (43.8) 33 (43.4) 0.89 (0.50 to 1,58) 0.69 Any reflective item on body 160 (58.8) 51 (67.1) 1.49 (0.84 to 2.64) 0.18 Fluorescent cycle helmet 6 (2.2) 12 (15.8) 6.65 (2.40 to 18.44) <0.001 Reflective cycle helmet 88 (32.4) 26 (34.2) 1.12 (0.65 to 1.94) 0.67 Fluorescent clothing on upper body 93 (34.2) 24 (31.6) 0.78 (0.43 to 1.42) 0.41 Reflective clothing on upper body 113 (41.5) 39 (51.3) 1.44 (0.83 to 2.49) 0.20 Fluorescent clothing on lower body† 1 (0.4) 2 (2.6) -
Reflective clothing on lower body 29 (10.7) 17 (22.4) 2.76 (1.35 to 5.64) 0.005 Fluorescent ankle bands or cycle clips 41 (15.1) 6 (7.9) 0.47 (0.19 to 1.17) 0.11 Reflective ankle bands or cycle clips 25 (9.2) 9 (11.8) 1.33 (0.56 to 3.15) 0.52 Lit lights (constant or flashing) 75 (28.1) 27 (35.5) 1.59 (0.67 to 3.78) 0.30
22 Table 4 Univariate associations between participant and bicycle use characteristics and
conspicuity aid use in cases and controls
Used a conspicuity aid
Characteristics No
N=117 (row %)
Yes N=231 (row %)
Unadjusted odds ratio (95% CI)
P value Age
Mean age in years (SD) 38.8 (15.0) 40.4 (11.3) 1.01 (0.99 to 1.03) 0.28
Missing [1] [1]
Gender
Male 83 (35.9) 148 (64.1) 1.00
Female 34 (29.3) 82 (70.7) 1.35 (0.84 to 2.19) 0.22
Missing [0] [1]
Deprivation score
Median (IQR) 13.7 (9.9, 32.1) 14.6 (9.1, 26.1) 0.99 (0.98 to 1.01) 0.31
Missing [2] [3]
Possession of a driving licence
No Driving Licence 27 (40.9) 39 (59.1) 1.00
Driving Licence 90 (31.9) 192 (68.1) 1.48 (0.85 to 2.56) 0.17 Bicycle proficiency training during childhood
No training 52 (34.0) 101 (66.0) 1.00
Had training 63 (33.9) 123 (66.1) 1.01 (0.64 to 1.58) 0.98
Missing [2] [7]
Bicycle crash causing injury in the previous three years
No previous crash 93 (37.2) 157 (62.8) 1.00
Previous crash 23 (25.6) 67 (74.4) 1.73 (1.01 to 2.96) 0.05
Missing [1] [7]
Wearing a helmet during the crash or study journey
Not wearing helmet 79 (62.7) 47 (37.3) 1.00
Wearing helmet 38 (17.1) 184 (82.9) 8.14 (4.93 to 13.45) <0.001 Cycling experience (years regular cycling as an adult) 0.57
<1 year 15 (31.9) 32 (68.1) 1.00
1-3 years 20 (33.9) 39 (66.1) 0.91 (0.40 to 2.07) 4-10 years 19 (43.2) 25 (56.8) 0.62 (0.26 to 1.45) >10 years 63 (32.1) 133 (67.9) 0.99 (0.50 to 1.96)
Missing [0] [2]
Bicycle type
Commuter or folding bicycle 42 (29.2) 102 (70.8) 1.00
Racing or mountain bicycle 70 (37.0 119 (63.0) 0.70 (0.44 to 1.11) 0.13
Missing [5] [10]
Normlessness
median (IQR) 2.25 (1.75, 2.75) 2.25 (1.75, 2.50)
≤ median 47 (29.4) 113 (70.6) 1.00
> median 66 (36.7) 114 (63.3) 0.72 (0.46 to 1.13) 0.16
Missing [4] [4]
Sensation Seeking
median (IQR)† 3.0 (2.5, 3.5) 2.75 (2.25, 3.25)
≤ median 38 (27.9) 98 (72.1) 1.00
> median 79 (37.6) 131 (62.4) 0.64 (0.40 to 1.03) 0.06
Missing [0] [2]
Light levels during crash or study journey
23
Overcast 53 (43.1) 70 (56.9) 0.79 (0.48 to 1.30) Dawn or dusk 6 (18.8) 26 (81.3) 2.59 (1.00 to 6.73) Darknessa 9 (14.8) 52 (85.3) 3.45 (1.57 to 7.62)
Missing [0] [1]
Route length (km)
median (IQR) 4.0 ( 2.4, 6.1) 6.0 (4.3, 7.9)
≤ median† 79 (46.2) 92 (53.8) 1.00
> median 33 (20.1) 131 (79.9) 3.41 (2.10 to 5.54) <0.001
Missing [5] [8]
Distance cycled in the previous 7 days (km)
Median (IQR) 38.6 (16.1, 64.4) 48.3 (28.9, 80.5)
≤ median 75 (39.1) 117 (60.9) 1.00
> median† 36 (24.7) 110 (75.3) 1.96 (1.22 to 3.15)
Missing [6] [4]
Route riskb
median (IQR) 272.3 (203.7, 413.4) 308.1 (198.0, 504.3)
≤ median† 53 (35.6) 96 (64.4) 1.00
> median 43 (28.9) 106 (71.1) 1.36 (0.84 to 2.22) 0.22
Missing [21] [29]
a Street-lighting and darkness with no street-lighting combined due to small numbers in each cell
b Estimated bicycle crashes per 100 million cyclists per kilometre along each participant’s route
24
Table 5 Adjusted odds ratios (95% CI) in final multivariable model for collision or evasion crash by conspicuity aid use
25
Table 6 Odds ratios for the risk of a collision or evasion crash associated with any conspicuity aids with adjustment for each individual potential confounder
Confounder adjustment Odds ratio (95% CI) for conspicuity aid use
P value n Unadjusted 1.20 (0.66 to 2.17) 0.55 348 Adjusted by:
Age 1.32 (0.71 to 2.42) 0.38 346
Gender 1.24 (0.68 to 2.26) 0.49 347
Index of multiple deprivation 1.35 (0.74 to 2.50) 0.33 342 Driving Licence holder 1.27 (0.69 to 2.33) 0.45 348 Childhood cycle training 1.19 (0.65 to 2.20) 0.57 333 Previous cycle crash 1.11 (0.60 to 2.04) 0.74 329 Normlessness Score 1.17 (0.64 to 2.14) 0.61 346 Sensation Seeking Score 1.18 (0.65 to 2.14) 0.60 346 Cycling Experience 1.43 (0.78 to 2.64) 0.25 346 Route Length 1.07 (0.57 to 2.00) 0.83 323 Route risk* 1.64 (0.82 to 3.28) 0.16 258
Bicycle type 1.30 (0.71 to 2.38) 0.39 325 Wearing a cycle helmet 1.40 (0.73 to 2.71) 0.31 348 Light Level 1.26 (0.67 to 2.35) 0.48 347 Weather conditions 1.20 (0.65 to 2.21) 0.56 340
26
Figure 1 Recruitment by case-control status
Adult cyclists screened after attending study site ED after injury
cycle crash n=571
Not Approached To Participate n=10
Lacked capacity n=4 Died in ED n=1
Refused n=1
Incorrect or missing contact details n=4
Approached n=561 No Response
n=353
Excluded From Study n=3 Could not recall crash n=1
Moped rider n=1 Non-transport injury n=1
Questionnaires received n=205 Excluded From Matched Analysis
n=129
Crash out of area n=7 Crash out of hours n=2 Unusable data n=4 No available controls n=7 Out of time for controls n=4 Ineligible journey purpose n=36 Non-Collision / Evasion Crash n=69
Cases n=76 (13%)
Adult cyclists approached at local companies, organisations or public
places n=505
Not given Study Pack n=42 Refused n=27
Refused second approach n=15
Questionnaires received n=293 Excluded from matched analysis
n= 21
Non-matched day of journey n=5 Non-matched journey purpose n=9
Non-matched time of journey n=7 Pack given n= 463 No reponse n=170